Greenfield, CA (California) Houses and Residents
| Greenfield: | $453,299 |
| California: | $715,900 |
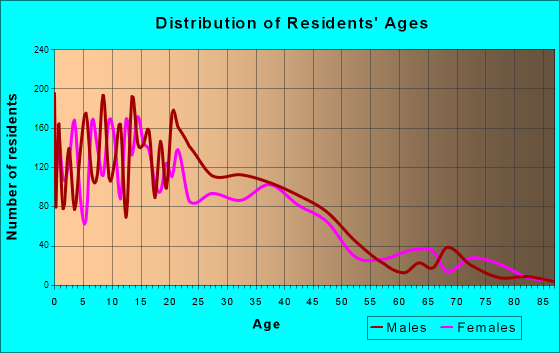
Total population: 16,929 (Urban population: 12,628 (all inside urban clusters), Rural population: 0)
Houses: 4,454 (4,215 occupied: 2,168 owner occupied, 2,049 renter occupied)
| % of renters here: | 49% |
| State: | 44% |
Housing density: 2,625 houses/condos per square mile
Median price asked for vacant for-sale houses and condos in 2022: $1,075,026.
Median contract rent in 2022: $1,479 (lower quartile is $1,149, upper quartile is $1,805)
Median rent asked for vacant for-rent units in 2022: $3,667
Median gross rent in Greenfield, CA in 2022: $1,658
Housing units in Greenfield with a mortgage: 1,463 (143 second mortgage, 0 home equity loan, 129 both second mortgage and home equity loan)
Houses without a mortgage: 13
Median household income for houses/condos with a mortgage: $95,786
Median household income for apartments without a mortgage: $49,810
Median monthly housing costs: $1,676
Compare current foreclosures near Greenfield, CA:
| Photo | Address | Area | Beds / Baths | Price | Details |
|---|---|---|---|---|---|

|
#1
Primavera Ct
Greenfield, CA 93927
|
871 sq. feet
|
1 baths 2 beds |
show details | |

|
#2
10th St
Greenfield, CA 93927
|
1,486 sq. feet
|
2 baths 3 beds |
show details | |

|
#3
Paloma Dr
Greenfield, CA 93927
|
1,146 sq. feet
|
2 baths 3 beds |
show details | |

|
#4
Spark St
Greenfield, CA 93927
|
- sq. feet
|
2 baths 4 beds |
show details | |

|
#5
Borzini Cir
Greenfield, CA 93927
|
- sq. feet
|
3 baths 5 beds |
show details | |

|
#6
Carmel Valley Rd
Greenfield, CA 93927
|
- sq. feet
|
2 baths 4 beds |
show details | |

|
#7
Apple Ave
Greenfield, CA 93927
|
- sq. feet
|
3 baths 4 beds |
show details | |

|
#8
Tawny Port Way
Greenfield, CA 93927
|
- sq. feet
|
2 baths 3 beds |
show details | |

|
#9
Saint Matthews St
Greenfield, CA 93927
|
- sq. feet
|
2 baths 3 beds |
show details | |

|
#10
10th St Apt 3
Greenfield, CA 93927
|
- sq. feet
|
- baths - beds |
show details |
| Photo | Address | Area | Beds / Baths | Price | Details |
|---|---|---|---|---|---|

|
#11
Avina Ave
Greenfield, CA 93927
|
- sq. feet
|
- baths - beds |
show details | |

|
#12
13th St
Greenfield, CA 93927
|
- sq. feet
|
- baths - beds |
show details | |

|
#13
10th St
Greenfield, CA 93927
|
- sq. feet
|
- baths - beds |
show details | |

|
#14
Pinnacles Ave
Greenfield, CA 93927
|
- sq. feet
|
- baths - beds |
show details | |

|
#15
Cardona Cir
Greenfield, CA 93927
|
- sq. feet
|
- baths - beds |
show details | |

|
#16
Oak Ave
Greenfield, CA 93927
|
- sq. feet
|
- baths - beds |
show details | |

|
#17
Elm Ave
Greenfield, CA 93927
|
- sq. feet
|
- baths - beds |
show details | |

|
#18
Pinnacles Ave
Greenfield, CA 93927
|
- sq. feet
|
- baths - beds |
show details | |

|
#19
Elm Ave Apt 20a
Greenfield, CA 93927
|
- sq. feet
|
- baths - beds |
show details | |

|
#20
Sussex Way
King City, CA 93930
|
1,235 sq. feet
|
2 baths 4 beds |
show details |
| Photo | Address | Area | Beds / Baths | Price | Details |
|---|---|---|---|---|---|

|
#21
Main St
Soledad, CA 93960
|
1,542 sq. feet
|
2 baths 3 beds |
show details | |

|
#22
Munras St
Soledad, CA 93960
|
1,233 sq. feet
|
2 baths 3 beds |
show details | |

|
#23
Sentinel St
Soledad, CA 93960
|
1,396 sq. feet
|
2 baths 3 beds |
show details | |

|
#24
Pine Canyon Rd
King City, CA 93930
|
2,301 sq. feet
|
2 baths 3 beds |
show details | |

|
#25
Pine Meadow Dr
King City, CA 93930
|
1,574 sq. feet
|
2 baths 3 beds |
show details | |

|
#26
San Vicente Rd
Soledad, CA 93960
|
2,780 sq. feet
|
2 baths 4 beds |
show details | |

|
#27
Granada St
Soledad, CA 93960
|
2,743 sq. feet
|
3 baths 3 beds |
show details | |

|
#28
Munras St
Soledad, CA 93960
|
1,233 sq. feet
|
2 baths 3 beds |
show details | |

|
#29
Pearl St
King City, CA 93930
|
1,380 sq. feet
|
1 baths 3 beds |
show details | |

|
#30
N San Lorenzo St
King City, CA 93930
|
1,783 sq. feet
|
1 baths 3 beds |
show details |
| Photo | Address | Area | Beds / Baths | Price | Details |
|---|---|---|---|---|---|

|
#31
N Mildred Ave
King City, CA 93930
|
1,866 sq. feet
|
2 baths 4 beds |
show details | |

|
#32
N Mildred Ave
King City, CA 93930
|
1,757 sq. feet
|
2 baths 4 beds |
show details | |

|
#33
Charolais Dr
Gonzales, CA 93926
|
- sq. feet
|
2 baths 4 beds |
show details | |

|
#34
Spreckels Rd
King City, CA 93930
|
- sq. feet
|
2 baths 5 beds |
show details | |

|
#35
Head St
Soledad, CA 93960
|
- sq. feet
|
2 baths 4 beds |
show details | |

|
#36
Madrid St
Soledad, CA 93960
|
- sq. feet
|
2 baths 6 beds |
show details | |

|
#37
Holstein Way
Gonzales, CA 93926
|
- sq. feet
|
2 baths 4 beds |
show details | |

|
#38
San Antonio
Soledad, CA 93960
|
- sq. feet
|
2 baths 5 beds |
show details | |

|
#39
La Colina St
Soledad, CA 93960
|
- sq. feet
|
2 baths 4 beds |
show details | |

|
#40
Fabry Rd
Soledad, CA 93960
|
- sq. feet
|
- baths - beds |
show details |
| Photo | Address | Area | Beds / Baths | Price | Details |
|---|---|---|---|---|---|

|
#41
Ventura Dr
Soledad, CA 93960
|
- sq. feet
|
- baths - beds |
show details | |

|
#42
Airline Hwy
King City, CA 93930
|
- sq. feet
|
- baths - beds |
show details | |

|
#43
Luna Way
Soledad, CA 93960
|
- sq. feet
|
- baths - beds |
show details | |

|
#44
Little Creek Ct
King City, CA 93930
|
- sq. feet
|
- baths - beds |
show details | |

|
#45
Luna Way
Soledad, CA 93960
|
- sq. feet
|
- baths - beds |
show details | |

|
#46
Gabilan Dr
Soledad, CA 93960
|
- sq. feet
|
- baths - beds |
show details | |

|
#47
Brumwell St
King City, CA 93930
|
- sq. feet
|
- baths - beds |
show details | |

|
#48
Mustang Ct Unit A
King City, CA 93930
|
- sq. feet
|
- baths - beds |
show details | |

|
#49
Casey St
King City, CA 93930
|
- sq. feet
|
- baths - beds |
show details | |

|
Check over 1 million property listings on Foreclosure.com!
|
browse all offers | |||

Latest news about housing in Greenfield, CA collected exclusively by city-data.com from local newspapers, TV, and radio stations

 | Questions: Moving to slo county (32 replies) |
| Greenfield, CA (8 replies) |
| Is Monterey Conservative? (18 replies) |
| Can we afford Monterey Country? (11 replies) |
| Pros vs. Cons of moving to Salinas. Help Please (55 replies) |
| Living in Monterey County with kids (43 replies) |
Median year apartment built: 1993
Household type by relationship:
Households: 18,791- Male householders: 2,015 (181 living alone), Female householders: 2,110 (222 living alone)
2,357 spouses (2,335 opposite-sex spouses), 534 unmarried partners, (534 opposite-sex unmarried partners), 7,556 children (7,345 natural, 92 adopted, 117 stepchildren), 800 grandchildren, 787 brothers or sisters, 914 parents, 0 foster children, 1,282 other relatives, 362 non-relatives
- In group quarters: 70
Size of family households: 640 2-persons, 490 3-persons, 658 4-persons, 735 5-persons, 550 6-persons, 663 7-or-more-persons.
Size of nonfamily households: 404 1-person, 79 2-persons.
3,184 married couples with children.
2,355 single-parent households (910 men, 1,445 women).
16.1% of residents of Greenfield speak English at home.
84.0% of residents speak Spanish at home (46% speak English very well, 14% speak English well, 17% speak English not well, 24% don't speak English at all).
0.2% of residents speak other Indo-European language at home (100% speak English very well).
0.7% of residents speak Asian or Pacific Island language at home (90% speak English very well, 10% speak English well).
1.8% of residents speak other language at home (24% speak English well, 14% speak English not well, 62% don't speak English at all).
Foreign born population: 7,904 (42.1%)
(16.2% of them are naturalized citizens)
| Here: | 5.6 |
| State: | 6.0 |
| Here: | 4.6 |
| State: | 3.9 |

- Bedrooms in owner-occupied houses and condos in Greenfield, California
- 43no bedroom
- 121 bedroom
- 1622 bedrooms
- 9023 bedrooms
- 8694 bedrooms
- 1805+ bedrooms

- Bedrooms in renter-occupied apartments in Greenfield, California
- 102no bedroom
- 2531 bedroom
- 6532 bedrooms
- 7953 bedrooms
- 2474 bedrooms
- 05+ bedrooms

- Cars and other vehicles available in Greenfield in owner-occupied houses/condos
- 19no vehicle
- 2921 vehicle
- 6532 vehicles
- 6973 vehicles
- 2884 vehicles
- 2195+ vehicles

- Cars and other vehicles available in Greenfield in renter-occupied apartments
- 191no vehicle
- 4131 vehicle
- 7792 vehicles
- 5113 vehicles
- 1084 vehicles
- 475+ vehicles

- Rooms in owner-occupied houses in Greenfield, California
- 01 room
- 432 rooms
- 283 rooms
- 1964 rooms
- 6375 rooms
- 7346 rooms
- 2517 rooms
- 1288 rooms
- 1519+ rooms

- Rooms in renter-occupied apartments in Greenfield, California
- 1021 room
- 362 rooms
- 3043 rooms
- 5254 rooms
- 7425 rooms
- 1966 rooms
- 617 rooms
- 158 rooms
- 689+ rooms


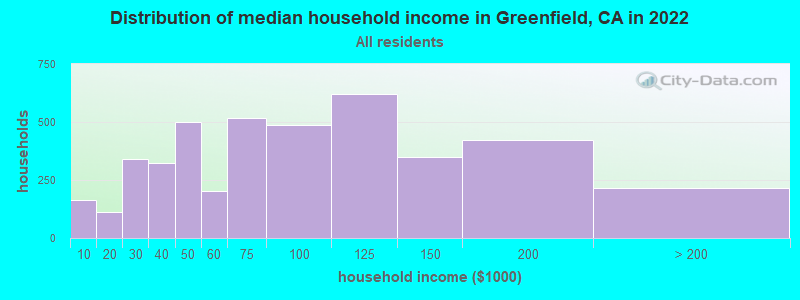
Greenfield, CA household income distribution

- 163Less than $10,000
- 112$10,000 to $19,999
- 342$20,000 to $29,999
- 324$30,000 to $39,999
- 502$40,000 to $49,999
- 201$50,000 to $59,999
- 516$60,000 to $74,999
- 487$75,000 to $99,999
- 620$100,000 to $124,999
- 347$125,000 to $149,999
- 421$150,000 to $199,999
- 216$200,000 or more
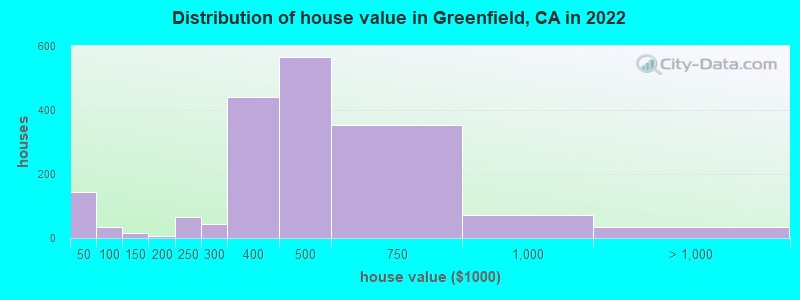
Home value of owner - occupied houses in 2022 in Greenfield, CA
-
- 67Less than $10,000
- 41$35,000 to $39,999
- 34$40,000 to $49,999
- 15$125,000 to $149,999
- 6$150,000 to $174,999
- 65$200,000 to $249,999
- 42$250,000 to $299,999
- 440$300,000 to $399,999
- 566$400,000 to $499,999
- 354$500,000 to $749,999
- 72$750,000 to $999,999
- 35$1,000,000 to $1,499,999
Rent paid by renters in 2022 in Greenfield, CA
-
- 18$150 to $199
- 85$200 to $249
- 11$250 to $299
- 23$400 to $449
- 4$450 to $499
- 11$650 to $699
- 38$750 to $799
- 75$800 to $899
- 39$900 to $999
- 252$1,000 to $1,249
- 384$1,250 to $1,499
- 793$1,500 to $1,999
- 204$2,000 to $2,499
- 13$3,000 to $3,499
- 34No cash rent


Percentage of workers working in this county: 97.1%
Number of people working at home: 111 (1.6% of all workers)
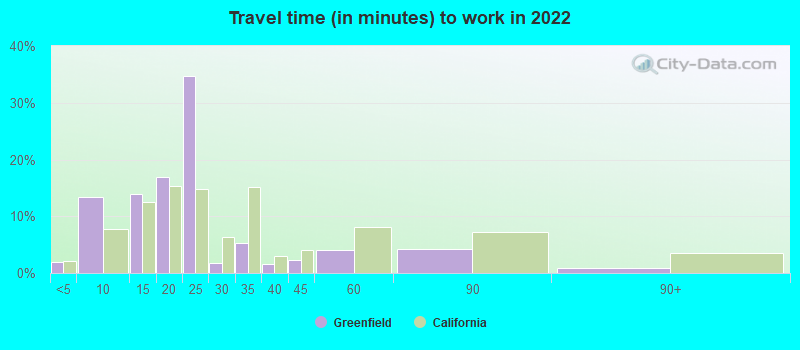
Travel time to work (commute)
- Less than 5 minutes: 103
- 5 to 9 minutes: 490
- 10 to 14 minutes: 524
- 15 to 19 minutes: 1,227
- 20 to 24 minutes: 1,885
- 25 to 29 minutes: 154
- 30 to 34 minutes: 652
- 35 to 39 minutes: 386
- 40 to 44 minutes: 522
- 45 to 59 minutes: 353
- 60 to 89 minutes: 352
- 90 or more minutes: 184
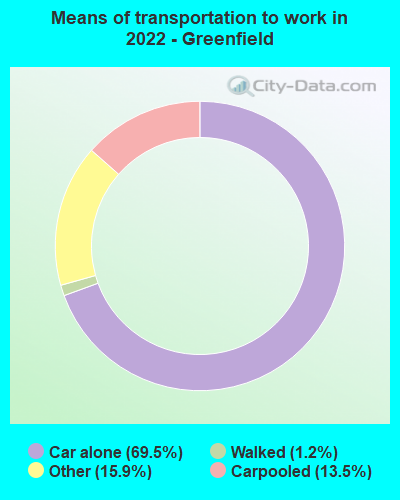
Means of transportation to work:
- Drove a car alone: 1,725 (65.2%)
- Carpooled: 303 (11.5%)
- Taxi: 307 (11.6%)
- Walked: 35 (1.3%)
- Worked at home: 111 (4.2%)

- Unemployment by race in 2022
- Unemployment rate for Black residents
- 29.9%Females
- Unemployment rate for other race residents
- 0.6%Males
- 0.9%Females
- Unemployment rate for two or more race residents
- 1.1%Males
- 3.8%Females
- Unemployment rate for Hispanic or Latino residents
- 0.5%Males
- 2.1%Females

- Year of entry for the foreign-born population in Greenfield, California
- 1,4852010 or later
- 1,9592000 to 2009
- 2,0441990 to 1999
- 1,8361980 to 1989
- 9671970 to 1979
- 649Before 1970
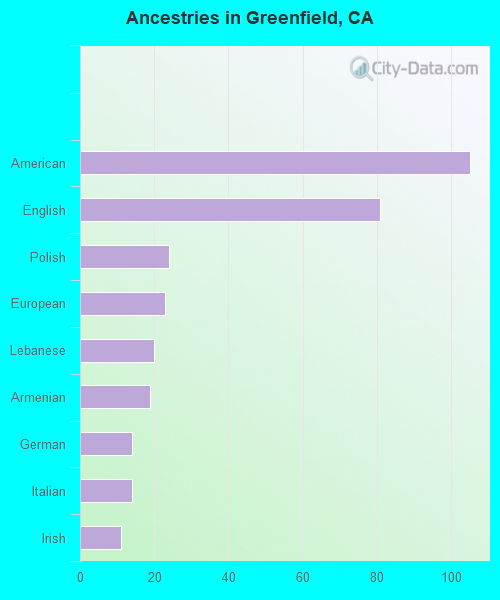
First ancestries reported:
- American: 105 (0.7%)
- English: 81 (0.6%)
- Polish: 24 (0.2%)
- European: 23 (0.2%)
- Lebanese: 20 (0.1%)
- Armenian: 19 (0.1%)
- German: 14 (0.10%)
- Italian: 14 (0.10%)
- Irish: 11 (0.08%)
Most common places of birth for foreign-born residents (%):
| Greenfield: | 92.2% (7,170) |
| California: | 37.2% (3,881,193) |
| Greenfield: | 2.7% (210) |
| California: | 0.6% (66,590) |
Place of birth for U.S.-born residents:
- This state: 10,397
- Other state: 429
- Northeast: 54
- Midwest: 106
- South: 133
- West: 133
93.2% of Greenfield residents lived in the same house 1 years ago.
Out of people who lived in different houses, 51.4% lived in this county.
Out of people who lived in different counties, 72.7% lived in California.
| Greenfield: | 93.2% |
| State average: | 88.9% |
Education attainment for males 25 years and older:
- No schooling: 635
- Nursery to 4th grade: 442
- 5th and 6th grade: 974
- 7th and 8th grade: 166
- 9th grade: 300
- 10th grade: 35
- 11th grade: 88
- 12th grade, no diploma: 209
- High school graduate (or equivalency): 1,069
- Less than 1 year of college: 200
- Some college more than 1 year, no degree: 404
- Associate degree: 142
- Bachelor's degree: 305
- Master's degree: 7
- Professional school degree: 0
- Doctorate degree: 22

Education attainment for females 25 years and older:
- No schooling: 616
- Nursery to 4th grade: 264
- 5th and 6th grade: 651
- 7th and 8th grade: 113
- 9th grade: 403
- 10th grade: 109
- 11th grade: 120
- 12th grade, no diploma: 194
- High school graduate (or equivalency): 1,217
- Less than 1 year of college: 183
- Some college more than 1 year, no degree: 385
- Associate degree: 384
- Bachelor's degree: 464
- Master's degree: 48
- Professional school degree: 10
- Doctorate degree: 0


Housing units in structures:
- One, detached: 3,213
- One, attached: 171
- Two: 190
- 3 or 4: 164
- 5 to 9: 262
- 10 to 19: 259
- 20 to 49: 109
- 50 or more: 14
- Mobile homes: 67
Housing units lacking complete kitchen facilities in 2022: 0.4%
House/condo owner moved in on average 14 years ago
Renter moved in on average 6 years ago

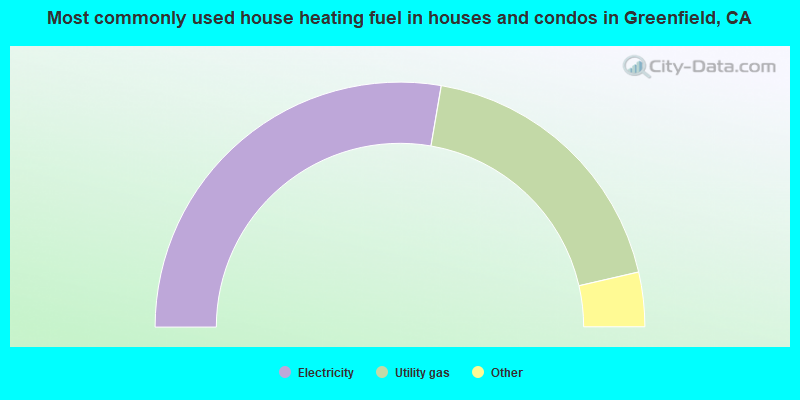
- 55.4%Electricity
- 37.4%Utility gas
- 3.4%Bottled, tank, or LP gas
- 2.2%Solar energy
- 1.2%No fuel used
- 0.4%Other fuel
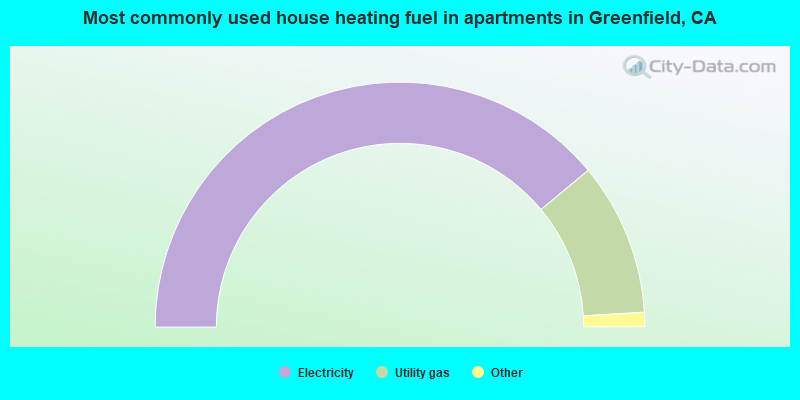
- 77.9%Electricity
- 20.2%Utility gas
- 1.5%Bottled, tank, or LP gas
- 0.4%Solar energy
Private vs. public school enrollment:
| Here: | 1.2% |
| California: | 10.5% |
| Here: | 0.0% |
| California: | 8.5% |
| Here: | 1.4% |
| California: | 15.9% |


