Groveland, FL (Florida) Houses and Residents
| Groveland: | $363,491 |
| Florida: | $354,100 |
Mean price in 2022:
Detached houses: $336,219
Here: $336,219 State: $500,941 Townhouses or other attached units: $199,657
Here: $199,657 State: $370,869 Mobile homes: $100,432
Here: $100,432 State: $113,202 Occupied boats, RVs, vans, etc.: $66,542
Here: $66,542 State: $73,933
Total population: 10,460 (Urban population: 2,115 (all inside urban clusters), Rural population: 185 (all nonfarm))
Houses: 7,741 (7,262 occupied: 6,669 owner occupied, 869 renter occupied)
| % of renters here: | 12% |
| State: | 33% |
Housing density: 2,943 houses/condos per square mile
Median price asked for vacant for-sale houses and condos in 2022: $577,868.
Median contract rent in 2022: $1,688 (lower quartile is $824, upper quartile is $1,893)
Median rent asked for vacant for-rent units in 2022: $1,223
Median gross rent in Groveland, FL in 2022: $1,693
Housing units in Groveland with a mortgage: 4,725 (76 second mortgage, 0 home equity loan, 71 both second mortgage and home equity loan)
Houses without a mortgage: 39
Median household income for houses/condos with a mortgage: $92,660
Median household income for apartments without a mortgage: $73,278
Median monthly housing costs: $1,560
Compare current foreclosures in Groveland, FL:
| Photo | Address | Area | Beds / Baths | Price | Details |
|---|---|---|---|---|---|

|
#1
Lake Catherine Cir
Groveland, FL 34736
|
2,590 sq. feet
|
2 baths 4 beds |
$329,900
|
show details |

|
#2
Anorak St
Groveland, FL 34736
|
1,942 sq. feet
|
2 baths 3 beds |
show details | |

|
#3
Hidden Pointe Ln
Groveland, FL 34736
|
1,870 sq. feet
|
2 baths 3 beds |
show details | |

|
#4
Baptist Island Rd
Groveland, FL 34736
|
1,344 sq. feet
|
2 baths 3 beds |
show details | |

|
#5
Whooping Dr
Groveland, FL 34736
|
1,980 sq. feet
|
2 baths 3 beds |
show details | |

|
#6
Park Central Cir
Groveland, FL 34736
|
1,359 sq. feet
|
2 baths 3 beds |
show details | |

|
#7
Westmoreland Ave
Groveland, FL 34736
|
3,014 sq. feet
|
3 baths 3 beds |
show details | |

|
#8
Newtown Rd
Groveland, FL 34736
|
1,808 sq. feet
|
2 baths 3 beds |
show details | |

|
#9
Bluegrass Dr
Groveland, FL 34736
|
1,882 sq. feet
|
2 baths 3 beds |
show details | |

|
#10
Bluegrass Dr
Groveland, FL 34736
|
1,942 sq. feet
|
2 baths 3 beds |
show details |
| Photo | Address | Area | Beds / Baths | Price | Details |
|---|---|---|---|---|---|

|
#11
Newtown Rd
Groveland, FL 34736
|
1,808 sq. feet
|
2 baths 3 beds |
show details | |

|
#12
Grovemont Estates Rd
Groveland, FL 34736
|
1,312 sq. feet
|
2 baths 2 beds |
show details | |

|
#13
Cheshire St
Groveland, FL 34736
|
1,880 sq. feet
|
2 baths 3 beds |
show details | |

|
#14
Dove Rd
Groveland, FL 34736
|
1,632 sq. feet
|
2 baths 3 beds |
show details | |

|
#15
Curtis Ave
Groveland, FL 34736
|
1,473 sq. feet
|
2 baths 3 beds |
show details | |

|
#16
Market St
Groveland, FL 34736
|
1,400 sq. feet
|
2 baths 3 beds |
show details | |

|
#17
W Greenwood St
Groveland, FL 34736
|
982 sq. feet
|
1 baths - beds |
show details | |

|
#18
Courtyard Ln
Groveland, FL 34736
|
- sq. feet
|
- baths - beds |
show details | |

|
#19
Douglas Rd
Groveland, FL 34736
|
- sq. feet
|
- baths - beds |
show details | |

|
#20
Bridges Rd
Groveland, FL 34736
|
- sq. feet
|
- baths - beds |
show details |
| Photo | Address | Area | Beds / Baths | Price | Details |
|---|---|---|---|---|---|

|
#21
Flowering Tree Cir
Groveland, FL 34736
|
- sq. feet
|
- baths - beds |
show details | |

|
#22
Black Eagle Dr
Groveland, FL 34736
|
- sq. feet
|
- baths - beds |
show details | |

|
#23
Blackstone Creek Rd
Groveland, FL 34736
|
- sq. feet
|
- baths - beds |
show details | |

|
#24
Prairie Falcon Dr
Groveland, FL 34736
|
- sq. feet
|
- baths - beds |
show details | |

|
#25
Sparrow Hawk Dr
Groveland, FL 34736
|
- sq. feet
|
- baths - beds |
show details | |

|
#26
Aspen View Cir
Groveland, FL 34736
|
- sq. feet
|
- baths - beds |
show details | |

|
#27
Islabella Way
Groveland, FL 34736
|
- sq. feet
|
- baths - beds |
show details | |

|
#28
Wilson Prairie Cir
Groveland, FL 34736
|
- sq. feet
|
- baths - beds |
show details | |

|
#29
Oglethorpe Dr
Groveland, FL 34736
|
- sq. feet
|
- baths - beds |
show details | |

|
#30
Lake Tarpon Way
Groveland, FL 34736
|
- sq. feet
|
- baths - beds |
show details |
| Photo | Address | Area | Beds / Baths | Price | Details |
|---|---|---|---|---|---|

|
#31
Chandler Dr
Groveland, FL 34736
|
- sq. feet
|
- baths - beds |
show details | |

|
#32
Lake Tarpon Way
Groveland, FL 34736
|
- sq. feet
|
- baths - beds |
show details | |

|
#33
Chandler Dr
Groveland, FL 34736
|
- sq. feet
|
- baths - beds |
show details | |

|
#34
Perch Hammock Loop
Groveland, FL 34736
|
- sq. feet
|
- baths - beds |
show details | |

|
#35
Blackstone Creek Rd
Groveland, FL 34736
|
- sq. feet
|
- baths - beds |
show details | |

|
#36
Lake Douglas Dr
Groveland, FL 34736
|
- sq. feet
|
- baths - beds |
show details | |

|
#37
Irving Bend Dr
Groveland, FL 34736
|
- sq. feet
|
- baths - beds |
show details | |

|
#38
Pretty Ranch Rd
Groveland, FL 34736
|
- sq. feet
|
- baths - beds |
show details | |

|
#39
Shady Oak Pl
Groveland, FL 34736
|
- sq. feet
|
- baths - beds |
show details | |

|
#40
Irving Bend Dr
Groveland, FL 34736
|
- sq. feet
|
- baths - beds |
show details |
| Photo | Address | Area | Beds / Baths | Price | Details |
|---|---|---|---|---|---|

|
#41
Wilson Prairie Cir
Groveland, FL 34736
|
- sq. feet
|
- baths - beds |
show details | |

|
#42
Gano Rd
Groveland, FL 34736
|
- sq. feet
|
- baths - beds |
show details | |

|
#43
Kinmore Dr
Groveland, FL 34736
|
- sq. feet
|
- baths - beds |
show details | |

|
#44
Sangmon Ct
Groveland, FL 34736
|
- sq. feet
|
- baths - beds |
show details | |

|
Check over 1 million property listings on Foreclosure.com!
|
browse all offers | |||

Latest news about housing in Groveland, FL collected exclusively by city-data.com from local newspapers, TV, and radio stations


Median year apartment built: 2007
Household type by relationship:
Households: 20,399- Male householders: 3,698 (704 living alone), Female householders: 3,643 (1,013 living alone)
3,792 spouses (3,792 opposite-sex spouses), 426 unmarried partners, (364 opposite-sex unmarried partners), 6,216 children (5,945 natural, 75 adopted, 195 stepchildren), 855 grandchildren, 382 brothers or sisters, 642 parents, 0 foster children, 169 other relatives, 530 non-relatives
- In group quarters: 42
Size of family households: 2,463 2-persons, 1,078 3-persons, 910 4-persons, 162 5-persons, 319 6-persons, 252 7-or-more-persons.
Size of nonfamily households: 1,794 1-person, 331 2-persons, 4 3-persons, 140 4-persons.
2,816 married couples with children.
1,495 single-parent households (333 men, 1,162 women).
80.9% of residents of Groveland speak English at home.
14.6% of residents speak Spanish at home (82% speak English very well, 10% speak English well, 7% speak English not well, 1% don't speak English at all).
0.9% of residents speak other Indo-European language at home (100% speak English very well).
2.8% of residents speak Asian or Pacific Island language at home (49% speak English very well, 32% speak English well, 19% speak English not well).
0.1% of residents speak other language at home (100% speak English well).
Foreign born population: 2,322 (11.4%)
(79.3% of them are naturalized citizens)
| Here: | 6.6 |
| State: | 5.9 |
| Here: | 5.1 |
| State: | 4.2 |

- Bedrooms in owner-occupied houses and condos in Groveland, Florida
- 48no bedroom
- 1311 bedroom
- 1,3062 bedrooms
- 2,1123 bedrooms
- 2,6204 bedrooms
- 4535+ bedrooms

- Bedrooms in renter-occupied apartments in Groveland, Florida
- 0no bedroom
- 851 bedroom
- 1052 bedrooms
- 6463 bedrooms
- 354 bedrooms
- 05+ bedrooms

- Cars and other vehicles available in Groveland in owner-occupied houses/condos
- 25no vehicle
- 1,8281 vehicle
- 3,1932 vehicles
- 1,2493 vehicles
- 3184 vehicles
- 575+ vehicles

- Cars and other vehicles available in Groveland in renter-occupied apartments
- 72no vehicle
- 1631 vehicle
- 5202 vehicles
- 513 vehicles
- 34 vehicles
- 605+ vehicles

- Rooms in owner-occupied houses in Groveland, Florida
- 481 room
- 02 rooms
- 1463 rooms
- 2854 rooms
- 1,2205 rooms
- 1,5066 rooms
- 1,2537 rooms
- 1,5048 rooms
- 7089+ rooms

- Rooms in renter-occupied apartments in Groveland, Florida
- 01 room
- 02 rooms
- 723 rooms
- 1104 rooms
- 3305 rooms
- 2346 rooms
- 1077 rooms
- 178 rooms
- 09+ rooms


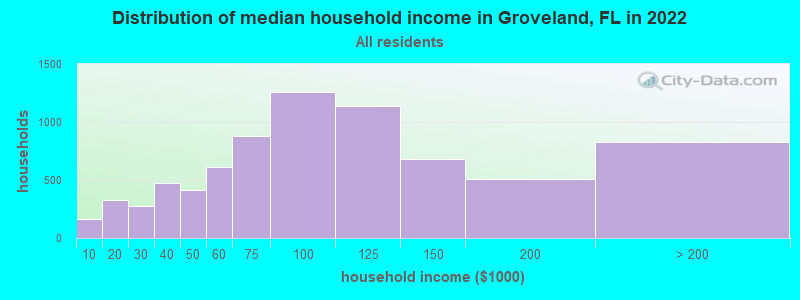
Groveland, FL household income distribution

- 160Less than $10,000
- 327$10,000 to $19,999
- 274$20,000 to $29,999
- 471$30,000 to $39,999
- 412$40,000 to $49,999
- 610$50,000 to $59,999
- 880$60,000 to $74,999
- 1,260$75,000 to $99,999
- 1,135$100,000 to $124,999
- 678$125,000 to $149,999
- 508$150,000 to $199,999
- 826$200,000 or more
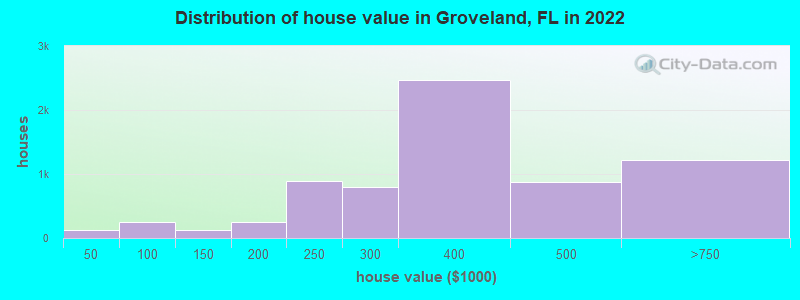
Home value of owner - occupied houses in 2022 in Groveland, FL
-
- 61$10,000 to $14,999
- 25$25,000 to $29,999
- 17$35,000 to $39,999
- 25$40,000 to $49,999
- 115$50,000 to $59,999
- 33$60,000 to $69,999
- 54$70,000 to $79,999
- 14$80,000 to $89,999
- 2$100,000 to $124,999
- 122$125,000 to $149,999
- 176$150,000 to $174,999
- 69$175,000 to $199,999
- 892$200,000 to $249,999
- 799$250,000 to $299,999
- 2,476$300,000 to $399,999
- 875$400,000 to $499,999
- 1,166$500,000 to $749,999
- 44$2,000,000 or more
Rent paid by renters in 2022 in Groveland, FL
-
- 95$100 to $149
- 90$600 to $649
- 43$700 to $749
- 19$800 to $899
- 13$900 to $999
- 82$1,000 to $1,249
- 37$1,250 to $1,499
- 465$1,500 to $1,999
- 88$2,000 to $2,499
- 33No cash rent


Percentage of workers working in this county: 53.0%
Number of people working at home: 1,537 (17.2% of all workers)
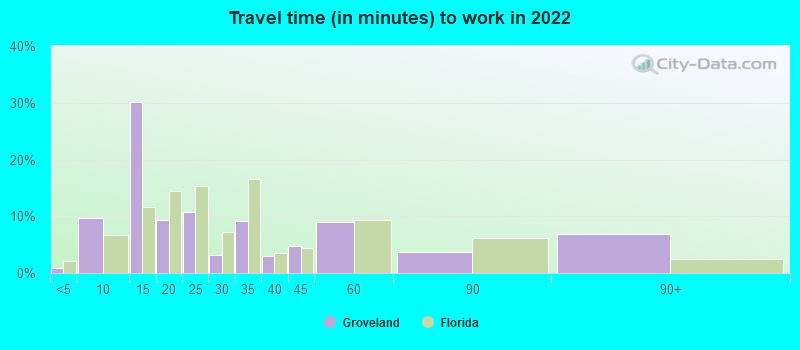
Travel time to work (commute)
- Less than 5 minutes: 61
- 5 to 9 minutes: 532
- 10 to 14 minutes: 635
- 15 to 19 minutes: 562
- 20 to 24 minutes: 811
- 25 to 29 minutes: 243
- 30 to 34 minutes: 746
- 35 to 39 minutes: 437
- 40 to 44 minutes: 469
- 45 to 59 minutes: 2,317
- 60 to 89 minutes: 769
- 90 or more minutes: 55
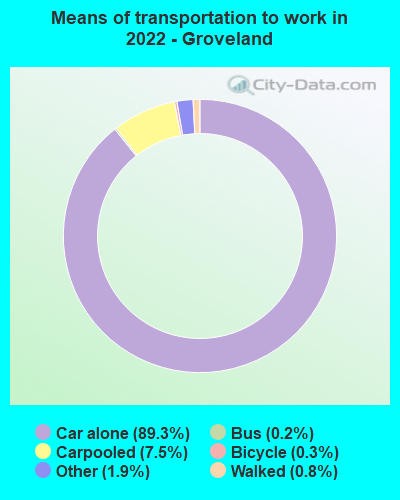
Means of transportation to work:
- Drove a car alone: 3,481 (66.1%)
- Carpooled: 309 (5.9%)
- Bus: 8 (0.2%)
- Taxi: 83 (1.6%)
- Bicycle: 12 (0.2%)
- Walked: 35 (0.7%)
- Worked at home: 1,537 (29.2%)

- Unemployment by race in 2022
- Unemployment rate for White non-Hispanic residents
- 1.7%Males
- 2.5%Females
- Unemployment rate for Black residents
- 5.0%Males
- 22.8%Females
- Unemployment rate for American Indian and Alaska Native residents
- 100.0%Males
- Unemployment rate for Asian residents
- 19.8%Males
- 15.6%Females
- Unemployment rate for two or more race residents
- 0.3%Males
- Unemployment rate for Hispanic or Latino residents
- 0.3%Males

- Year of entry for the foreign-born population in Groveland, Florida
- 7332010 or later
- 2702000 to 2009
- 3441990 to 1999
- 341980 to 1989
- 181970 to 1979
- 7Before 1970

First ancestries reported:
- American: 2,950 (24.3%)
- English: 952 (7.9%)
- German: 718 (5.9%)
- Jamaican: 357 (2.9%)
- Italian: 300 (2.5%)
- Guyanese: 277 (2.3%)
- Irish: 254 (2.1%)
- Polish: 145 (1.2%)
- European: 131 (1.1%)
- Russian: 60 (0.5%)
- French: 59 (0.5%)
- Slovak: 55 (0.5%)
- Welsh: 49 (0.4%)
- Haitian: 44 (0.4%)
- Austrian: 34 (0.3%)
- Trinidadian and Tobagonian: 32 (0.3%)
- Ukrainian: 31 (0.3%)
- French Canadian: 29 (0.2%)
- Pennsylvania German: 28 (0.2%)
- Dutch: 24 (0.2%)
- Danish: 23 (0.2%)
- Eastern European: 18 (0.1%)
- Portuguese: 16 (0.1%)
- Swedish: 13 (0.1%)
- Moroccan: 11 (0.09%)
- African: 9 (0.07%)
Most common places of birth for foreign-born residents (%):
| Groveland: | 14.7% (365) |
| Florida: | 5.0% (227,319) |
| Groveland: | 13.5% (334) |
| Florida: | 5.7% (262,042) |
| Groveland: | 11.6% (287) |
| Florida: | 0.7% (33,556) |
| Groveland: | 9.8% (243) |
| Florida: | 1.3% (60,604) |
| Groveland: | 8.1% (200) |
| Florida: | 0.5% (22,715) |
| Groveland: | 6.7% (167) |
| Florida: | 2.1% (97,632) |
| Groveland: | 5.4% (135) |
| Florida: | 0.3% (15,079) |
| Groveland: | 5.1% (127) |
| Florida: | 5.6% (257,152) |
| Groveland: | 4.8% (118) |
| Florida: | 22.0% (1,006,576) |
| Groveland: | 3.6% (90) |
| Florida: | 0.4% (16,570) |
| Groveland: | 3.1% (76) |
| Florida: | 1.0% (43,642) |
| Groveland: | 2.7% (67) |
| Florida: | 1.8% (84,403) |
| Groveland: | 1.7% (43) |
| Florida: | 7.5% (342,375) |
| Groveland: | 1.7% (41) |
| Florida: | 0.8% (37,723) |
Place of birth for U.S.-born residents:
- This state: 8,332
- Other state: 8,247
- Northeast: 4,124
- Midwest: 2,177
- South: 1,433
- West: 535
92.4% of Groveland residents lived in the same house 1 years ago.
Out of people who lived in different houses, 29.1% lived in this county.
Out of people who lived in different counties, 76.9% lived in Florida.
| Groveland: | 92.4% |
| State average: | 86.3% |
Education attainment for males 25 years and older:
- No schooling: 5
- Nursery to 4th grade: 0
- 5th and 6th grade: 8
- 7th and 8th grade: 0
- 9th grade: 95
- 10th grade: 14
- 11th grade: 369
- 12th grade, no diploma: 33
- High school graduate (or equivalency): 1,390
- Less than 1 year of college: 536
- Some college more than 1 year, no degree: 1,074
- Associate degree: 608
- Bachelor's degree: 1,298
- Master's degree: 568
- Professional school degree: 0
- Doctorate degree: 91

Education attainment for females 25 years and older:
- No schooling: 212
- Nursery to 4th grade: 32
- 5th and 6th grade: 21
- 7th and 8th grade: 5
- 9th grade: 2
- 10th grade: 65
- 11th grade: 52
- 12th grade, no diploma: 725
- High school graduate (or equivalency): 1,478
- Less than 1 year of college: 426
- Some college more than 1 year, no degree: 1,089
- Associate degree: 758
- Bachelor's degree: 1,699
- Master's degree: 1,150
- Professional school degree: 18
- Doctorate degree: 244


Housing units in structures:
- One, detached: 6,801
- One, attached: 215
- Two: 160
- 3 or 4: 224
- 5 to 9: 173
- 50 or more: 9
- Mobile homes: 29
- Boats, RVs, vans, etc.: 129
Housing units lacking complete kitchen facilities in 2022: 0.5%
House/condo owner moved in on average 5 years ago
Renter moved in on average 1 years ago

Private vs. public school enrollment:
| Here: | 33.2% |
| Florida: | 15.8% |
| Here: | 18.1% |
| Florida: | 12.9% |
| Here: | 55.1% |
| Florida: | 23.6% |


