Hackensack, NJ (New Jersey) Houses and Residents
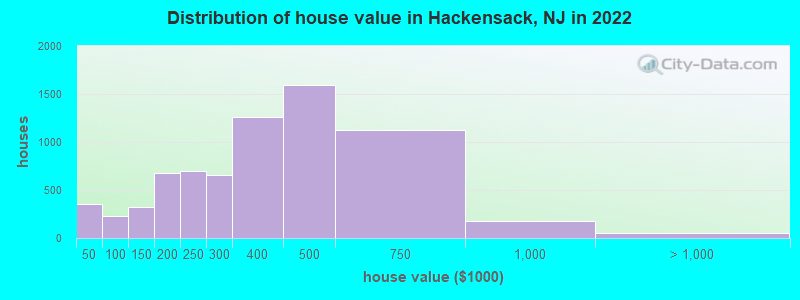
Estimated median house or condo value in 2022: $363,750 (it was $165,100 in 2000 )
Hackensack:
$363,750New Jersey:
$428,900
Lower value quartile - upper value quartile: $229,886 - $461,239Mean price in 2022: Detached houses: $428,802 Here:
$428,802State:
$537,591
Townhouses or other attached units: $307,878 Here:
$307,878State:
$381,113
In 2-unit structures: $403,671 Here:
$403,671State:
$444,476
In 3-to-4-unit structures: $327,780 Here:
$327,780State:
$457,463
In 5-or-more-unit structures: $238,016 Here:
$238,016State:
$368,745
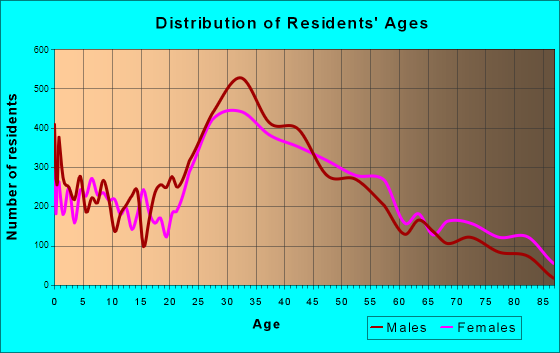
Total population: 44,519 (Urban population: 42,677, Rural population: 0)
Houses: 21,014 (19,894 occupied: 7,298 owner occupied, 12,702 renter occupied )
% of renters here:
64%State:
35%
Housing density: 5,100 houses/condos per square mile
Median price asked for vacant for-sale houses and condos in 2022: $393,215.
Median contract rent in 2022: $1,648 (lower quartile is $1,274, upper quartile is $1,977)
Median rent asked for vacant for-rent units in 2022: $1,535
Median gross rent in Hackensack, NJ in 2022: $1,721
Housing units in Hackensack with a mortgage: 4,937 (381 second mortgage, 0 home equity loan, 286 both second mortgage and home equity loan )Houses without a mortgage: 101
Median household income for houses/condos with a mortgage: $133,296
Median household income for apartments without a mortgage: $72,932
Median monthly housing costs: $1,764
Data:
Median house or condo value ($)
Median house or condo value ($ change since 2000)
Median house or condo value ($) - White
Median house or condo value ($) - Black or African American
Median house or condo value ($) - Asian
Median house or condo value ($) - Hispanic or Latino
Median house or condo value ($) - American Indian and Alaska Native
Median house or condo value ($) - Multirace
Median house or condo value ($) - Other Race
Median price asked for mobile homes ($)
Household density (households per square mile)
Mean house or condo value by units in structure - 1, detached ($)
Mean house or condo value by units in structure - 1, attached ($)
Mean house or condo value by units in structure - 2 ($)
Mean house or condo value by units in structure by units in structure - 3 or 4 ($)
Mean house or condo value by units in structure - 5 or more ($)
Mean house or condo value by units in structure - Boat, RV, van, etc. ($)
Mean house or condo value by units in structure - Mobile home ($)
Median contract rent ($)
Median contract rent - Lower quartile ($)
Median contract rent - Upper quartile ($)
Median gross rent ($)
Urban houses (%)
Rural houses (%)
Houses occupied (%)
Houses occupied (% change since 2000)
Houses owner occupied (%)
Houses owner occupied (% change since 2000)
Houses renter occupied (%)
Houses renter occupied (% change since 2000)
Vacant housing units - For rent (%)
Vacant housing units - For rent (% change since 2000)
Vacant housing units - For sale only (%)
Vacant housing units - For sale only (% change since 2000)
Vacant housing units - Rented or sold, not occupied (%)
Vacant housing units - Rented or sold, not occupied (% change since 2000)
Vacant housing units - For seasonal, recreational, or occasional use (%)
Vacant housing units - For seasonal, recreational, or occasional use (% change since 2000)
Vacant housing units - For migrant workers (%)
Vacant housing units - For migrant workers (% change since 2000)
Vacant housing units - Other vacant (%)
Vacant housing units - Other vacant (% change since 2000)
Median monthly housing costs ($)
Median household income for houses/condos with a mortgage ($)
Median household income for houses/condos without a mortgage ($)
Median household income ($)
Median household income ($) - White
Median household income ($) - Black or African American
Median household income ($) - Asian
Median household income ($) - Hispanic or Latino
Median household income ($) - American Indian and Alaska Native
Median household income ($) - Multirace
Median household income ($) - Other Race
Mortgage status - with mortgage (%)
Mortgage status - with second mortgage (%)
Mortgage status - with home equity loan (%)
Mortgage status - with both second mortgage and home equity loan (%)
Mortgage status - without a mortgage (%)
Median year house/condo built
Median year apartment built
Household type by relationship - Male householder living alone (%)
Household type by relationship - Male householder not living alone (%)
Household type by relationship - Female householder living alone (%)
Household type by relationship - Female householder not living alone (%)
Household type by relationship - Opposite-Sex spouse (%)
Household type by relationship - Same-Sex spouse (%)
Household type by relationship - Opposite-Sex unmarried partner (%)
Household type by relationship - Same-Sex unmarried partner (%)
Household type by relationship - In group quarters (%)
Size of family households - 2-person household (%)
Size of family households - 3-person household (%)
Size of family households - 4-person household (%)
Size of family households - 5-person household (%)
Size of family households - 6-person household (%)
Size of family households - 7-or-more-person household (%)
Size of nonfamily households - 1-person household (%)
Size of nonfamily households - 2-person household (%)
Size of nonfamily households - 3-person household (%)
Size of nonfamily households - 4-person household (%)
Size of nonfamily households - 5-person household (%)
Size of nonfamily households - 6-person household (%)
Size of nonfamily households - 7-or-moreperson household (%)
Year house built - Built 2010 or later (%)
Year house built - Built 2000 to 2009 (%)
Year house built - Built 1990 to 1999 (%)
Year house built - Built 1980 to 1989 (%)
Year house built - Built 1970 to 1979 (%)
Year house built - Built 1960 to 1969 (%)
Year house built - Built 1950 to 1959 (%)
Year house built - Built 1940 to 1949 (%)
Year house built - Built 1939 or earlier (%)
Median number of rooms in houses and condos
Median number of rooms in apartments
Median number of bedrooms in owner occupied houses
Mean number of bedrooms in owner occupied houses
Median number of bedrooms in renter occupied houses
Mean number of bedrooms in renter occupied houses
Median number of vehichles in owner occupied houses
Mean number of vehichles in owner occupied houses
Median number of vehichles in renter occupied houses
Mean number of vehichles in renter occupied houses
Rooms in owner-occupied houses - 1 room (%)
Rooms in owner-occupied houses - 2 rooms (%)
Rooms in owner-occupied houses - 3 rooms (%)
Rooms in owner-occupied houses - 4 rooms (%)
Rooms in owner-occupied houses - 5 rooms (%)
Rooms in owner-occupied houses - 6 rooms (%)
Rooms in owner-occupied houses - 7 rooms (%)
Rooms in owner-occupied houses - 8 rooms (%)
Rooms in owner-occupied houses - 9+ rooms (%)
Rooms in renter-occupied houses - 1 room (%)
Rooms in renter-occupied houses - 2 rooms (%)
Rooms in renter-occupied houses - 3 rooms (%)
Rooms in renter-occupied houses - 4 rooms (%)
Rooms in renter-occupied houses - 5 rooms (%)
Rooms in renter-occupied houses - 6 rooms (%)
Rooms in renter-occupied houses - 7 rooms (%)
Rooms in renter-occupied houses - 8 rooms (%)
Rooms in renter-occupied houses - 9+ rooms (%)
Bedrooms in owner-occupied houses - no bedrooms (%)
Bedrooms in owner-occupied houses - 1 bedroom (%)
Bedrooms in owner-occupied houses - 2 bedrooms (%)
Bedrooms in owner-occupied houses - 3 bedrooms (%)
Bedrooms in owner-occupied houses - 4 bedrooms (%)
Bedrooms in owner-occupied houses - 5+ bedrooms (%)
Bedrooms in renter-occupied houses - no bedrooms (%)
Bedrooms in renter-occupied houses - 1 bedroom (%)
Bedrooms in renter-occupied houses - 2 bedrooms (%)
Bedrooms in renter-occupied houses - 3 bedrooms (%)
Bedrooms in renter-occupied houses - 4 bedrooms (%)
Bedrooms in renter-occupied houses - 5+ bedrooms (%)
Vehicles available in owner-occupied houses - no vehicle available (%)
Vehicles available in owner-occupied houses - 1 vehicle available(%)
Vehicles available in owner-occupied houses - 2 Vehicles available (%)
Vehicles available in owner-occupied houses - 3 Vehicles available (%)
Vehicles available in owner-occupied houses - 4 Vehicles available (%)
Vehicles available in owner-occupied houses - 5+ Vehicles available (%)
Vehicles available in renter-occupied houses - no vehicle available (%)
Vehicles available in renter-occupied houses - 1 vehicle available (%)
Vehicles available in renter-occupied houses - 2 Vehicles available (%)
Vehicles available in renter-occupied houses - 3 Vehicles available (%)
Vehicles available in renter-occupied houses - 4 Vehicles available (%)
Vehicles available in renter-occupied houses - 5+ Vehicles available (%)
Housing units in structures - 1, detached (%)
Housing units in structures - 1, attached (%)
Housing units in structures - 2 (%)
Housing units in structures - 3 or 4 (%)
Housing units in structures - 5 to 9 (%)
Housing units in structures - 10 to 19 (%)
Housing units in structures - 20 to 49 (%)
Housing units in structures - 50 or more (%)
Housing units in structures - Mobile home (%)
Housing units in structures - Boat, RV, van, etc. (%)
Housing units in structures - Owners - 1, detached (%)
Housing units in structures - Owners - 1, attached (%)
Housing units in structures - Owners - 2 (%)
Housing units in structures - Owners - 3 or 4 (%)
Housing units in structures - Owners - 5 to 9 (%)
Housing units in structures - Owners - 10 to 19 (%)
Housing units in structures - Owners - 20 to 49 (%)
Housing units in structures - Owners - 50 or more (%)
Housing units in structures - Owners - Mobile home (%)
Housing units in structures - Owners - Boat, RV, van, etc. (%)
Housing units in structures - Renters - 1, detached (%)
Housing units in structures - Renters - 1, attached (%)
Housing units in structures - Renters - 2 (%)
Housing units in structures - Renters - 3 or 4 (%)
Housing units in structures - Renters - 5 to 9 (%)
Housing units in structures - Renters - 10 to 19 (%)
Housing units in structures - Renters - 20 to 49 (%)
Housing units in structures - Renters - 50 or more (%)
Housing units in structures - Renters - Mobile home (%)
Housing units in structures - Renters - Boat, RV, van, etc. (%)
House/condo owner moved in on average (years ago)
Renter moved in on average (years ago)
Year householder moved into unit - Moved in 1999 to March 2000 (%)
Year householder moved into unit - Moved in 1999 to March 2000 (%) - White
Year householder moved into unit - Moved in 1999 to March 2000 (%) - Black or African American
Year householder moved into unit - Moved in 1999 to March 2000 (%) - Asian
Year householder moved into unit - Moved in 1999 to March 2000 (%) - Hispanic or Latino
Year householder moved into unit - Moved in 1999 to March 2000 (%) - American Indian and Alaska Native
Year householder moved into unit - Moved in 1999 to March 2000 (%) - Multirace
Year householder moved into unit - Moved in 1999 to March 2000 (%) - Other Race
Year householder moved into unit - Moved in 1995 to 1998 (%)
Year householder moved into unit - Moved in 1995 to 1998 (%) - White
Year householder moved into unit - Moved in 1995 to 1998 (%) - Black or African American
Year householder moved into unit - Moved in 1995 to 1998 (%) - Asian
Year householder moved into unit - Moved in 1995 to 1998 (%) - Hispanic or Latino
Year householder moved into unit - Moved in 1995 to 1998 (%) - American Indian and Alaska Native
Year householder moved into unit - Moved in 1995 to 1998 (%) - Multirace
Year householder moved into unit - Moved in 1995 to 1998 (%) - Other Race
Year householder moved into unit - Moved in 1990 to 1994 (%)
Year householder moved into unit - Moved in 1990 to 1994 (%) - White
Year householder moved into unit - Moved in 1990 to 1994 (%) - Black or African American
Year householder moved into unit - Moved in 1990 to 1994 (%) - Asian
Year householder moved into unit - Moved in 1990 to 1994 (%) - Hispanic or Latino
Year householder moved into unit - Moved in 1990 to 1994 (%) - American Indian and Alaska Native
Year householder moved into unit - Moved in 1990 to 1994 (%) - Multirace
Year householder moved into unit - Moved in 1990 to 1994 (%) - Other Race
Year householder moved into unit - Moved in 1980 to 1989 (%)
Year householder moved into unit - Moved in 1980 to 1989 (%) - White
Year householder moved into unit - Moved in 1980 to 1989 (%) - Black or African American
Year householder moved into unit - Moved in 1980 to 1989 (%) - Asian
Year householder moved into unit - Moved in 1980 to 1989 (%) - Hispanic or Latino
Year householder moved into unit - Moved in 1980 to 1989 (%) - American Indian and Alaska Native
Year householder moved into unit - Moved in 1980 to 1989 (%) - Multirace
Year householder moved into unit - Moved in 1980 to 1989 (%) - Other Race
Year householder moved into unit - Moved in 1970 to 1979 (%)
Year householder moved into unit - Moved in 1970 to 1979 (%) - White
Year householder moved into unit - Moved in 1970 to 1979 (%) - Black or African American
Year householder moved into unit - Moved in 1970 to 1979 (%) - Asian
Year householder moved into unit - Moved in 1970 to 1979 (%) - Hispanic or Latino
Year householder moved into unit - Moved in 1970 to 1979 (%) - American Indian and Alaska Native
Year householder moved into unit - Moved in 1970 to 1979 (%) - Multirace
Year householder moved into unit - Moved in 1970 to 1979 (%) - Other Race
Year householder moved into unit - Moved in 1969 or earlier (%)
Year householder moved into unit - Moved in 1969 or earlier (%) - White
Year householder moved into unit - Moved in 1969 or earlier (%) - Black or African American
Year householder moved into unit - Moved in 1969 or earlier (%) - Asian
Year householder moved into unit - Moved in 1969 or earlier (%) - Hispanic or Latino
Year householder moved into unit - Moved in 1969 or earlier (%) - American Indian and Alaska Native
Year householder moved into unit - Moved in 1969 or earlier (%) - Multirace
Year householder moved into unit - Moved in 1969 or earlier (%) - Other Race
Housing units lacking complete plumbing facilities (%)
Housing units lacking complete kitchen facilities (%)
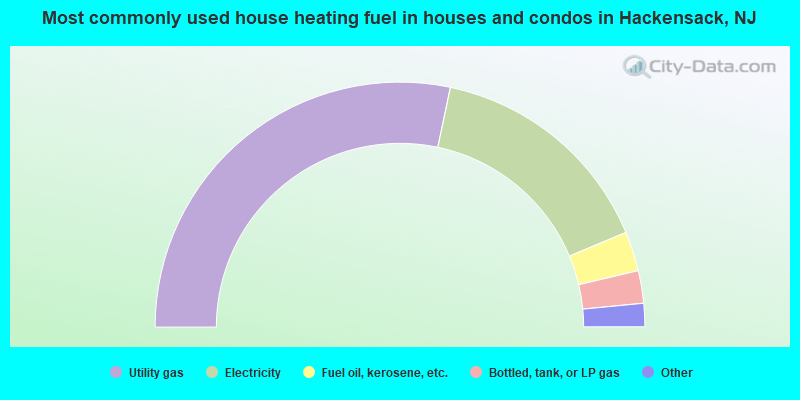
House heating fuel used in houses and condos - Utility gas (%)
House heating fuel used in houses and condos - Bottled, tank, or LP gas (%)
House heating fuel used in houses and condos - Electricity (%)
House heating fuel used in houses and condos - Fuel oil, kerosene, etc. (%)
House heating fuel used in houses and condos - Coal or coke (%)
House heating fuel used in houses and condos - Wood (%)
House heating fuel used in houses and condos - Solar energy (%)
House heating fuel used in houses and condos - Other fuel (%)
House heating fuel used in houses and condos - No fuel used (%)
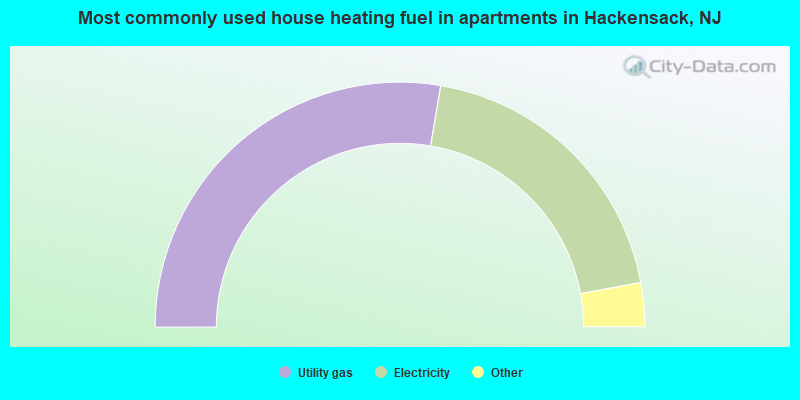
House heating fuel used in apartments - Utility gas (%)
House heating fuel used in apartments - Bottled, tank, or LP gas (%)
House heating fuel used in apartments - Electricity (%)
House heating fuel used in apartments - Fuel oil, kerosene, etc. (%)
House heating fuel used in apartments - Coal or coke (%)
House heating fuel used in apartments - Wood (%)
House heating fuel used in apartments - Solar energy (%)
House heating fuel used in apartments - Other fuel (%)
House heating fuel used in apartments - No fuel used (%)
Latest news about housing in Hackensack, NJ collected exclusively by city-data.com from local newspapers, TV, and radio stations
Median year house/condo built: 1960Median year apartment built: 1974Household type by relationship:
Households: 45,746
Male householders: 9,651 (3,678 living alone ), Female householders: 10,113 (3,981 living alone )6,364 spouses (6,300 opposite-sex spouses ), 1,550 unmarried partners , (1,464 opposite-sex unmarried partners ), 10,238 children (9,835 natural , 194 adopted , 207 stepchildren ), 651 grandchildren , 1,106 brothers or sisters , 1,350 parents , 52 foster children , 1,460 other relatives , 1,936 non-relatives In group quarters: 1,268
Size of family households: 4,165 2-persons , 3,202 3-persons , 1,733 4-persons , 886 5-persons , 242 6-persons , 218 7-or-more-persons .
Size of nonfamily households: 7,917 1-person , 1,412 2-persons , 241 3-persons , 21 4-persons , 121 5-persons , 6 7-or-more-persons .
4,195 married couples with children. single-parent households (345 men , 1,835 women ).
47.6% of residents of Hackensack speak English at home. of residents speak Spanish at home (51% speak English very well , 17% speak English well , 21% speak English not well , 10% don't speak English at all ).of residents speak other Indo-European language at home (70% speak English very well , 23% speak English well , 4% speak English not well , 3% don't speak English at all ).of residents speak Asian or Pacific Island language at home (56% speak English very well , 29% speak English well , 10% speak English not well , 4% don't speak English at all ).of residents speak other language at home (78% speak English very well , 16% speak English well , 6% speak English not well ).
Foreign born population: 19,879 (43.5%)of them are naturalized citizens )
Median number of rooms in houses and condos:
Median number of rooms in apartments
Owner-occupied Renter-occupied
Rooms in owner-occupied houses in Hackensack, New Jersey
160 1 room 69 2 rooms 994 3 rooms 1,438 4 rooms 1,294 5 rooms 1,168 6 rooms 1,025 7 rooms 538 8 rooms 612 9+ rooms
Rooms in renter-occupied apartments in Hackensack, New Jersey
1,067 1 room 1,542 2 rooms 4,733 3 rooms 3,150 4 rooms 1,184 5 rooms 565 6 rooms 245 7 rooms 75 8 rooms 143 9+ rooms
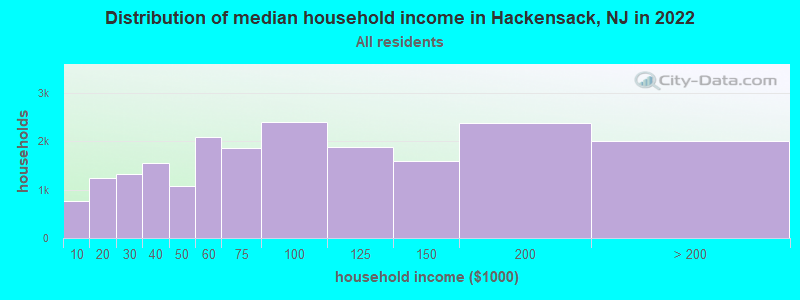
Hackensack, NJ household income distribution 766 Less than $10,0001,250 $10,000 to $19,9991,330 $20,000 to $29,9991,562 $30,000 to $39,9991,071 $40,000 to $49,9992,089 $50,000 to $59,9991,863 $60,000 to $74,9992,401 $75,000 to $99,9991,875 $100,000 to $124,9991,604 $125,000 to $149,9992,371 $150,000 to $199,9992,012 $200,000 or more
Home value of owner - occupied houses in 2022 in Hackensack, NJ 52 Less than $10,00015 $20,000 to $24,99961 $25,000 to $29,99932 $30,000 to $34,99937 $35,000 to $39,999150 $40,000 to $49,99914 $50,000 to $59,99920 $60,000 to $69,9996 $70,000 to $79,99933 $80,000 to $89,999153 $100,000 to $124,999164 $125,000 to $149,999447 $150,000 to $174,999224 $175,000 to $199,999694 $200,000 to $249,999658 $250,000 to $299,9991,256 $300,000 to $399,9991,592 $400,000 to $499,9991,122 $500,000 to $749,999179 $750,000 to $999,99940 $1,000,000 to $1,499,99911 $2,000,000 or moreRent paid by renters in 2022 in Hackensack, NJ 60 Less than $10042 $100 to $149113 $200 to $249184 $250 to $29940 $300 to $34979 $350 to $39911 $400 to $44954 $450 to $499216 $500 to $54937 $550 to $59960 $600 to $64932 $650 to $69955 $700 to $74955 $750 to $799242 $800 to $899202 $900 to $9991,400 $1,000 to $1,2491,918 $1,250 to $1,4994,604 $1,500 to $1,9992,047 $2,000 to $2,499625 $2,500 to $2,999263 $3,000 to $3,499115 $3,500 or more77 No cash rent
Percentage of workers working in this county: 67.7%Number of people working at home: 2,840 (11.1% of all workers )
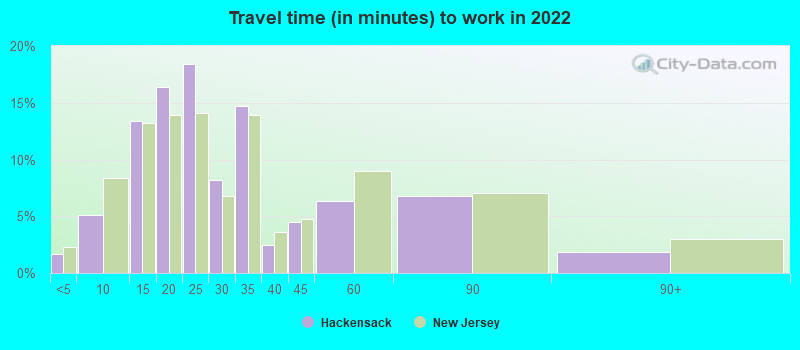
Travel time to work (commute)
Less than 5 minutes: 2765 to 9 minutes: 1,96410 to 14 minutes: 3,17315 to 19 minutes: 2,97320 to 24 minutes: 2,98125 to 29 minutes: 2,09530 to 34 minutes: 2,96535 to 39 minutes: 64840 to 44 minutes: 86045 to 59 minutes: 1,55960 to 89 minutes: 2,25790 or more minutes: 607
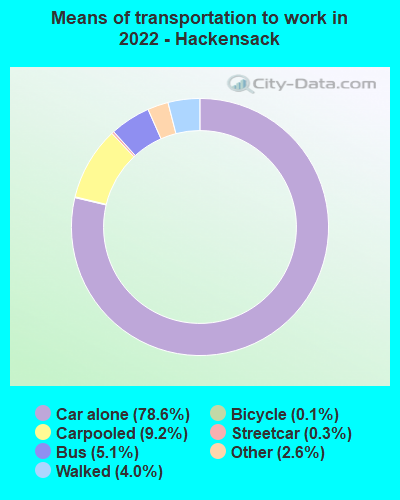
Means of transportation to work:
Drove a car alone: 27,992 (69.2%)Carpooled: 3,922 (9.7%)Bus : 1,678 (4.1%)Subway or elevated rail : 84 (0.2%)Long-distance train or commuter rail : 15 (0.0%)Taxi: 1,044 (2.6%)Bicycle: 24 (0.1%)Walked: 1,541 (3.8%)Worked at home: 2,840 (7.0%)
Unemployment by race in 2022
Unemployment rate for White non-Hispanic residents 5.2% Males4.2% FemalesUnemployment rate for Black residents 0.9% Males14.3% FemalesUnemployment rate for Asian residents 5.8% Males1.2% FemalesUnemployment rate for other race residents 3.8% Males12.6% FemalesUnemployment rate for two or more race residents 9.3% Males6.2% FemalesUnemployment rate for Hispanic or Latino residents 5.9% Males8.2% Females
Year of entry for the foreign-born population in Hackensack, New Jersey
7,343 2010 or later 4,645 2000 to 2009 4,111 1990 to 1999 3,805 1980 to 1989 1,837 1970 to 1979 1,738 Before 1970
First ancestries reported:
Italian: 1,739 (6.1%)
Jamaican: 749 (2.6%)
Irish: 677 (2.4%)
American: 672 (2.4%)
African: 611 (2.2%)
Syrian: 471 (1.7%)
German: 416 (1.5%)
Palestinian: 344 (1.2%)
Haitian: 326 (1.2%)
Greek: 288 (1.0%)
Ghanaian: 278 (1.0%)
English: 269 (1.0%)
Nigerian: 262 (0.9%)
Albanian: 239 (0.8%)
Russian: 224 (0.8%)
Jordanian: 198 (0.7%)
Polish: 187 (0.7%)
Eastern European: 173 (0.6%)
Trinidadian and Tobagonian: 159 (0.6%)
Turkish: 145 (0.5%)
Guyanese: 135 (0.5%)
Egyptian: 114 (0.4%)
Kenyan: 105 (0.4%)
European: 89 (0.3%)
Armenian: 87 (0.3%)
Lebanese: 85 (0.3%)
Romanian: 83 (0.3%)
British West Indian: 80 (0.3%)
Ethiopian: 74 (0.3%)
Cape Verdean: 62 (0.2%)
Hungarian: 58 (0.2%)
Ukrainian: 50 (0.2%)
Israeli: 49 (0.2%)
Welsh: 41 (0.1%)
Iranian: 40 (0.1%)
Bulgarian: 36 (0.1%)
Barbadian: 36 (0.1%)
Dutch: 32 (0.1%)
Norwegian: 31 (0.1%)
West Indian: 29 (0.1%)
Scottish: 26 (0.09%)
Northern European: 25 (0.09%)
Slovak: 19 (0.07%)
British: 19 (0.07%)
Finnish: 16 (0.06%)
South African: 16 (0.06%)
Zimbabwean: 16 (0.06%)
Maltese: 10 (0.04%)
Austrian: 8 (0.03%)
Lithuanian: 7 (0.02%)
Swiss: 7 (0.02%)
Soviet Union: 5 (0.02%)
Arab: 4 (0.01%)
Portuguese: 2 (0.01%)
Most common places of birth for foreign-born residents (%): Ecuador Hackensack:
22.4% (4,446)New Jersey:
4.4% (95,275)
Dominican Republic Hackensack:
13.0% (2,585)New Jersey:
9.7% (209,055)
India Hackensack:
7.8% (1,550)New Jersey:
12.8% (274,609)
Philippines Hackensack:
5.3% (1,063)New Jersey:
4.0% (85,934)
Jamaica Hackensack:
4.8% (958)New Jersey:
2.2% (47,365)
Colombia Hackensack:
4.6% (921)New Jersey:
4.2% (90,817)
Guatemala Hackensack:
2.5% (503)New Jersey:
2.2% (46,813)
Korea Hackensack:
2.3% (458)New Jersey:
3.3% (70,512)
Nepal Hackensack:
1.8% (354)New Jersey:
0.1% (2,890)
Mexico Hackensack:
1.8% (350)New Jersey:
4.8% (102,527)
Peru Hackensack:
1.7% (335)New Jersey:
2.7% (58,563)
El Salvador Hackensack:
1.7% (335)New Jersey:
2.3% (48,885)
Israel Hackensack:
1.6% (328)New Jersey:
0.5% (10,975)
Turkey Hackensack:
1.5% (300)New Jersey:
0.8% (16,778)
Place of birth for U.S.-born residents:
This state: 14,412Other state: 10,950Northeast: 8,203Midwest: 502South: 1,813West: 426 86.7% of Hackensack residents lived in the same house 1 years ago.
Out of people who lived in different houses, 35.5% lived in this county.
Out of people who lived in different counties, 40.0% lived in New Jersey.
Hackensack:
86.7%State average:
90.4%
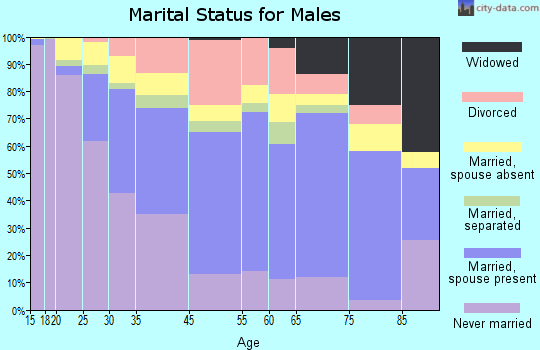
Education attainment for males 25 years and older:
No schooling: 1,467Nursery to 4th grade: 555th and 6th grade: 4527th and 8th grade: 4109th grade: 15010th grade: 6511th grade: 22312th grade, no diploma: 523High school graduate (or equivalency): 4,137Less than 1 year of college: 1,066Some college more than 1 year, no degree: 1,486Associate degree: 1,013Bachelor's degree: 4,092Master's degree: 1,886Professional school degree: 532Doctorate degree: 338
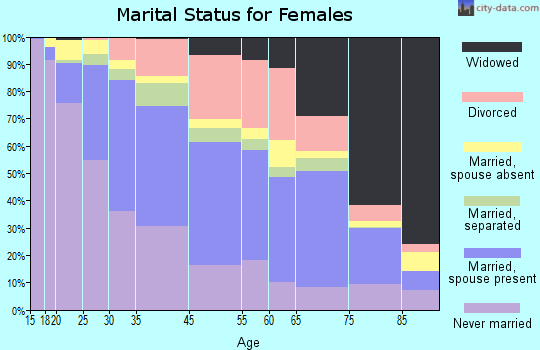
Education attainment for females 25 years and older:
No schooling: 637Nursery to 4th grade: 905th and 6th grade: 2607th and 8th grade: 1649th grade: 8110th grade: 7611th grade: 28612th grade, no diploma: 369High school graduate (or equivalency): 4,232Less than 1 year of college: 1,005Some college more than 1 year, no degree: 1,787Associate degree: 1,370Bachelor's degree: 4,788Master's degree: 2,337Professional school degree: 376Doctorate degree: 246
Housing units in structures:
One, detached: 4,632One, attached: 631Two: 2,1923 or 4: 1,1205 to 9: 99210 to 19: 1,60120 to 49: 2,83750 or more: 6,908Mobile homes: 98Housing units lacking complete plumbing facilities in 2022: 1.3%Housing units lacking complete kitchen facilities in 2022: 1.6%House/condo owner moved in on average 14 years ago
Renter moved in on average 2 years ago
Private vs. public school enrollment:
Students in private schools in grades 1 to 8 (elementary and middle school): 268 Here:
9.0%New Jersey:
12.3%
Students in private schools in grades 9 to 12 (high school): 168 Here:
11.6%New Jersey:
13.1%
Students in private undergraduate colleges: 423 Here:
28.0%New Jersey:
33.2%