Hammond, IN (Indiana) Houses and Residents
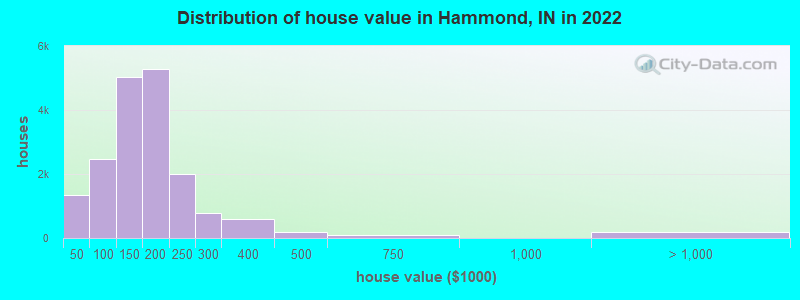
Estimated median house or condo value in 2022: $151,500 (it was $78,500 in 2000 )
Hammond:
$151,500Indiana:
$208,700
Lower value quartile - upper value quartile: $108,300 - $191,200Mean price in 2022: Detached houses: $149,394 Here:
$149,394State:
$257,916
Townhouses or other attached units: $165,543 Here:
$165,543State:
$224,114
In 2-unit structures: $186,400 Here:
$186,400State:
$175,375
In 3-to-4-unit structures: $165,416 Here:
$165,416State:
$151,116
In 5-or-more-unit structures: $132,712 Here:
$132,712State:
$200,844
Mobile homes: $23,768 Here:
$23,768State:
$67,116
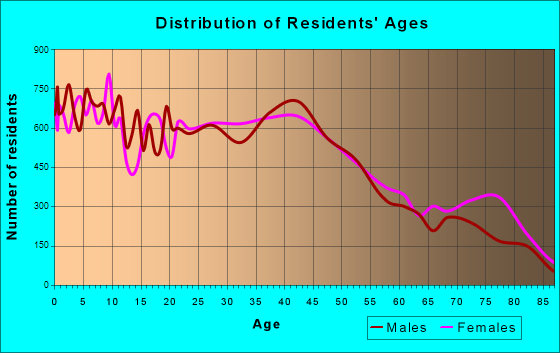
Total population: 78,384 (All urban)
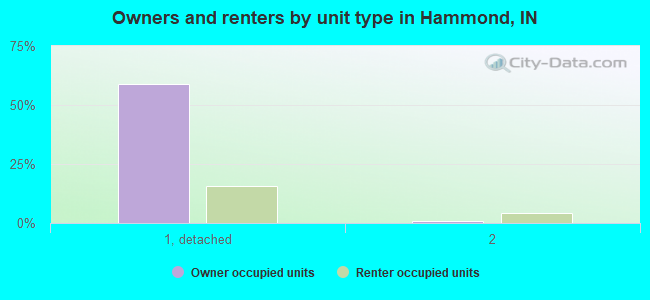
Houses: 30,876 (27,940 occupied: 17,814 owner occupied, 10,126 renter occupied )
% of renters here:
36%State:
29%
Housing density: 1,350 houses/condos per square mile
Median price asked for vacant for-sale houses and condos in 2022: $76,374.
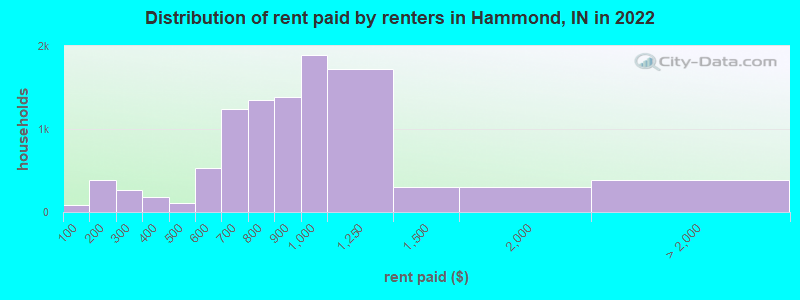
Median contract rent in 2022: $852 (lower quartile is $678, upper quartile is $994)
Median rent asked for vacant for-rent units in 2022: $934
Median gross rent in Hammond, IN in 2022: $997
Housing units in Hammond with a mortgage: 9,499 (672 second mortgage, 0 home equity loan, 638 both second mortgage and home equity loan )Houses without a mortgage: 402
Median household income for houses/condos with a mortgage: $67,858
Median household income for apartments without a mortgage: $50,455
Median monthly housing costs: $925
Data:
Median house or condo value ($)
Median house or condo value ($ change since 2000)
Median house or condo value ($) - White
Median house or condo value ($) - Black or African American
Median house or condo value ($) - Asian
Median house or condo value ($) - Hispanic or Latino
Median house or condo value ($) - American Indian and Alaska Native
Median house or condo value ($) - Multirace
Median house or condo value ($) - Other Race
Median price asked for mobile homes ($)
Household density (households per square mile)
Mean house or condo value by units in structure - 1, detached ($)
Mean house or condo value by units in structure - 1, attached ($)
Mean house or condo value by units in structure - 2 ($)
Mean house or condo value by units in structure by units in structure - 3 or 4 ($)
Mean house or condo value by units in structure - 5 or more ($)
Mean house or condo value by units in structure - Boat, RV, van, etc. ($)
Mean house or condo value by units in structure - Mobile home ($)
Median contract rent ($)
Median contract rent - Lower quartile ($)
Median contract rent - Upper quartile ($)
Median gross rent ($)
Urban houses (%)
Rural houses (%)
Houses occupied (%)
Houses occupied (% change since 2000)
Houses owner occupied (%)
Houses owner occupied (% change since 2000)
Houses renter occupied (%)
Houses renter occupied (% change since 2000)
Vacant housing units - For rent (%)
Vacant housing units - For rent (% change since 2000)
Vacant housing units - For sale only (%)
Vacant housing units - For sale only (% change since 2000)
Vacant housing units - Rented or sold, not occupied (%)
Vacant housing units - Rented or sold, not occupied (% change since 2000)
Vacant housing units - For seasonal, recreational, or occasional use (%)
Vacant housing units - For seasonal, recreational, or occasional use (% change since 2000)
Vacant housing units - For migrant workers (%)
Vacant housing units - For migrant workers (% change since 2000)
Vacant housing units - Other vacant (%)
Vacant housing units - Other vacant (% change since 2000)
Median monthly housing costs ($)
Median household income for houses/condos with a mortgage ($)
Median household income for houses/condos without a mortgage ($)
Median household income ($)
Median household income ($) - White
Median household income ($) - Black or African American
Median household income ($) - Asian
Median household income ($) - Hispanic or Latino
Median household income ($) - American Indian and Alaska Native
Median household income ($) - Multirace
Median household income ($) - Other Race
Mortgage status - with mortgage (%)
Mortgage status - with second mortgage (%)
Mortgage status - with home equity loan (%)
Mortgage status - with both second mortgage and home equity loan (%)
Mortgage status - without a mortgage (%)
Median year house/condo built
Median year apartment built
Household type by relationship - Male householder living alone (%)
Household type by relationship - Male householder not living alone (%)
Household type by relationship - Female householder living alone (%)
Household type by relationship - Female householder not living alone (%)
Household type by relationship - Opposite-Sex spouse (%)
Household type by relationship - Same-Sex spouse (%)
Household type by relationship - Opposite-Sex unmarried partner (%)
Household type by relationship - Same-Sex unmarried partner (%)
Household type by relationship - In group quarters (%)
Size of family households - 2-person household (%)
Size of family households - 3-person household (%)
Size of family households - 4-person household (%)
Size of family households - 5-person household (%)
Size of family households - 6-person household (%)
Size of family households - 7-or-more-person household (%)
Size of nonfamily households - 1-person household (%)
Size of nonfamily households - 2-person household (%)
Size of nonfamily households - 3-person household (%)
Size of nonfamily households - 4-person household (%)
Size of nonfamily households - 5-person household (%)
Size of nonfamily households - 6-person household (%)
Size of nonfamily households - 7-or-moreperson household (%)
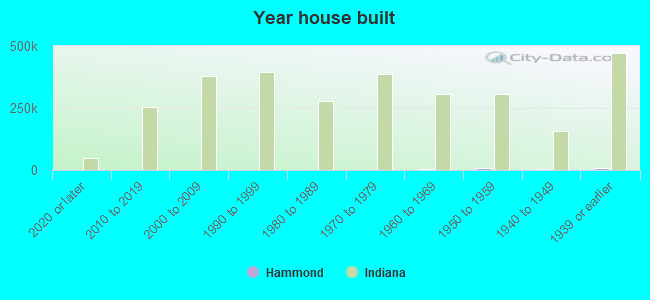
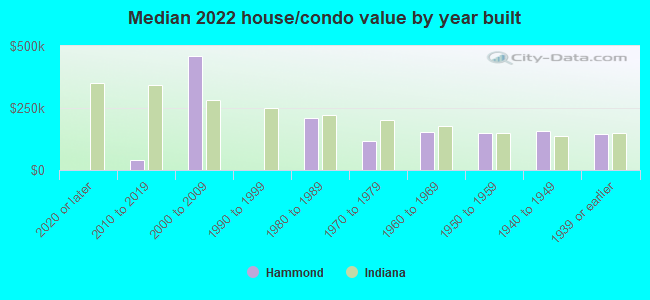
Year house built - Built 2010 or later (%)
Year house built - Built 2000 to 2009 (%)
Year house built - Built 1990 to 1999 (%)
Year house built - Built 1980 to 1989 (%)
Year house built - Built 1970 to 1979 (%)
Year house built - Built 1960 to 1969 (%)
Year house built - Built 1950 to 1959 (%)
Year house built - Built 1940 to 1949 (%)
Year house built - Built 1939 or earlier (%)
Median number of rooms in houses and condos
Median number of rooms in apartments
Median number of bedrooms in owner occupied houses
Mean number of bedrooms in owner occupied houses
Median number of bedrooms in renter occupied houses
Mean number of bedrooms in renter occupied houses
Median number of vehichles in owner occupied houses
Mean number of vehichles in owner occupied houses
Median number of vehichles in renter occupied houses
Mean number of vehichles in renter occupied houses
Rooms in owner-occupied houses - 1 room (%)
Rooms in owner-occupied houses - 2 rooms (%)
Rooms in owner-occupied houses - 3 rooms (%)
Rooms in owner-occupied houses - 4 rooms (%)
Rooms in owner-occupied houses - 5 rooms (%)
Rooms in owner-occupied houses - 6 rooms (%)
Rooms in owner-occupied houses - 7 rooms (%)
Rooms in owner-occupied houses - 8 rooms (%)
Rooms in owner-occupied houses - 9+ rooms (%)
Rooms in renter-occupied houses - 1 room (%)
Rooms in renter-occupied houses - 2 rooms (%)
Rooms in renter-occupied houses - 3 rooms (%)
Rooms in renter-occupied houses - 4 rooms (%)
Rooms in renter-occupied houses - 5 rooms (%)
Rooms in renter-occupied houses - 6 rooms (%)
Rooms in renter-occupied houses - 7 rooms (%)
Rooms in renter-occupied houses - 8 rooms (%)
Rooms in renter-occupied houses - 9+ rooms (%)
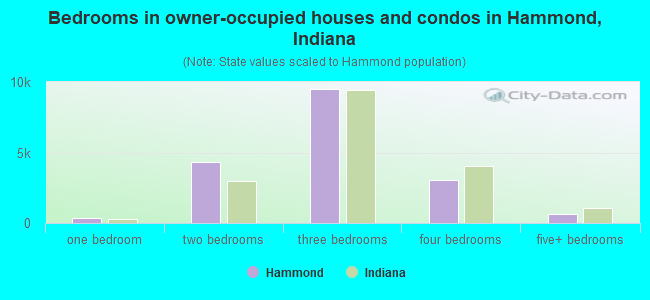
Bedrooms in owner-occupied houses - no bedrooms (%)
Bedrooms in owner-occupied houses - 1 bedroom (%)
Bedrooms in owner-occupied houses - 2 bedrooms (%)
Bedrooms in owner-occupied houses - 3 bedrooms (%)
Bedrooms in owner-occupied houses - 4 bedrooms (%)
Bedrooms in owner-occupied houses - 5+ bedrooms (%)
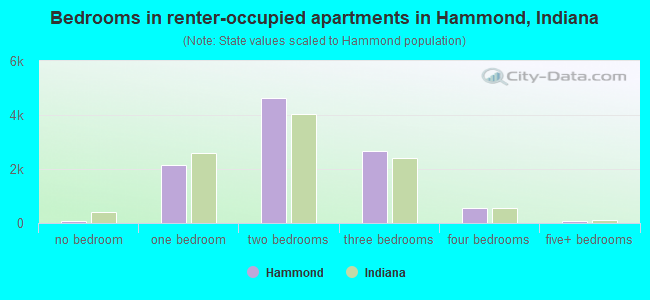
Bedrooms in renter-occupied houses - no bedrooms (%)
Bedrooms in renter-occupied houses - 1 bedroom (%)
Bedrooms in renter-occupied houses - 2 bedrooms (%)
Bedrooms in renter-occupied houses - 3 bedrooms (%)
Bedrooms in renter-occupied houses - 4 bedrooms (%)
Bedrooms in renter-occupied houses - 5+ bedrooms (%)
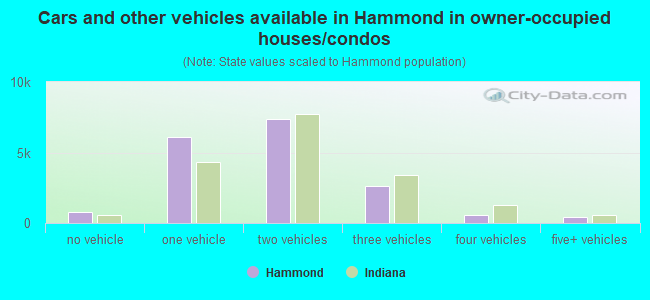
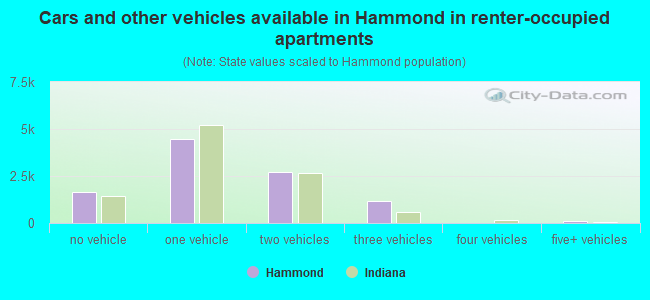
Vehicles available in owner-occupied houses - no vehicle available (%)
Vehicles available in owner-occupied houses - 1 vehicle available(%)
Vehicles available in owner-occupied houses - 2 Vehicles available (%)
Vehicles available in owner-occupied houses - 3 Vehicles available (%)
Vehicles available in owner-occupied houses - 4 Vehicles available (%)
Vehicles available in owner-occupied houses - 5+ Vehicles available (%)
Vehicles available in renter-occupied houses - no vehicle available (%)
Vehicles available in renter-occupied houses - 1 vehicle available (%)
Vehicles available in renter-occupied houses - 2 Vehicles available (%)
Vehicles available in renter-occupied houses - 3 Vehicles available (%)
Vehicles available in renter-occupied houses - 4 Vehicles available (%)
Vehicles available in renter-occupied houses - 5+ Vehicles available (%)
Housing units in structures - 1, detached (%)
Housing units in structures - 1, attached (%)
Housing units in structures - 2 (%)
Housing units in structures - 3 or 4 (%)
Housing units in structures - 5 to 9 (%)
Housing units in structures - 10 to 19 (%)
Housing units in structures - 20 to 49 (%)
Housing units in structures - 50 or more (%)
Housing units in structures - Mobile home (%)
Housing units in structures - Boat, RV, van, etc. (%)
Housing units in structures - Owners - 1, detached (%)
Housing units in structures - Owners - 1, attached (%)
Housing units in structures - Owners - 2 (%)
Housing units in structures - Owners - 3 or 4 (%)
Housing units in structures - Owners - 5 to 9 (%)
Housing units in structures - Owners - 10 to 19 (%)
Housing units in structures - Owners - 20 to 49 (%)
Housing units in structures - Owners - 50 or more (%)
Housing units in structures - Owners - Mobile home (%)
Housing units in structures - Owners - Boat, RV, van, etc. (%)
Housing units in structures - Renters - 1, detached (%)
Housing units in structures - Renters - 1, attached (%)
Housing units in structures - Renters - 2 (%)
Housing units in structures - Renters - 3 or 4 (%)
Housing units in structures - Renters - 5 to 9 (%)
Housing units in structures - Renters - 10 to 19 (%)
Housing units in structures - Renters - 20 to 49 (%)
Housing units in structures - Renters - 50 or more (%)
Housing units in structures - Renters - Mobile home (%)
Housing units in structures - Renters - Boat, RV, van, etc. (%)
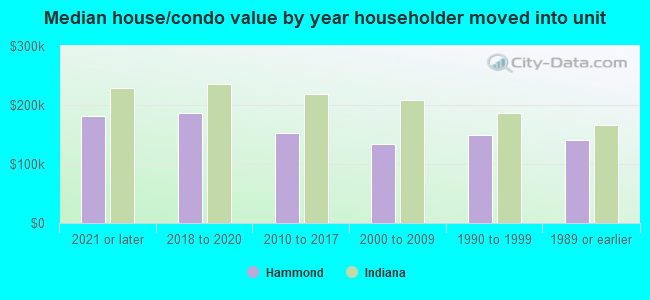
House/condo owner moved in on average (years ago)
Renter moved in on average (years ago)
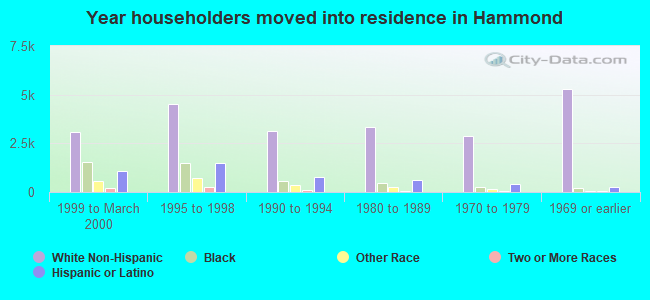
Year householder moved into unit - Moved in 1999 to March 2000 (%)
Year householder moved into unit - Moved in 1999 to March 2000 (%) - White
Year householder moved into unit - Moved in 1999 to March 2000 (%) - Black or African American
Year householder moved into unit - Moved in 1999 to March 2000 (%) - Asian
Year householder moved into unit - Moved in 1999 to March 2000 (%) - Hispanic or Latino
Year householder moved into unit - Moved in 1999 to March 2000 (%) - American Indian and Alaska Native
Year householder moved into unit - Moved in 1999 to March 2000 (%) - Multirace
Year householder moved into unit - Moved in 1999 to March 2000 (%) - Other Race
Year householder moved into unit - Moved in 1995 to 1998 (%)
Year householder moved into unit - Moved in 1995 to 1998 (%) - White
Year householder moved into unit - Moved in 1995 to 1998 (%) - Black or African American
Year householder moved into unit - Moved in 1995 to 1998 (%) - Asian
Year householder moved into unit - Moved in 1995 to 1998 (%) - Hispanic or Latino
Year householder moved into unit - Moved in 1995 to 1998 (%) - American Indian and Alaska Native
Year householder moved into unit - Moved in 1995 to 1998 (%) - Multirace
Year householder moved into unit - Moved in 1995 to 1998 (%) - Other Race
Year householder moved into unit - Moved in 1990 to 1994 (%)
Year householder moved into unit - Moved in 1990 to 1994 (%) - White
Year householder moved into unit - Moved in 1990 to 1994 (%) - Black or African American
Year householder moved into unit - Moved in 1990 to 1994 (%) - Asian
Year householder moved into unit - Moved in 1990 to 1994 (%) - Hispanic or Latino
Year householder moved into unit - Moved in 1990 to 1994 (%) - American Indian and Alaska Native
Year householder moved into unit - Moved in 1990 to 1994 (%) - Multirace
Year householder moved into unit - Moved in 1990 to 1994 (%) - Other Race
Year householder moved into unit - Moved in 1980 to 1989 (%)
Year householder moved into unit - Moved in 1980 to 1989 (%) - White
Year householder moved into unit - Moved in 1980 to 1989 (%) - Black or African American
Year householder moved into unit - Moved in 1980 to 1989 (%) - Asian
Year householder moved into unit - Moved in 1980 to 1989 (%) - Hispanic or Latino
Year householder moved into unit - Moved in 1980 to 1989 (%) - American Indian and Alaska Native
Year householder moved into unit - Moved in 1980 to 1989 (%) - Multirace
Year householder moved into unit - Moved in 1980 to 1989 (%) - Other Race
Year householder moved into unit - Moved in 1970 to 1979 (%)
Year householder moved into unit - Moved in 1970 to 1979 (%) - White
Year householder moved into unit - Moved in 1970 to 1979 (%) - Black or African American
Year householder moved into unit - Moved in 1970 to 1979 (%) - Asian
Year householder moved into unit - Moved in 1970 to 1979 (%) - Hispanic or Latino
Year householder moved into unit - Moved in 1970 to 1979 (%) - American Indian and Alaska Native
Year householder moved into unit - Moved in 1970 to 1979 (%) - Multirace
Year householder moved into unit - Moved in 1970 to 1979 (%) - Other Race
Year householder moved into unit - Moved in 1969 or earlier (%)
Year householder moved into unit - Moved in 1969 or earlier (%) - White
Year householder moved into unit - Moved in 1969 or earlier (%) - Black or African American
Year householder moved into unit - Moved in 1969 or earlier (%) - Asian
Year householder moved into unit - Moved in 1969 or earlier (%) - Hispanic or Latino
Year householder moved into unit - Moved in 1969 or earlier (%) - American Indian and Alaska Native
Year householder moved into unit - Moved in 1969 or earlier (%) - Multirace
Year householder moved into unit - Moved in 1969 or earlier (%) - Other Race
Housing units lacking complete plumbing facilities (%)
Housing units lacking complete kitchen facilities (%)
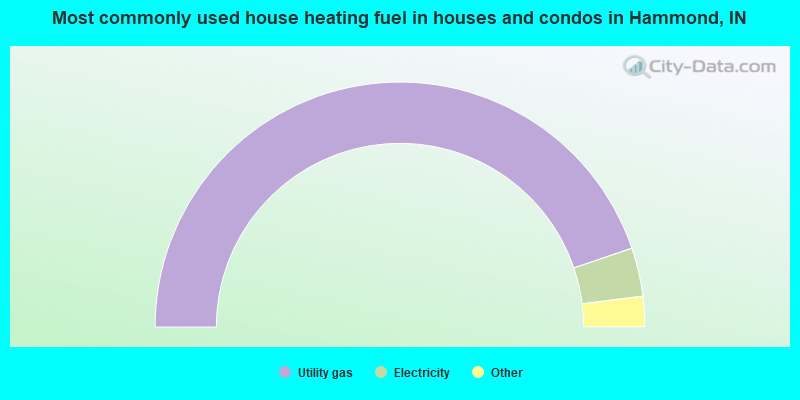
House heating fuel used in houses and condos - Utility gas (%)
House heating fuel used in houses and condos - Bottled, tank, or LP gas (%)
House heating fuel used in houses and condos - Electricity (%)
House heating fuel used in houses and condos - Fuel oil, kerosene, etc. (%)
House heating fuel used in houses and condos - Coal or coke (%)
House heating fuel used in houses and condos - Wood (%)
House heating fuel used in houses and condos - Solar energy (%)
House heating fuel used in houses and condos - Other fuel (%)
House heating fuel used in houses and condos - No fuel used (%)
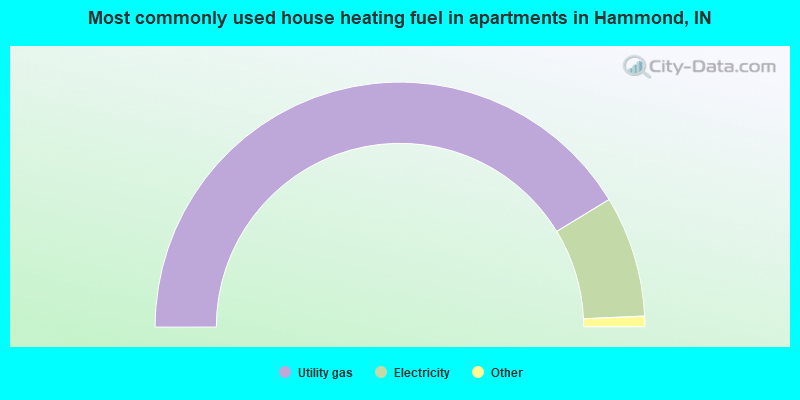
House heating fuel used in apartments - Utility gas (%)
House heating fuel used in apartments - Bottled, tank, or LP gas (%)
House heating fuel used in apartments - Electricity (%)
House heating fuel used in apartments - Fuel oil, kerosene, etc. (%)
House heating fuel used in apartments - Coal or coke (%)
House heating fuel used in apartments - Wood (%)
House heating fuel used in apartments - Solar energy (%)
House heating fuel used in apartments - Other fuel (%)
House heating fuel used in apartments - No fuel used (%)
Latest news about housing in Hammond, IN collected exclusively by city-data.com from local newspapers, TV, and radio stations
Median year house/condo built: 1949Median year apartment built: 1958Household type by relationship:
Households: 76,562
Male householders: 12,871 (3,237 living alone ), Female householders: 15,069 (4,539 living alone )10,534 spouses (10,388 opposite-sex spouses ), 2,592 unmarried partners , (2,592 opposite-sex unmarried partners ), 25,698 children (24,893 natural , 226 adopted , 579 stepchildren ), 2,116 grandchildren , 959 brothers or sisters , 1,474 parents , 0 foster children , 2,453 other relatives , 2,256 non-relatives In group quarters: 540
Size of family households: 6,704 2-persons , 4,683 3-persons , 3,143 4-persons , 2,123 5-persons , 789 6-persons , 667 7-or-more-persons .
Size of nonfamily households: 7,776 1-person , 1,757 2-persons , 240 3-persons , 58 4-persons .
7,915 married couples with children. single-parent households (1,373 men , 5,188 women ).
73.1% of residents of Hammond speak English at home. of residents speak Spanish at home (66% speak English very well , 18% speak English well , 13% speak English not well , 4% don't speak English at all ).of residents speak other Indo-European language at home (50% speak English very well , 37% speak English well , 13% speak English not well ).of residents speak Asian or Pacific Island language at home (51% speak English very well , 39% speak English well , 10% speak English not well ).of residents speak other language at home (85% speak English very well , 8% speak English well , 4% speak English not well , 3% don't speak English at all ).
Foreign born population: 9,763 (12.8%)of them are naturalized citizens )
Median number of rooms in houses and condos:
Median number of rooms in apartments
Owner-occupied Renter-occupied
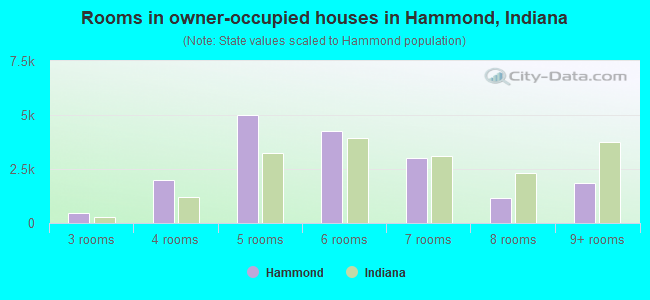
Rooms in owner-occupied houses in Hammond, Indiana
0 1 room 39 2 rooms 486 3 rooms 2,007 4 rooms 5,019 5 rooms 4,265 6 rooms 3,012 7 rooms 1,157 8 rooms 1,829 9+ rooms
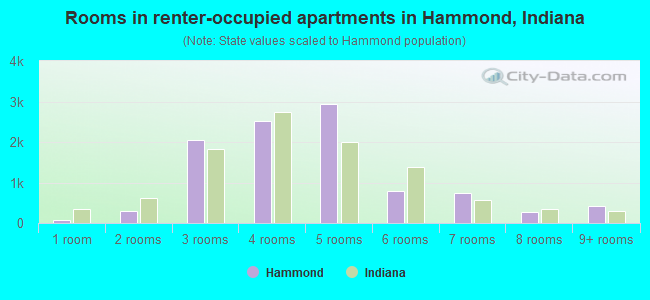
Rooms in renter-occupied apartments in Hammond, Indiana
76 1 room 300 2 rooms 2,047 3 rooms 2,527 4 rooms 2,926 5 rooms 795 6 rooms 749 7 rooms 280 8 rooms 426 9+ rooms
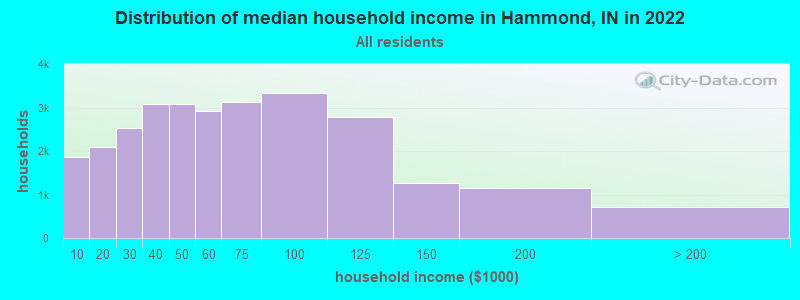
Hammond, IN household income distribution 1,854 Less than $10,0002,087 $10,000 to $19,9992,539 $20,000 to $29,9993,072 $30,000 to $39,9993,074 $40,000 to $49,9992,929 $50,000 to $59,9993,132 $60,000 to $74,9993,340 $75,000 to $99,9992,792 $100,000 to $124,9991,255 $125,000 to $149,9991,157 $150,000 to $199,999709 $200,000 or more
Home value of owner - occupied houses in 2022 in Hammond, IN 113 Less than $10,000258 $10,000 to $14,999609 $15,000 to $19,99950 $25,000 to $29,99963 $30,000 to $34,999112 $35,000 to $39,999143 $40,000 to $49,999294 $50,000 to $59,999326 $60,000 to $69,999171 $70,000 to $79,999837 $80,000 to $89,999698 $90,000 to $99,9992,349 $100,000 to $124,9992,667 $125,000 to $149,9993,558 $150,000 to $174,9991,719 $175,000 to $199,9992,006 $200,000 to $249,999787 $250,000 to $299,999608 $300,000 to $399,999174 $400,000 to $499,99991 $500,000 to $749,999181 $1,000,000 to $1,499,999Rent paid by renters in 2022 in Hammond, IN 83 Less than $100172 $100 to $149211 $150 to $199270 $200 to $24976 $300 to $349109 $350 to $39953 $400 to $44957 $450 to $499286 $500 to $549240 $550 to $599402 $600 to $649838 $650 to $699849 $700 to $749495 $750 to $7991,388 $800 to $8991,887 $900 to $9991,723 $1,000 to $1,249296 $1,250 to $1,499303 $1,500 to $1,999388 No cash rent
Percentage of workers working in this county: 70.6%Number of people working at home: 2,864 (8.3% of all workers )
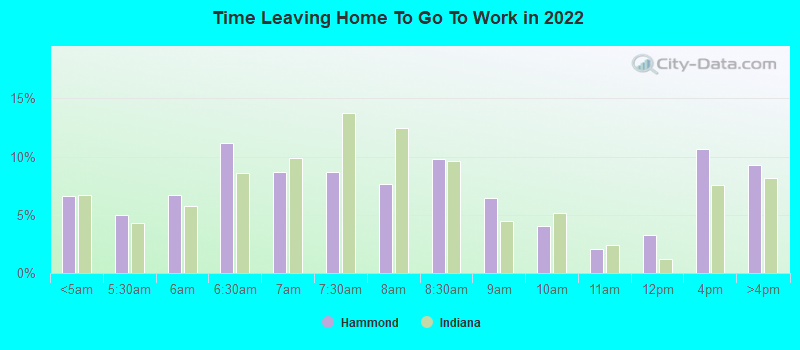
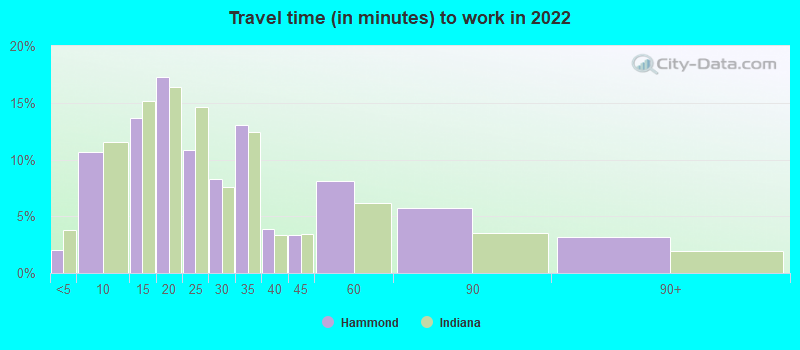
Travel time to work (commute)
Less than 5 minutes: 6935 to 9 minutes: 2,36810 to 14 minutes: 4,12615 to 19 minutes: 5,57120 to 24 minutes: 3,99125 to 29 minutes: 4,44830 to 34 minutes: 3,11135 to 39 minutes: 30340 to 44 minutes: 1,43145 to 59 minutes: 2,67560 to 89 minutes: 2,52390 or more minutes: 312
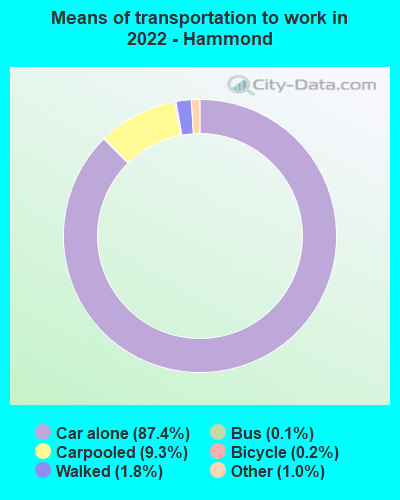
Means of transportation to work:
Drove a car alone: 23,521 (77.5%)Carpooled: 2,968 (9.8%)Bus : 40 (0.1%)Long-distance train or commuter rail : 19 (0.1%)Taxi: 277 (0.9%)Bicycle: 125 (0.4%)Walked: 521 (1.7%)Worked at home: 2,864 (9.4%)
Unemployment by race in 2022
Unemployment rate for White non-Hispanic residents 6.4% MalesUnemployment rate for Black residents 11.0% Males7.6% FemalesUnemployment rate for American Indian and Alaska Native residents 4.0% Males17.5% FemalesUnemployment rate for Asian residents 14.9% FemalesUnemployment rate for other race residents 4.5% Males2.1% FemalesUnemployment rate for two or more race residents 6.7% Males5.0% FemalesUnemployment rate for Hispanic or Latino residents 4.5% Males4.6% Females
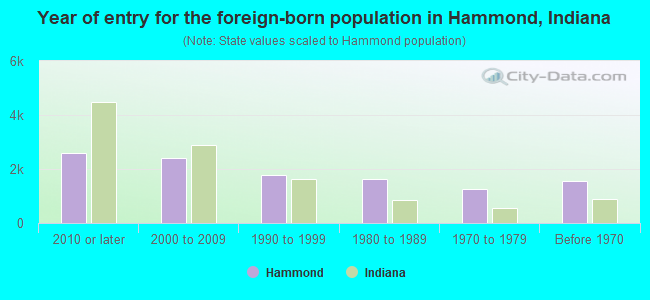
Year of entry for the foreign-born population in Hammond, Indiana
2,607 2010 or later 2,423 2000 to 2009 1,770 1990 to 1999 1,637 1980 to 1989 1,265 1970 to 1979 1,570 Before 1970
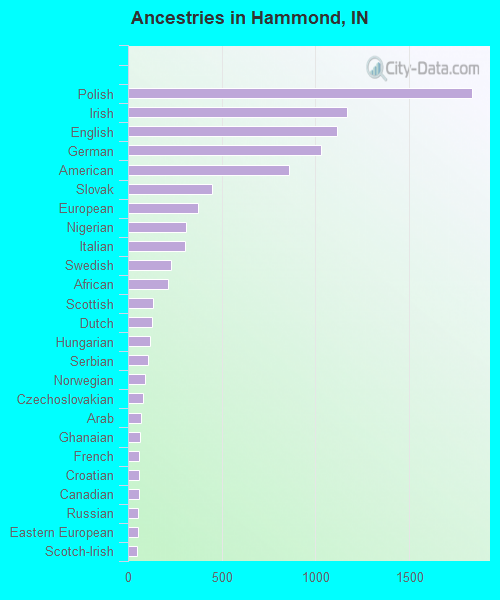
First ancestries reported:
Polish: 1,835 (4.6%)
Irish: 1,169 (2.9%)
English: 1,117 (2.8%)
German: 1,030 (2.6%)
American: 858 (2.1%)
Slovak: 449 (1.1%)
European: 375 (0.9%)
Nigerian: 309 (0.8%)
Italian: 304 (0.8%)
Swedish: 227 (0.6%)
African: 214 (0.5%)
Scottish: 132 (0.3%)
Dutch: 130 (0.3%)
Hungarian: 118 (0.3%)
Serbian: 106 (0.3%)
Norwegian: 89 (0.2%)
Czechoslovakian: 80 (0.2%)
Arab: 72 (0.2%)
Ghanaian: 65 (0.2%)
French: 60 (0.1%)
Croatian: 59 (0.1%)
Canadian: 58 (0.1%)
Russian: 56 (0.1%)
Eastern European: 53 (0.1%)
Scotch-Irish: 50 (0.1%)
Ukrainian: 36 (0.09%)
Romanian: 32 (0.08%)
Jamaican: 28 (0.07%)
Lithuanian: 26 (0.06%)
Palestinian: 25 (0.06%)
Greek: 25 (0.06%)
Brazilian: 16 (0.04%)
Swiss: 16 (0.04%)
Jordanian: 15 (0.04%)
British: 10 (0.02%)
Danish: 10 (0.02%)
French Canadian: 9 (0.02%)
Austrian: 7 (0.02%)
Pennsylvania German: 4 (0.01%) Most common places of birth for foreign-born residents (%): Mexico Hammond:
74.5% (7,024)Indiana:
27.0% (101,996)
Nigeria Hammond:
3.4% (316)Indiana:
3.3% (12,337)
Philippines Hammond:
2.5% (235)Indiana:
3.1% (11,851)
Poland Hammond:
1.8% (174)Indiana:
0.8% (2,959)
Guatemala Hammond:
1.6% (149)Indiana:
2.3% (8,656)
Place of birth for U.S.-born residents:
This state: 32,358Other state: 33,510Northeast: 460Midwest: 28,171South: 3,926West: 953 91.3% of Hammond residents lived in the same house 1 years ago.
Out of people who lived in different houses, 31.7% lived in this county.
Out of people who lived in different counties, 48.0% lived in Indiana.
Hammond:
91.3%State average:
87.1%
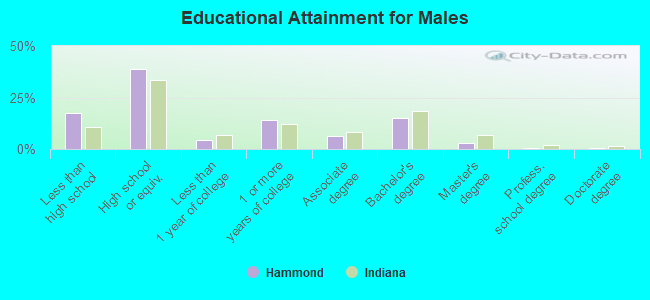
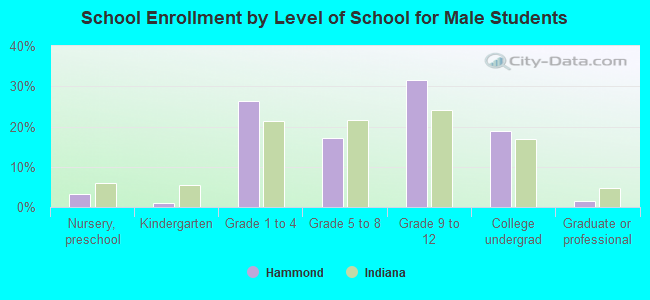
Education attainment for males 25 years and older:
No schooling: 835Nursery to 4th grade: 1175th and 6th grade: 6727th and 8th grade: 3399th grade: 60010th grade: 44511th grade: 33512th grade, no diploma: 696High school graduate (or equivalency): 9,024Less than 1 year of college: 960Some college more than 1 year, no degree: 3,293Associate degree: 1,423Bachelor's degree: 3,528Master's degree: 694Professional school degree: 128Doctorate degree: 61
Education attainment for females 25 years and older:
No schooling: 449Nursery to 4th grade: 1115th and 6th grade: 4847th and 8th grade: 1989th grade: 29410th grade: 56511th grade: 57012th grade, no diploma: 607High school graduate (or equivalency): 10,396Less than 1 year of college: 1,096Some college more than 1 year, no degree: 4,189Associate degree: 2,223Bachelor's degree: 4,339Master's degree: 909Professional school degree: 55Doctorate degree: 0
Housing units in structures:
One, detached: 22,727One, attached: 1,258Two: 1,3883 or 4: 1,1425 to 9: 1,59110 to 19: 36520 to 49: 94950 or more: 1,086Mobile homes: 370Housing units lacking complete plumbing facilities in 2022: 0.8%Housing units lacking complete kitchen facilities in 2022: 4.8%House/condo owner moved in on average 17 years ago
Renter moved in on average 3 years ago
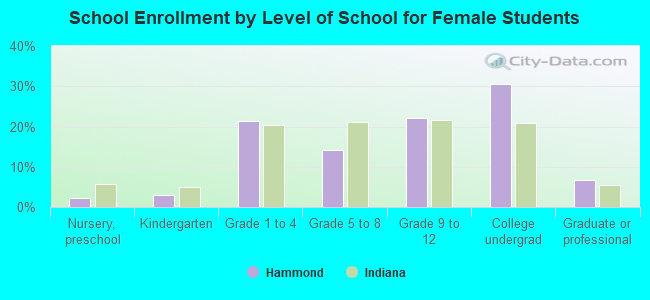
Private vs. public school enrollment:
Students in private schools in grades 1 to 8 (elementary and middle school): 1,129 Students in private schools in grades 9 to 12 (high school): 563 Students in private undergraduate colleges: 1,453