Hampton, MD (Maryland) Houses and Residents
| Hampton: | $605,327 |
| Maryland: | $398,100 |
Mean price in 2022:
Detached houses: $649,389
Here: $649,389 State: $526,819 Townhouses or other attached units: $314,773
Here: $314,773 State: $328,305
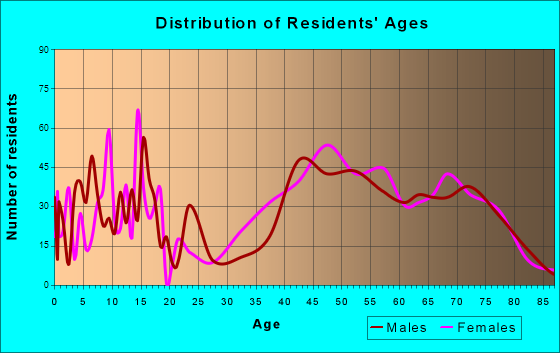
Total population: 5,052 (All urban)
Houses: 1,898 (1,768 occupied: 1,801 owner occupied, 6 renter occupied)
| % of renters here: | 0% |
| State: | 32% |
Housing density: 332 houses/condos per square mile
Median price asked for vacant for-sale houses and condos in 2022: $321,212.
Median gross rent in Hampton, MD in 2022: $-656,750,055
Housing units in Hampton with a mortgage: 1,157 (140 second mortgage, 0 home equity loan, 130 both second mortgage and home equity loan)
Houses without a mortgage: 42
Median household income for houses/condos with a mortgage: $212,076
Median household income for apartments without a mortgage: $110,206
Median monthly housing costs: $2,224
Compare current foreclosures near Hampton, MD:
| Photo | Address | Area | Beds / Baths | Price | Details |
|---|---|---|---|---|---|

|
#1
W Mosher St
Baltimore, MD 21216
|
1,574 sq. feet
|
1 baths 3 beds |
$28,500
|
show details |

|
#2
S Bouldin St
Baltimore, MD 21224
|
1,160 sq. feet
|
2 baths 2 beds |
$259,900
|
show details |

|
#3
Corkley Rd
Rosedale, MD 21237
|
1,292 sq. feet
|
2 baths 3 beds |
$364,900
|
show details |

|
#4
N Curley St
Baltimore, MD 21224
|
1,008 sq. feet
|
1 baths 3 beds |
$51,000
|
show details |

|
#5
Brooks Ln Apt 1a
Baltimore, MD 21217
|
983 sq. feet
|
2 baths 2 beds |
$134,900
|
show details |

|
#6
Wicklow Rd
Baltimore, MD 21229
|
1,152 sq. feet
|
1 baths 3 beds |
$112,000
|
show details |

|
#7
Harlem Ln
Catonsville, MD 21228
|
3,208 sq. feet
|
2 baths 4 beds |
$424,900
|
show details |

|
#8
Mondawmin Ave
Baltimore, MD 21216
|
1,512 sq. feet
|
3 baths 3 beds |
$199,500
|
show details |

|
#9
E 33rd St
Baltimore, MD 21218
|
1,500 sq. feet
|
1 baths 3 beds |
$140,000
|
show details |

|
#10
Winston Ave
Baltimore, MD 21239
|
1,254 sq. feet
|
1 baths 3 beds |
$259,900
|
show details |
| Photo | Address | Area | Beds / Baths | Price | Details |
|---|---|---|---|---|---|

|
#11
Francis St
Baltimore, MD 21217
|
2,038 sq. feet
|
2 baths 4 beds |
$45,500
|
show details |

|
#12
N Decker Ave
Baltimore, MD 21213
|
950 sq. feet
|
1 baths 2 beds |
$145,000
|
show details |

|
#13
N Belnord Ave
Baltimore, MD 21205
|
1,040 sq. feet
|
1 baths 3 beds |
$112,900
|
show details |

|
#14
N Chapel Gate Ln
Baltimore, MD 21229
|
1,890 sq. feet
|
2 baths 3 beds |
$136,000
|
show details |

|
#15
Harford Square Dr
Edgewood, MD 21040
|
1,408 sq. feet
|
2 baths 3 beds |
$172,000
|
show details |

|
#16
Rossville Blvd
Rosedale, MD 21237
|
2,561 sq. feet
|
2 baths 4 beds |
$599,900
|
show details |

|
#17
Renaissance Dr
Essex, MD 21221
|
2,244 sq. feet
|
2 baths 3 beds |
$428,900
|
show details |

|
#18
Southridge Dr
Edgewood, MD 21040
|
1,244 sq. feet
|
2 baths 3 beds |
$344,900
|
show details |

|
#19
Gwynnmore Ave
Gwynn Oak, MD 21207
|
1,955 sq. feet
|
1 baths 3 beds |
$170,000
|
show details |

|
#20
Willow Branch Way Unit 303
Owings Mills, MD 21117
|
1,200 sq. feet
|
2 baths 2 beds |
$259,000
|
show details |
| Photo | Address | Area | Beds / Baths | Price | Details |
|---|---|---|---|---|---|

|
#21
Annapolis Rd
Halethorpe, MD 21227
|
1,581 sq. feet
|
2 baths 4 beds |
$334,900
|
show details |

|
#22
Elm Ave
Glen Burnie, MD 21061
|
1,092 sq. feet
|
2 baths 3 beds |
$399,900
|
show details |

|
#23
E Strathmore Ave
Baltimore, MD 21214
|
1,268 sq. feet
|
2 baths 4 beds |
$314,900
|
show details |

|
#24
Wilgate Rd
Owings Mills, MD 21117
|
1,056 sq. feet
|
1 baths 3 beds |
$321,000
|
show details |

|
#25
W Spring Meadow Ct
Edgewood, MD 21040
|
1,110 sq. feet
|
1 baths 2 beds |
$249,900
|
show details |

|
#26
Chestnut Ave
Baltimore, MD 21211
|
1,308 sq. feet
|
1 baths 3 beds |
$239,900
|
show details |

|
#27
Light St
Baltimore, MD 21230
|
1,554 sq. feet
|
1 baths 2 beds |
$254,900
|
show details |

|
#28
Beech Ave
Baltimore, MD 21211
|
1,200 sq. feet
|
1 baths 3 beds |
$179,000
|
show details |

|
#29
Southern Ave
Baltimore, MD 21206
|
1,132 sq. feet
|
1 baths 3 beds |
$148,500
|
show details |

|
#30
Ardmore Ave
Parkville, MD 21234
|
2,463 sq. feet
|
2 baths 4 beds |
$360,000
|
show details |
| Photo | Address | Area | Beds / Baths | Price | Details |
|---|---|---|---|---|---|

|
#31
Gorsuch Ave
Baltimore, MD 21218
|
1,380 sq. feet
|
1 baths 3 beds |
$90,000
|
show details |

|
#32
S Washington St
Baltimore, MD 21231
|
1,638 sq. feet
|
2 baths 4 beds |
$349,500
|
show details |

|
#33
E 28th St
Baltimore, MD 21218
|
1,244 sq. feet
|
1 baths 2 beds |
$298,900
|
show details |

|
#34
Cuthbert Ave
Baltimore, MD 21215
|
- sq. feet
|
1 baths 1 beds |
$12,000
|
show details |

|
#35
W Saratoga St
Baltimore, MD 21223
|
- sq. feet
|
1 baths 3 beds |
$29,900
|
show details |

|
#36
N Robinson St
Baltimore, MD 21205
|
- sq. feet
|
2 baths 2 beds |
$69,900
|
show details |

|
#37
Homestead St
Baltimore, MD 21218
|
- sq. feet
|
2 baths 3 beds |
$114,400
|
show details |

|
#38
5th St
Brooklyn, MD 21225
|
1,232 sq. feet
|
1 baths - beds |
$49,900
|
show details |

|
#39
Middlesex Rd
Essex, MD 21221
|
1,152 sq. feet
|
2 baths 3 beds |
show details | |

|
#40
Water Fountain Ct Unit 302
Glen Burnie, MD 21060
|
1,100 sq. feet
|
2 baths 3 beds |
show details |
| Photo | Address | Area | Beds / Baths | Price | Details |
|---|---|---|---|---|---|

|
#41
Cedar Dr
Gwynn Oak, MD 21207
|
1,834 sq. feet
|
2 baths 4 beds |
show details | |

|
#42
E Belvedere Ave
Baltimore, MD 21239
|
1,320 sq. feet
|
1 baths 4 beds |
show details | |

|
#43
Patuxent Ave
Rosedale, MD 21237
|
1,904 sq. feet
|
3 baths 4 beds |
show details | |

|
#44
E Federal St
Baltimore, MD 21213
|
- sq. feet
|
3 baths 2 beds |
show details | |

|
#45
Westfield Ave
Baltimore, MD 21214
|
1,326 sq. feet
|
2 baths 3 beds |
show details | |

|
#46
Penhurst Ave
Baltimore, MD 21215
|
2,743 sq. feet
|
3 baths 6 beds |
show details | |

|
#47
Olen Dr
Glen Burnie, MD 21061
|
1,170 sq. feet
|
2 baths 3 beds |
show details | |

|
#48
Benton Heights Ave
Baltimore, MD 21206
|
1,326 sq. feet
|
2 baths 3 beds |
show details | |

|
#49
E 29th St
Baltimore, MD 21218
|
1,200 sq. feet
|
1 baths 3 beds |
show details | |

|
Check over 1 million property listings on Foreclosure.com!
|
browse all offers | |||

Latest news about housing in Hampton, MD collected exclusively by city-data.com from local newspapers, TV, and radio stations


Household type by relationship:
Households: 5,052- Male householders: 803 (90 living alone), Female householders: 946 (85 living alone)
1,302 spouses (1,289 opposite-sex spouses), 138 unmarried partners, (138 opposite-sex unmarried partners), 1,602 children (1,440 natural, 29 adopted, 132 stepchildren), 65 grandchildren, 54 brothers or sisters, 28 parents, 0 foster children, 14 other relatives, 64 non-relatives
- In group quarters: 29
Size of family households: 624 2-persons, 298 3-persons, 538 4-persons, 61 5-persons, 14 6-persons.
Size of nonfamily households: 183 1-person, 91 2-persons.
1,031 married couples with children.
212 single-parent households (5 men, 207 women).
91.5% of residents of Hampton speak English at home.
2.1% of residents speak Spanish at home (77% speak English very well, 17% speak English well, 6% speak English not well).
3.3% of residents speak other Indo-European language at home (80% speak English very well, 20% speak English well).
3.5% of residents speak Asian or Pacific Island language at home (56% speak English very well, 35% speak English well, 9% speak English not well).
0.2% of residents speak other language at home (100% speak English very well).
Foreign born population: 403 (8.0%)
(88.1% of them are naturalized citizens)
| Here: | 9.9 |
| State: | 7.3 |
| Here: | -651162790.0 |
| State: | 4.2 |

- Bedrooms in owner-occupied houses and condos in Hampton, Maryland
- 0no bedroom
- 01 bedroom
- 852 bedrooms
- 5903 bedrooms
- 8784 bedrooms
- 2495+ bedrooms

- Bedrooms in renter-occupied apartments in Hampton, Maryland
- 0no bedroom
- 01 bedroom
- 02 bedrooms
- 03 bedrooms
- 64 bedrooms
- 05+ bedrooms

- Cars and other vehicles available in Hampton in owner-occupied houses/condos
- 11no vehicle
- 2191 vehicle
- 9822 vehicles
- 3903 vehicles
- 1514 vehicles
- 485+ vehicles

- Cars and other vehicles available in Hampton in renter-occupied apartments
- 0no vehicle
- 01 vehicle
- 62 vehicles
- 03 vehicles
- 04 vehicles
- 05+ vehicles

- Rooms in owner-occupied houses in Hampton, Maryland
- 01 room
- 02 rooms
- 03 rooms
- 04 rooms
- 395 rooms
- 2286 rooms
- 3117 rooms
- 3218 rooms
- 9029+ rooms

- Rooms in renter-occupied apartments in Hampton, Maryland
- 01 room
- 02 rooms
- 03 rooms
- 04 rooms
- 05 rooms
- 06 rooms
- 07 rooms
- 68 rooms
- 09+ rooms


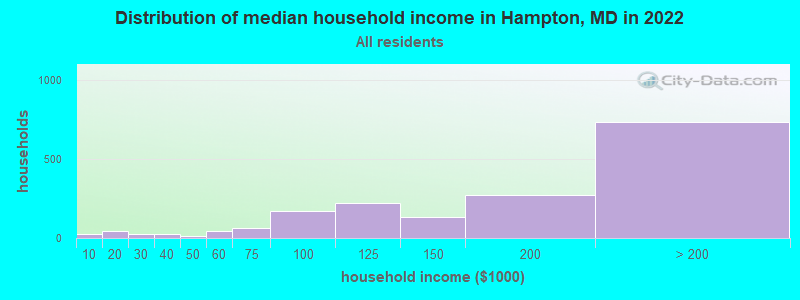
Hampton, MD household income distribution

- 24Less than $10,000
- 46$10,000 to $19,999
- 24$20,000 to $29,999
- 28$30,000 to $39,999
- 15$40,000 to $49,999
- 45$50,000 to $59,999
- 66$60,000 to $74,999
- 168$75,000 to $99,999
- 224$100,000 to $124,999
- 135$125,000 to $149,999
- 269$150,000 to $199,999
- 734$200,000 or more
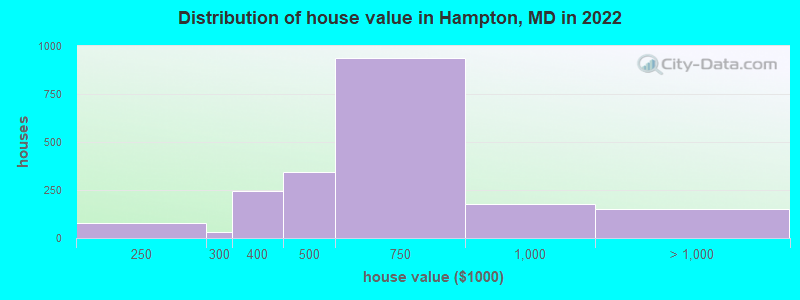
Home value of owner - occupied houses in 2022 in Hampton, MD
-
- 77$200,000 to $249,999
- 31$250,000 to $299,999
- 242$300,000 to $399,999
- 341$400,000 to $499,999
- 935$500,000 to $749,999
- 178$750,000 to $999,999
- 60$1,000,000 to $1,499,999
- 66$1,500,000 to $1,999,999
- 23$2,000,000 or more

Percentage of workers working in this county: 68.7%
Number of people working at home: 614 (24.1% of all workers)
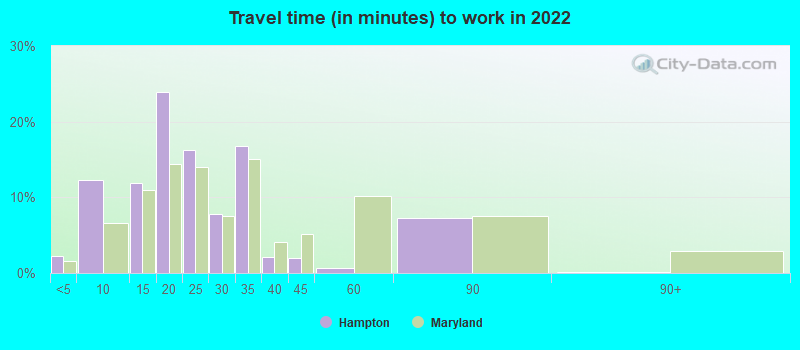
Travel time to work (commute)
- Less than 5 minutes: 25
- 5 to 9 minutes: 270
- 10 to 14 minutes: 214
- 15 to 19 minutes: 457
- 20 to 24 minutes: 304
- 25 to 29 minutes: 121
- 30 to 34 minutes: 202
- 35 to 39 minutes: 104
- 40 to 44 minutes: 78
- 45 to 59 minutes: 107
- 60 to 89 minutes: 91
- 90 or more minutes: 48
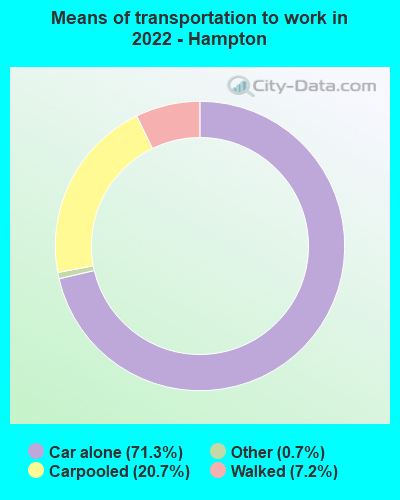
Means of transportation to work:
- Drove a car alone: 688 (46.2%)
- Carpooled: 228 (15.3%)
- Taxi: 8 (0.5%)
- Walked: 78 (5.2%)
- Worked at home: 614 (41.3%)

- Unemployment by race in 2022
- Unemployment rate for White non-Hispanic residents
- 0.3%Males
- Unemployment rate for Black residents
- 100.0%Females

- Year of entry for the foreign-born population in Hampton, Maryland
- 442010 or later
- 982000 to 2009
- 261990 to 1999
- 371980 to 1989
- 1501970 to 1979
- 298Before 1970

First ancestries reported:
- Irish: 341 (17.0%)
- German: 309 (15.4%)
- American: 169 (8.4%)
- English: 166 (8.3%)
- Italian: 79 (3.9%)
- Polish: 62 (3.1%)
- Greek: 46 (2.3%)
- European: 38 (1.9%)
- Armenian: 28 (1.4%)
- Ukrainian: 24 (1.2%)
- Eastern European: 15 (0.7%)
- Iranian: 15 (0.7%)
- Czech: 13 (0.6%)
- Scottish: 12 (0.6%)
- Dutch: 10 (0.5%)
- French: 10 (0.5%)
- British: 9 (0.4%)
- Hungarian: 9 (0.4%)
- Lebanese: 8 (0.4%)
- Slovak: 8 (0.4%)
- Swedish: 8 (0.4%)
- Norwegian: 7 (0.3%)
Most common places of birth for foreign-born residents (%):
| Hampton: | 14.3% (58) |
| Maryland: | 6.4% (61,725) |
| Hampton: | 13.5% (55) |
| Maryland: | 4.6% (44,742) |
| Hampton: | 11.1% (45) |
| Maryland: | 3.4% (32,635) |
| Hampton: | 9.6% (39) |
| Maryland: | 3.8% (36,698) |
| Hampton: | 8.4% (34) |
| Maryland: | 1.8% (17,037) |
| Hampton: | 7.9% (32) |
| Maryland: | 1.0% (9,481) |
| Hampton: | 4.7% (19) |
| Maryland: | 1.4% (13,947) |
| Hampton: | 3.2% (13) |
| Maryland: | 0.3% (2,415) |
| Hampton: | 3.0% (12) |
| Maryland: | 0.4% (4,282) |
| Hampton: | 2.7% (11) |
| Maryland: | 0.1% (1,273) |
| Hampton: | 2.7% (11) |
| Maryland: | 0.1% (626) |
| Hampton: | 2.2% (9) |
| Maryland: | 1.2% (11,265) |
| Hampton: | 2.0% (8) |
| Maryland: | 0.2% (1,697) |
| Hampton: | 2.0% (8) |
| Maryland: | 3.5% (34,065) |
| Hampton: | 1.7% (7) |
| Maryland: | 0.9% (8,603) |
Place of birth for U.S.-born residents:
- This state: 3,069
- Other state: 1,472
- Northeast: 763
- Midwest: 227
- South: 448
- West: 43
97.4% of Hampton residents lived in the same house 1 years ago.
Out of people who lived in different houses, 42.8% lived in this county.
Out of people who lived in different counties, 60.4% lived in Maryland.
| Hampton: | 97.4% |
| State average: | 88.5% |
Education attainment for males 25 years and older:
- No schooling: 0
- Nursery to 4th grade: 0
- 5th and 6th grade: 0
- 7th and 8th grade: 0
- 9th grade: 0
- 10th grade: 0
- 11th grade: 0
- 12th grade, no diploma: 0
- High school graduate (or equivalency): 109
- Less than 1 year of college: 42
- Some college more than 1 year, no degree: 94
- Associate degree: 65
- Bachelor's degree: 805
- Master's degree: 355
- Professional school degree: 129
- Doctorate degree: 122

Education attainment for females 25 years and older:
- No schooling: 1
- Nursery to 4th grade: 0
- 5th and 6th grade: 0
- 7th and 8th grade: 11
- 9th grade: 0
- 10th grade: 10
- 11th grade: 0
- 12th grade, no diploma: 15
- High school graduate (or equivalency): 200
- Less than 1 year of college: 48
- Some college more than 1 year, no degree: 64
- Associate degree: 62
- Bachelor's degree: 625
- Master's degree: 550
- Professional school degree: 208
- Doctorate degree: 112

Housing units in structures:
- One, detached: 1,824
- One, attached: 74

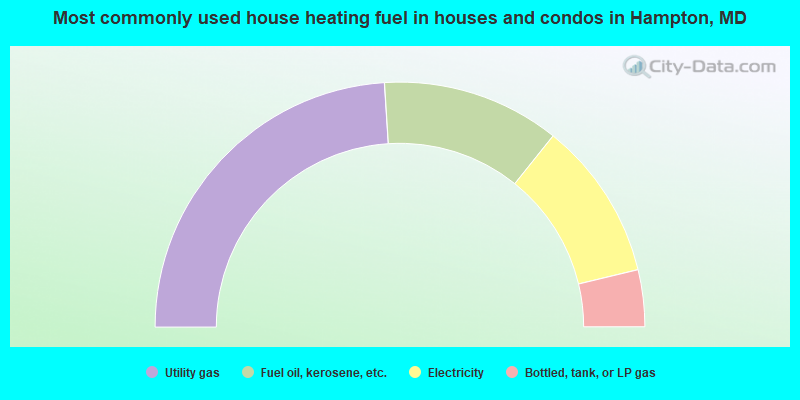
- 48.0%Utility gas
- 23.5%Fuel oil, kerosene, etc.
- 21.0%Electricity
- 7.5%Bottled, tank, or LP gas
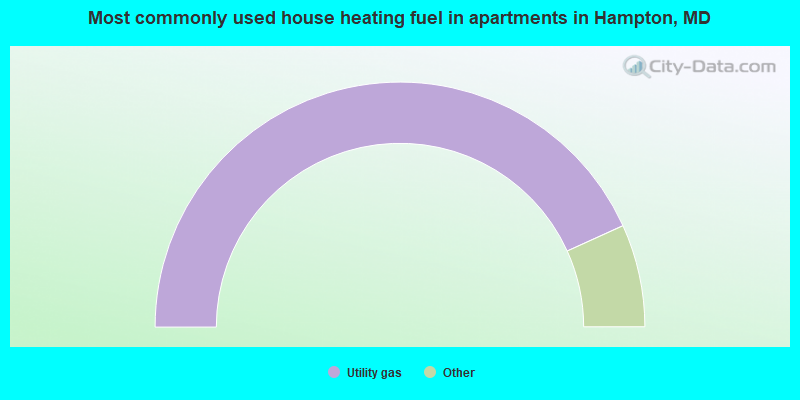
- 100.0%Utility gas
Private vs. public school enrollment:
| Here: | 31.6% |
| Maryland: | 15.2% |
| Here: | 50.2% |
| Maryland: | 14.4% |
| Here: | 22.8% |
| Maryland: | 20.2% |


