Harleysville, PA (Pennsylvania) Houses and Residents
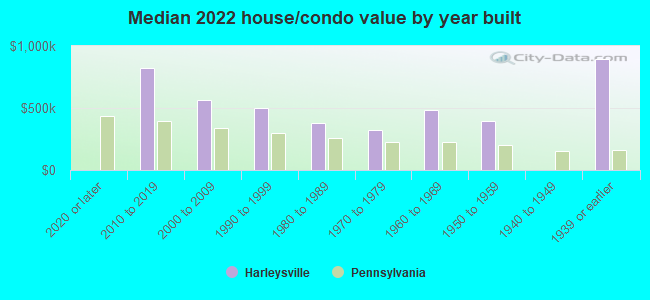
| Harleysville: | $424,446 |
| Pennsylvania: | $245,500 |
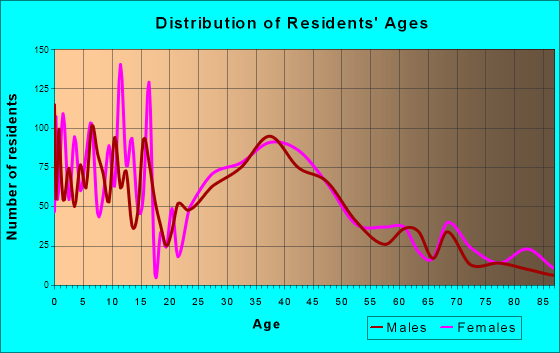
Total population: 9,286 (Urban population: 8,869, Rural population: 0)
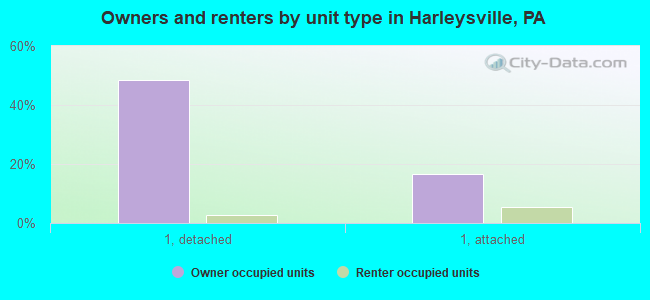
Houses: 3,833 (3,729 occupied: 2,495 owner occupied, 1,258 renter occupied)
| % of renters here: | 34% |
| State: | 31% |
Housing density: 920 houses/condos per square mile
Median price asked for vacant for-sale houses and condos in 2022 in this county: $277,563.
Median contract rent in 2022: $1,600 (lower quartile is $1,150, upper quartile is over $2,000)
Median rent asked for vacant for-rent units in 2022: $1,943
Median gross rent in Harleysville, PA in 2022: $1,734
Housing units in Harleysville with a mortgage: 1,478 (366 second mortgage, 22 home equity loan, 298 both second mortgage and home equity loan)
Houses without a mortgage: 101
Median household income for houses/condos with a mortgage: $166,380
Median household income for apartments without a mortgage: $119,685
Median monthly housing costs: $1,605
Compare current foreclosures near Harleysville, PA:
| Photo | Address | Area | Beds / Baths | Price | Details |
|---|---|---|---|---|---|

|
#1
Shirley Dr
Harleysville, PA 19438
|
2,105 sq. feet
|
2 baths 4 beds |
show details | |

|
#2
Sumneytown Rd
Harleysville, PA 19438
|
1,470 sq. feet
|
1 baths 3 beds |
show details | |

|
#3
Hunsberger Ln
Harleysville, PA 19438
|
1,504 sq. feet
|
2 baths 3 beds |
show details | |

|
#4
School Ln
Harleysville, PA 19438
|
2,180 sq. feet
|
1 baths 3 beds |
show details | |

|
#5
Hunsberger Ln
Harleysville, PA 19438
|
1,504 sq. feet
|
2 baths 3 beds |
show details | |

|
#6
Monroe Dr
Harleysville, PA 19438
|
1,703 sq. feet
|
2 baths 3 beds |
show details | |

|
#7
School Ln
Harleysville, PA 19438
|
2,180 sq. feet
|
1 baths 3 beds |
show details | |

|
#8
Shirley Dr
Harleysville, PA 19438
|
2,194 sq. feet
|
2 baths 4 beds |
show details | |

|
#9
Arden Ct
Harleysville, PA 19438
|
1,197 sq. feet
|
1 baths 3 beds |
show details | |

|
#10
Surrey Ln
Harleysville, PA 19438
|
1,316 sq. feet
|
2 baths 3 beds |
show details |
| Photo | Address | Area | Beds / Baths | Price | Details |
|---|---|---|---|---|---|

|
#11
Covenant Ln
Harleysville, PA 19438
|
- sq. feet
|
- baths - beds |
show details | |

|
#12
Schoolhouse Rd
Harleysville, PA 19438
|
- sq. feet
|
- baths - beds |
show details | |

|
#13
Snyder Rd
Green Lane, PA 18054
|
1,950 sq. feet
|
1 baths 3 beds |
$449,900
|
show details |

|
#14
Church St
Royersford, PA 19468
|
1,811 sq. feet
|
1 baths 4 beds |
$162,000
|
show details |

|
#15
Woodlawn Ave
Phoenixville, PA 19460
|
1,788 sq. feet
|
1 baths 2 beds |
$144,656
|
show details |

|
#16
Drummers Ln
Wayne, PA 19087
|
1,275 sq. feet
|
2 baths 2 beds |
$83,998
|
show details |

|
#17
Dekalb Pike
Norristown, PA 19401
|
2,583 sq. feet
|
2 baths 4 beds |
$255,189
|
show details |

|
#18
Woodside Ave
Berwyn, PA 19312
|
2,080 sq. feet
|
2 baths 5 beds |
$525,082
|
show details |

|
#19
Hoffecker Rd
Phoenixville, PA 19460
|
1,260 sq. feet
|
2 baths 3 beds |
$217,558
|
show details |

|
#20
Old Lancaster Rd # 50
Devon, PA 19333
|
2,352 sq. feet
|
2 baths 5 beds |
$475,481
|
show details |
| Photo | Address | Area | Beds / Baths | Price | Details |
|---|---|---|---|---|---|

|
#21
Ridge Rd
Spring City, PA 19475
|
1,456 sq. feet
|
2 baths 3 beds |
$235,715
|
show details |

|
#22
Lewisville Ct
Phoenixville, PA 19460
|
1,605 sq. feet
|
2 baths 2 beds |
$51,546
|
show details |

|
#23
Hopkinson Ct # 160
Wayne, PA 19087
|
1,656 sq. feet
|
2 baths 2 beds |
$214,896
|
show details |

|
#24
New Market Ct
Wayne, PA 19087
|
1,080 sq. feet
|
1 baths 2 beds |
$98,656
|
show details |

|
#25
Woodcrest Rd
Wayne, PA 19087
|
2,240 sq. feet
|
2 baths 4 beds |
$705,233
|
show details |

|
#26
Westridge Cir # 8
Phoenixville, PA 19460
|
928 sq. feet
|
2 baths 2 beds |
$3,949
|
show details |

|
#27
Gulph Rd
Wayne, PA 19087
|
3,262 sq. feet
|
2 baths 4 beds |
$651,481
|
show details |

|
#28
Dale Rd
Barto, PA 19504
|
1,254 sq. feet
|
1 baths 3 beds |
$4,165
|
show details |

|
#29
2nd Ave
Phoenixville, PA 19460
|
1,120 sq. feet
|
1 baths 3 beds |
$39,472
|
show details |

|
#30
Yost Ave
Spring City, PA 19475
|
2,540 sq. feet
|
3 baths 4 beds |
$448,830
|
show details |
| Photo | Address | Area | Beds / Baths | Price | Details |
|---|---|---|---|---|---|

|
#31
South St
Phoenixville, PA 19460
|
1,568 sq. feet
|
1 baths 3 beds |
$178,971
|
show details |

|
#32
Bridge St
Spring City, PA 19475
|
1,686 sq. feet
|
3 baths 3 beds |
$252,371
|
show details |

|
#33
N Penn St
Pottstown, PA 19464
|
1,872 sq. feet
|
2 baths 4 beds |
show details | |

|
#34
Hartman Run # 1
Phoenixville, PA 19460
|
2,919 sq. feet
|
2 baths 3 beds |
show details | |

|
#35
Main St
Royersford, PA 19468
|
- sq. feet
|
2 baths 5 beds |
show details | |

|
#36
N York St
Pottstown, PA 19464
|
2,352 sq. feet
|
1 baths 5 beds |
show details | |

|
#37
Rhoads Rd
Pottstown, PA 19464
|
1,615 sq. feet
|
1 baths 3 beds |
show details | |

|
#38
Fox Hunt Ln
Warminster, PA 18974
|
1,768 sq. feet
|
1 baths 4 beds |
show details | |

|
#39
Hilltop Rd
Pottstown, PA 19464
|
1,155 sq. feet
|
2 baths 2 beds |
show details | |

|
#40
Stonington Cir
North Wales, PA 19454
|
3,486 sq. feet
|
2 baths 4 beds |
show details |
| Photo | Address | Area | Beds / Baths | Price | Details |
|---|---|---|---|---|---|

|
#41
Reading Ave
Boyertown, PA 19512
|
1,634 sq. feet
|
1 baths 2 beds |
show details | |

|
#42
Hilltown Pike
Hilltown, PA 18927
|
1,634 sq. feet
|
1 baths 3 beds |
show details | |

|
#43
Wright Rd
Quakertown, PA 18951
|
896 sq. feet
|
1 baths 2 beds |
show details | |

|
#44
E Paletown Rd
Quakertown, PA 18951
|
1,232 sq. feet
|
1 baths 3 beds |
show details | |

|
#45
N Keim St
Pottstown, PA 19464
|
1,140 sq. feet
|
1 baths 2 beds |
show details | |

|
#46
E Howard St
Pottstown, PA 19464
|
688 sq. feet
|
1 baths 3 beds |
show details | |

|
#47
Green St
Perkasie, PA 18944
|
3,437 sq. feet
|
2 baths 4 beds |
show details | |

|
#48
Yorkshire Rd
Doylestown, PA 18902
|
3,552 sq. feet
|
3 baths 4 beds |
show details | |

|
#49
Sweetbriar Dr
Jamison, PA 18929
|
2,261 sq. feet
|
2 baths 3 beds |
show details | |

|
Check over 1 million property listings on Foreclosure.com!
|
browse all offers | |||

Latest news about housing in Harleysville, PA collected exclusively by city-data.com from local newspapers, TV, and radio stations


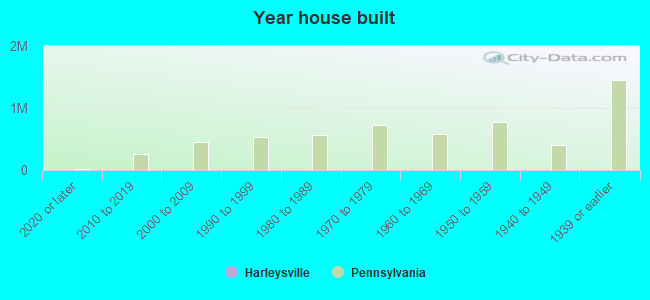
Median year apartment built: 1988
Household type by relationship:
Households: 9,078- Male householders: 1,904 (390 living alone), Female householders: 1,823 (617 living alone)
2,203 spouses (2,179 opposite-sex spouses), 169 unmarried partners, (169 opposite-sex unmarried partners), 2,317 children (2,119 natural, 60 adopted, 137 stepchildren), 94 grandchildren, 0 brothers or sisters, 247 parents, 0 foster children, 47 other relatives, 44 non-relatives
- In group quarters: 227
Size of family households: 1,453 2-persons, 498 3-persons, 372 4-persons, 193 5-persons, 59 6-persons.
Size of nonfamily households: 1,038 1-person, 137 2-persons.
1,243 married couples with children.
82 single-parent households (0 men, 82 women).
92.5% of residents of Harleysville speak English at home.
2.6% of residents speak Spanish at home (92% speak English very well, 8% speak English not well).
1.8% of residents speak other Indo-European language at home (40% speak English very well, 60% speak English well).
3.0% of residents speak Asian or Pacific Island language at home (64% speak English very well, 36% speak English well).
0.3% of residents speak other language at home (100% speak English very well).
Foreign born population: 395 (4.4%)
(87.3% of them are naturalized citizens)
| Here: | 7.7 |
| State: | 6.8 |
| Here: | 3.8 |
| State: | 4.3 |
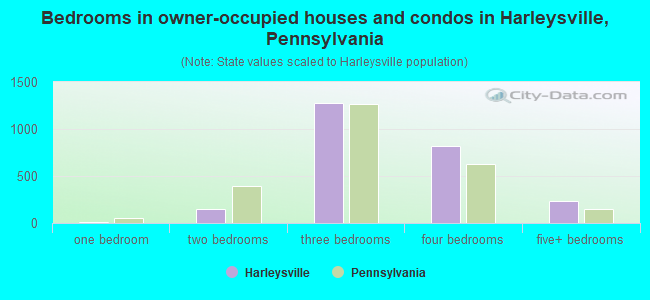
- Bedrooms in owner-occupied houses and condos in Harleysville, Pennsylvania
- 7no bedroom
- 121 bedroom
- 1502 bedrooms
- 1,2793 bedrooms
- 8154 bedrooms
- 2315+ bedrooms
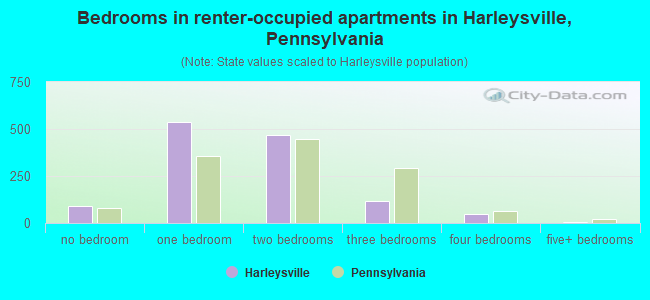
- Bedrooms in renter-occupied apartments in Harleysville, Pennsylvania
- 88no bedroom
- 5351 bedroom
- 4662 bedrooms
- 1163 bedrooms
- 474 bedrooms
- 75+ bedrooms
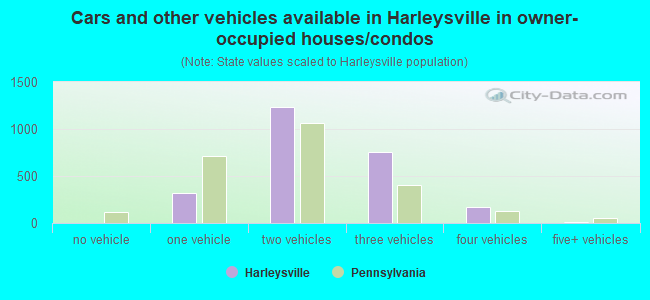
- Cars and other vehicles available in Harleysville in owner-occupied houses/condos
- 0no vehicle
- 3221 vehicle
- 1,2342 vehicles
- 7573 vehicles
- 1754 vehicles
- 75+ vehicles
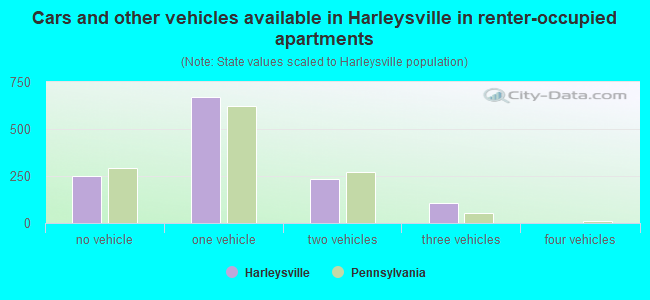
- Cars and other vehicles available in Harleysville in renter-occupied apartments
- 249no vehicle
- 6681 vehicle
- 2352 vehicles
- 1073 vehicles
- 04 vehicles
- 05+ vehicles
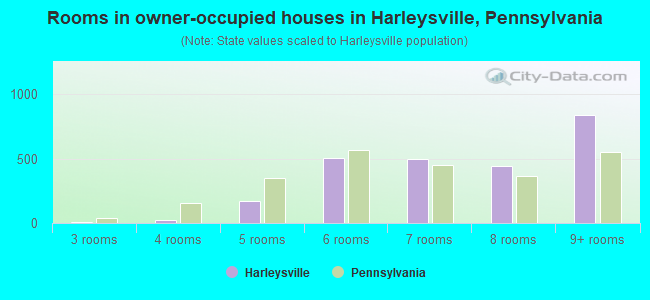
- Rooms in owner-occupied houses in Harleysville, Pennsylvania
- 71 room
- 02 rooms
- 103 rooms
- 224 rooms
- 1715 rooms
- 5036 rooms
- 4957 rooms
- 4458 rooms
- 8419+ rooms
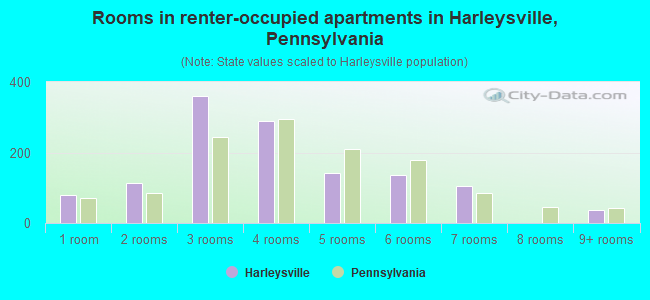
- Rooms in renter-occupied apartments in Harleysville, Pennsylvania
- 791 room
- 1132 rooms
- 3593 rooms
- 2884 rooms
- 1415 rooms
- 1376 rooms
- 1057 rooms
- 08 rooms
- 379+ rooms
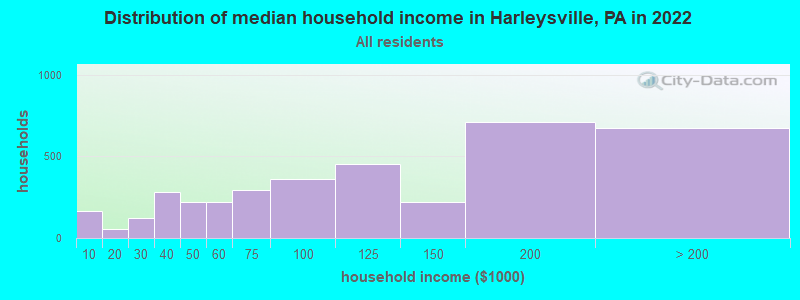
Harleysville, PA household income distribution

- 166Less than $10,000
- 55$10,000 to $19,999
- 125$20,000 to $29,999
- 283$30,000 to $39,999
- 220$40,000 to $49,999
- 218$50,000 to $59,999
- 292$60,000 to $74,999
- 361$75,000 to $99,999
- 453$100,000 to $124,999
- 220$125,000 to $149,999
- 710$150,000 to $199,999
- 675$200,000 or more
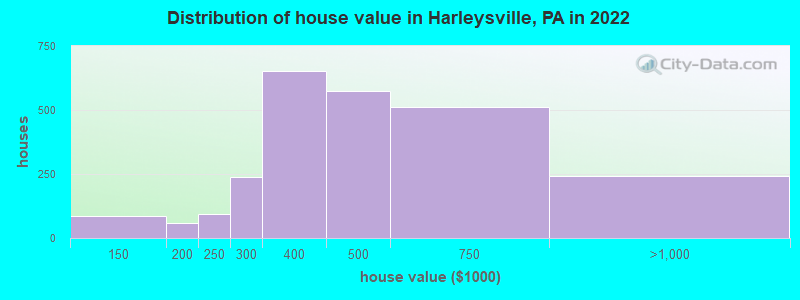
Home value of owner - occupied houses in 2022 in Harleysville, PA
-
- 4$40,000 to $49,999
- 81$100,000 to $124,999
- 5$125,000 to $149,999
- 58$175,000 to $199,999
- 91$200,000 to $249,999
- 239$250,000 to $299,999
- 654$300,000 to $399,999
- 572$400,000 to $499,999
- 512$500,000 to $749,999
- 243$750,000 to $999,999
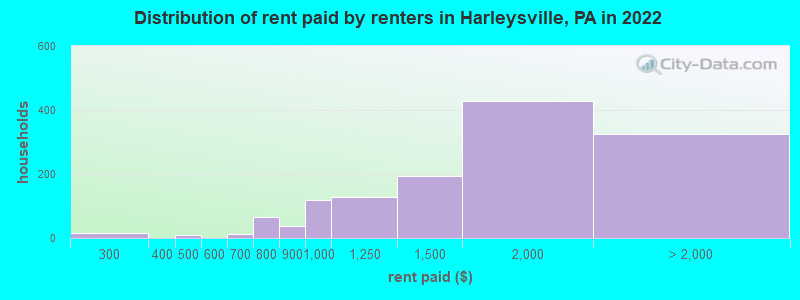
Rent paid by renters in 2022 in Harleysville, PA
-
- 17$200 to $249
- 7$450 to $499
- 11$650 to $699
- 64$700 to $749
- 37$800 to $899
- 119$900 to $999
- 126$1,000 to $1,249
- 194$1,250 to $1,499
- 428$1,500 to $1,999
- 108$2,000 to $2,499
- 117$2,500 to $2,999
- 18$3,000 to $3,499
- 74$3,500 or more
- 7No cash rent
Percentage of workers working in this county: 77.9%
Number of people working at home: 1,056 (21.1% of all workers)
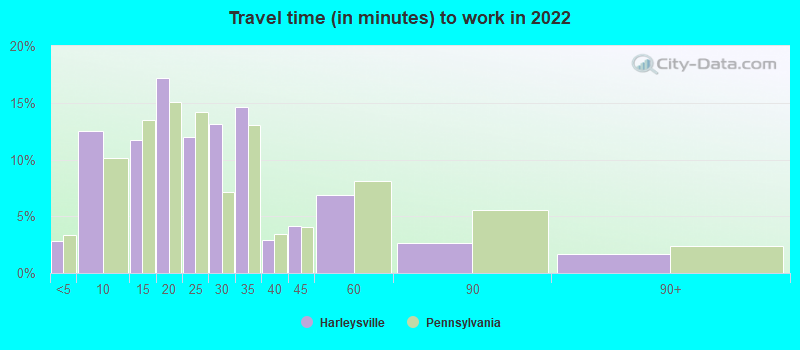
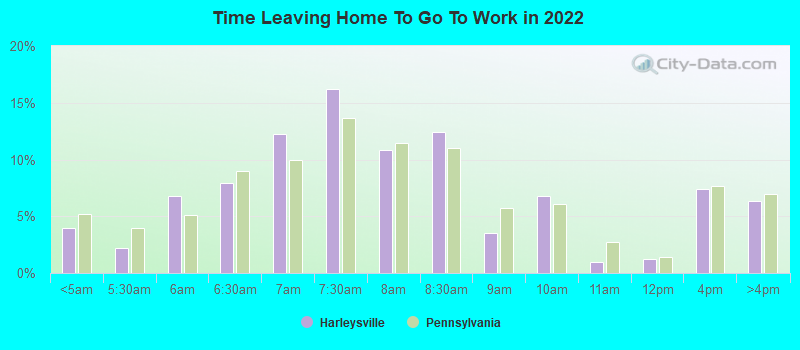
Travel time to work (commute)
- Less than 5 minutes: 99
- 5 to 9 minutes: 438
- 10 to 14 minutes: 500
- 15 to 19 minutes: 475
- 20 to 24 minutes: 430
- 25 to 29 minutes: 347
- 30 to 34 minutes: 475
- 35 to 39 minutes: 134
- 40 to 44 minutes: 266
- 45 to 59 minutes: 497
- 60 to 89 minutes: 174
- 90 or more minutes: 77
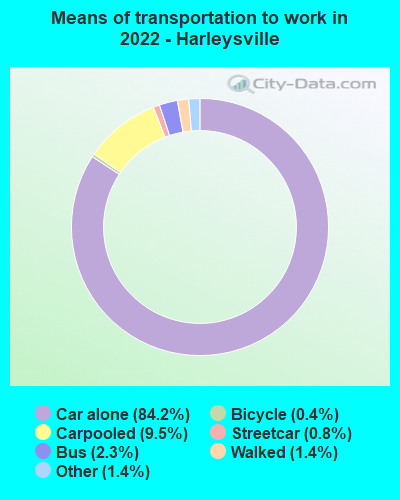
Means of transportation to work:
- Drove a car alone: 2,706 (64.4%)
- Carpooled: 317 (7.5%)
- Bus: 47 (1.1%)
- Subway or elevated rail: 22 (0.5%)
- Taxi: 57 (1.4%)
- Bicycle: 10 (0.2%)
- Walked: 45 (1.1%)
- Worked at home: 1,056 (25.1%)
- Unemployment by race in 2022
- Unemployment rate for White non-Hispanic residents
- 1.3%Males
- 2.8%Females
- Unemployment rate for two or more race residents
- 13.0%Males
- Unemployment rate for Hispanic or Latino residents
- 15.1%Males
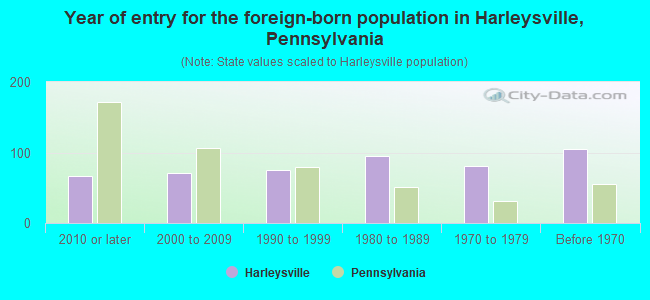
- Year of entry for the foreign-born population in Harleysville, Pennsylvania
- 662010 or later
- 712000 to 2009
- 751990 to 1999
- 951980 to 1989
- 811970 to 1979
- 105Before 1970
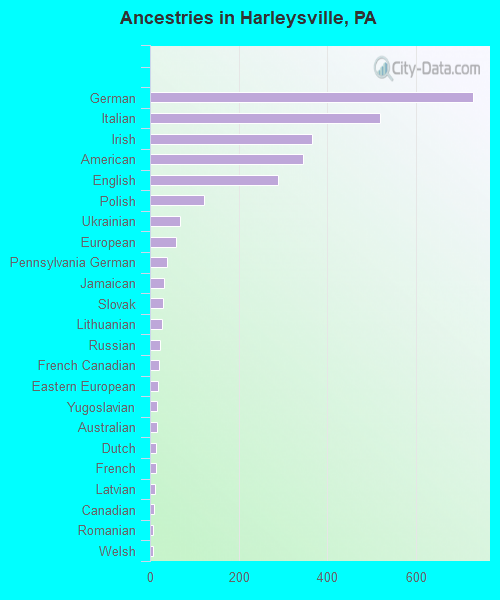
First ancestries reported:
- German: 728 (19.7%)
- Italian: 519 (14.0%)
- Irish: 366 (9.9%)
- American: 345 (9.3%)
- English: 289 (7.8%)
- Polish: 121 (3.3%)
- Ukrainian: 67 (1.8%)
- European: 58 (1.6%)
- Pennsylvania German: 39 (1.1%)
- Jamaican: 32 (0.9%)
- Slovak: 29 (0.8%)
- Lithuanian: 27 (0.7%)
- Russian: 23 (0.6%)
- French Canadian: 20 (0.5%)
- Eastern European: 17 (0.5%)
- Yugoslavian: 16 (0.4%)
- Australian: 15 (0.4%)
- Dutch: 13 (0.4%)
- French: 13 (0.4%)
- Latvian: 11 (0.3%)
- Canadian: 9 (0.2%)
- Romanian: 7 (0.2%)
- Welsh: 7 (0.2%)
Most common places of birth for foreign-born residents (%):
| Harleysville: | 32.5% (134) |
| Pennsylvania: | 10.7% (100,596) |
| Harleysville: | 11.2% (46) |
| Pennsylvania: | 3.3% (31,542) |
| Harleysville: | 8.0% (33) |
| Pennsylvania: | 2.2% (21,039) |
| Harleysville: | 6.6% (27) |
| Pennsylvania: | 1.8% (16,884) |
| Harleysville: | 6.6% (27) |
| Pennsylvania: | 1.9% (18,065) |
| Harleysville: | 5.8% (24) |
| Pennsylvania: | 0.6% (5,742) |
| Harleysville: | 5.1% (21) |
| Pennsylvania: | 1.5% (13,823) |
| Harleysville: | 3.6% (15) |
| Pennsylvania: | 0.1% (908) |
| Harleysville: | 3.4% (14) |
| Pennsylvania: | 2.4% (22,612) |
| Harleysville: | 2.9% (12) |
| Pennsylvania: | 1.3% (12,172) |
| Harleysville: | 2.4% (10) |
| Pennsylvania: | 0.6% (6,036) |
| Harleysville: | 1.9% (8) |
| Pennsylvania: | 1.8% (17,032) |
Place of birth for U.S.-born residents:
- This state: 6,886
- Other state: 1,586
- Northeast: 952
- Midwest: 137
- South: 291
- West: 202
94.1% of Harleysville residents lived in the same house 1 years ago.
Out of people who lived in different houses, 38.7% lived in this county.
Out of people who lived in different counties, 89.2% lived in Pennsylvania.
| Harleysville: | 94.1% |
| State average: | 89.3% |
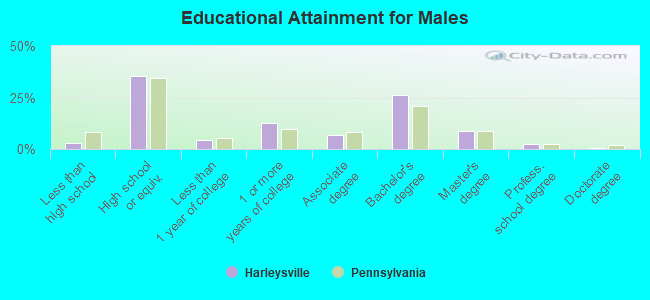
Education attainment for males 25 years and older:
- No schooling: 26
- Nursery to 4th grade: 1
- 5th and 6th grade: 5
- 7th and 8th grade: 7
- 9th grade: 0
- 10th grade: 9
- 11th grade: 11
- 12th grade, no diploma: 41
- High school graduate (or equivalency): 1,276
- Less than 1 year of college: 150
- Some college more than 1 year, no degree: 454
- Associate degree: 239
- Bachelor's degree: 948
- Master's degree: 308
- Professional school degree: 89
- Doctorate degree: 23
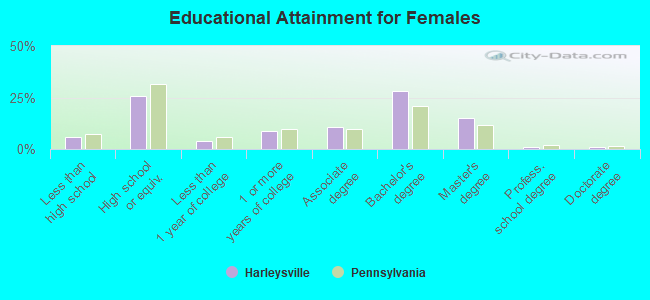
Education attainment for females 25 years and older:
- No schooling: 0
- Nursery to 4th grade: 0
- 5th and 6th grade: 7
- 7th and 8th grade: 42
- 9th grade: 0
- 10th grade: 85
- 11th grade: 6
- 12th grade, no diploma: 60
- High school graduate (or equivalency): 888
- Less than 1 year of college: 132
- Some college more than 1 year, no degree: 295
- Associate degree: 361
- Bachelor's degree: 969
- Master's degree: 522
- Professional school degree: 40
- Doctorate degree: 35

Housing units in structures:
- One, detached: 1,930
- One, attached: 889
- Two: 133
- 3 or 4: 87
- 5 to 9: 83
- 10 to 19: 119
- 20 to 49: 108
- 50 or more: 481
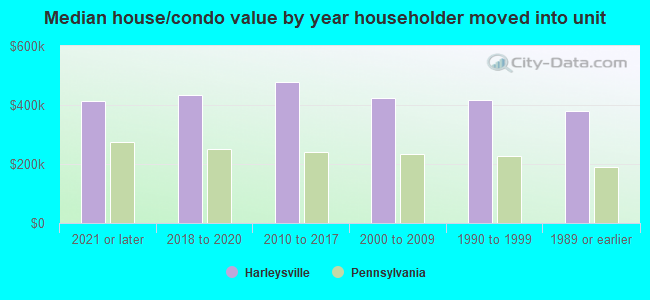
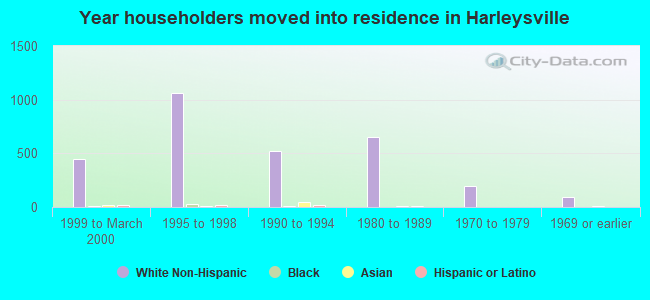
House/condo owner moved in on average 18 years ago
Renter moved in on average 3 years ago
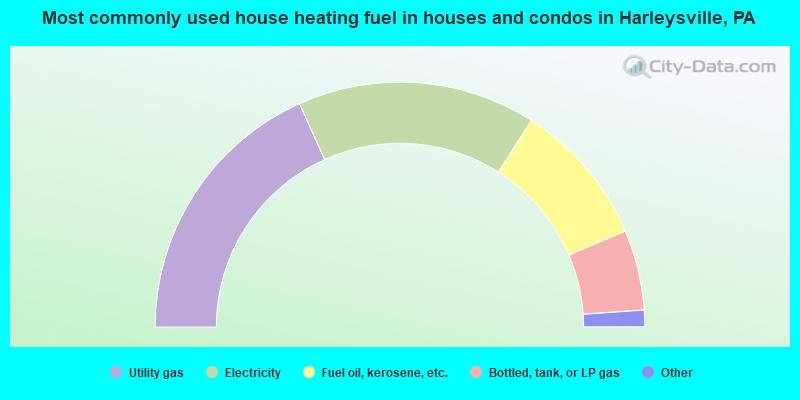
- 36.6%Utility gas
- 31.5%Electricity
- 19.2%Fuel oil, kerosene, etc.
- 10.6%Bottled, tank, or LP gas
- 1.8%Wood
- 0.4%Other fuel
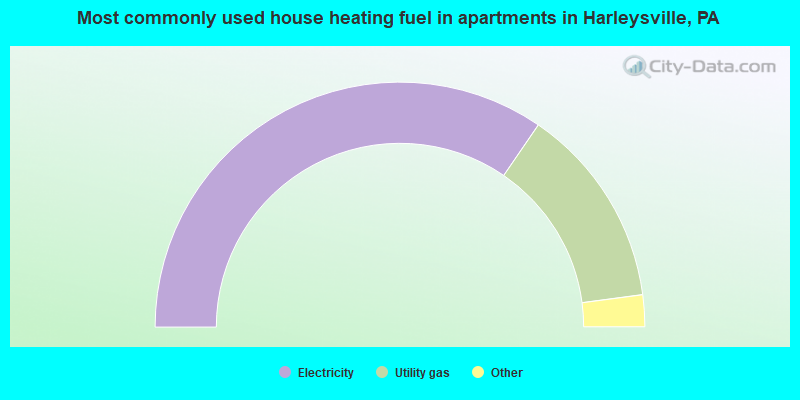
- 69.2%Electricity
- 26.7%Utility gas
- 2.6%Fuel oil, kerosene, etc.
- 1.5%Bottled, tank, or LP gas
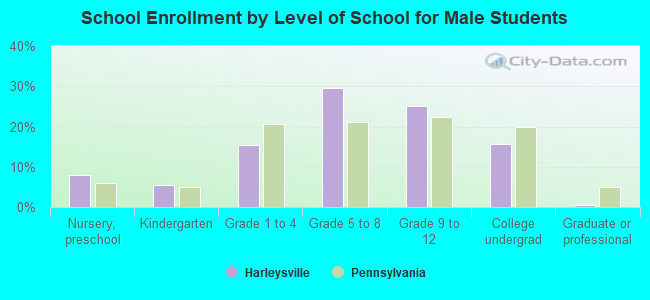
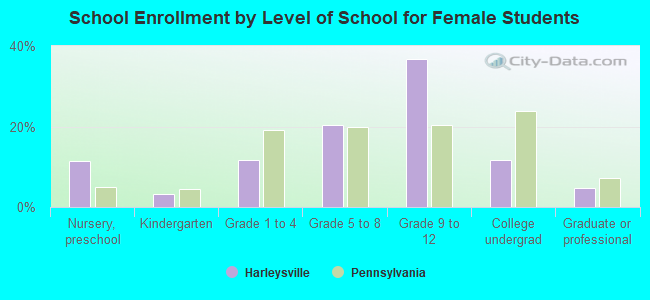
Private vs. public school enrollment:
| Here: | 4.4% |
| Pennsylvania: | 15.7% |
| Here: | 5.1% |
| Pennsylvania: | 13.4% |
| Here: | 8.5% |
| Pennsylvania: | 39.8% |