Harrisonville, KY (Kentucky) Houses and Residents
| Harrisonville: | $246,725 |
| Kentucky: | $196,300 |
Total population: 5,157 (Urban population: 0, Rural population: 4,234 (586 farm, 3,648 nonfarm))
Houses: 1,684 (1,582 occupied: 1,353 owner occupied, 229 renter occupied)
| % of renters here: | 14% |
| State: | 31% |
Housing density: 17 houses/condos per square mile
Median price asked for vacant for-sale houses and condos in 2022 in this county: $200,191.
Median contract rent in 2022: $726 (lower quartile is $710, upper quartile is $899)
Median rent asked for vacant for-rent units in 2022: $510
Median gross rent in Harrisonville, KY in 2022: $1,069
Housing units in Harrisonville with a mortgage: 563 (51 second mortgage, 107 home equity loan, 0 both second mortgage and home equity loan)
Houses without a mortgage: 223
Compare current foreclosures near Harrisonville, KY:
| Photo | Address | Area | Beds / Baths | Price | Details |
|---|---|---|---|---|---|

|
#1
Leonardwood Dr Unit 404
Frankfort, KY 40601
|
1,330 sq. feet
|
3 baths 2 beds |
show details | |

|
#2
Willowcrest Dr
Frankfort, KY 40601
|
1,542 sq. feet
|
2 baths 3 beds |
show details | |

|
#3
Bear Creek Rd
Lawrenceburg, KY 40342
|
2,025 sq. feet
|
2 baths 3 beds |
show details | |

|
#4
Timothy Dr
Frankfort, KY 40601
|
1,502 sq. feet
|
2 baths 3 beds |
show details | |

|
#5
Morning Ct
Shelbyville, KY 40065
|
1,677 sq. feet
|
2 baths 3 beds |
show details | |

|
#6
Evergreen Rd
Frankfort, KY 40601
|
2,696 sq. feet
|
2 baths 5 beds |
show details | |

|
#7
Donalynn Dr
Frankfort, KY 40601
|
1,806 sq. feet
|
1 baths 2 beds |
show details | |

|
#8
Mike St
Lawrenceburg, KY 40342
|
1,428 sq. feet
|
1 baths 3 beds |
show details | |

|
#9
Fawn Ln
Pleasureville, KY 40057
|
1,152 sq. feet
|
2 baths 3 beds |
show details | |

|
#10
Cherry Ln
Shelbyville, KY 40065
|
871 sq. feet
|
2 baths 4 beds |
show details |
| Photo | Address | Area | Beds / Baths | Price | Details |
|---|---|---|---|---|---|

|
#11
Spring St
Shelbyville, KY 40065
|
1,025 sq. feet
|
1 baths 3 beds |
show details | |

|
#12
Hunting Hills Dr
Shelbyville, KY 40065
|
2,242 sq. feet
|
2 baths 4 beds |
show details | |

|
#13
Oakwood Dr
Shelbyville, KY 40065
|
1,000 sq. feet
|
1 baths 3 beds |
show details | |

|
#14
Oak Dr
Eminence, KY 40019
|
1,260 sq. feet
|
2 baths 3 beds |
show details | |

|
#15
Mccracken Pike
Frankfort, KY 40601
|
1,288 sq. feet
|
1 baths 2 beds |
show details | |

|
#16
Nordic Ct
Shelbyville, KY 40065
|
1,680 sq. feet
|
2 baths 4 beds |
show details | |

|
#17
Oakwood Dr
Shelbyville, KY 40065
|
1,000 sq. feet
|
1 baths 3 beds |
show details | |

|
#18
Main St
Pleasureville, KY 40057
|
1,087 sq. feet
|
1 baths 3 beds |
show details | |

|
#19
Gill St
Lawrenceburg, KY 40342
|
1,640 sq. feet
|
1 baths 3 beds |
show details | |

|
#20
Highland Ave
Lawrenceburg, KY 40342
|
1,624 sq. feet
|
1 baths 3 beds |
show details |
| Photo | Address | Area | Beds / Baths | Price | Details |
|---|---|---|---|---|---|

|
#21
Morning Glory Ln
Shelbyville, KY 40065
|
3,141 sq. feet
|
3 baths 3 beds |
show details | |

|
#22
Highland Ave
Lawrenceburg, KY 40342
|
728 sq. feet
|
1 baths 2 beds |
show details | |

|
#23
Hill N Dale Rd
Shelbyville, KY 40065
|
1,188 sq. feet
|
1 baths 2 beds |
show details | |

|
#24
Hickory Rd
Lawrenceburg, KY 40342
|
1,175 sq. feet
|
1 baths 3 beds |
show details | |

|
#25
Horn Dr
Lawrenceburg, KY 40342
|
1,144 sq. feet
|
1 baths 3 beds |
show details | |

|
#26
Catwalk Rd
Bagdad, KY 40003
|
2,302 sq. feet
|
2 baths 3 beds |
show details | |

|
#27
Holmes St
Frankfort, KY 40601
|
2 sq. feet
|
2 baths 3 beds |
show details | |

|
#28
Walker Ln
Lawrenceburg, KY 40342
|
1,238 sq. feet
|
2 baths 3 beds |
show details | |

|
#29
Hillcrest Dr
Eminence, KY 40019
|
1,050 sq. feet
|
1 baths 3 beds |
show details | |

|
#30
Brassfield Cir
Shelbyville, KY 40065
|
2,014 sq. feet
|
2 baths 3 beds |
show details |
| Photo | Address | Area | Beds / Baths | Price | Details |
|---|---|---|---|---|---|

|
#31
Lawrenceburg Rd
Chaplin, KY 40012
|
1,568 sq. feet
|
1 baths 3 beds |
show details | |

|
#32
Shady Ln
Midway, KY 40347
|
1,820 sq. feet
|
1 baths 3 beds |
show details | |

|
#33
Buck Run Rd
Versailles, KY 40383
|
2,034 sq. feet
|
2 baths 3 beds |
show details | |

|
#34
Tolle Ct
Eminence, KY 40019
|
1,778 sq. feet
|
1 baths 4 beds |
show details | |

|
#35
Eagle Pass
Shelbyville, KY 40065
|
2,208 sq. feet
|
2 baths 3 beds |
show details | |

|
#36
Bluegrass Dr
Shelbyville, KY 40065
|
2,144 sq. feet
|
2 baths 3 beds |
show details | |

|
#37
Wildcat Rd
Lawrenceburg, KY 40342
|
1,732 sq. feet
|
2 baths 3 beds |
show details | |

|
#38
Beechwood Ave
Frankfort, KY 40601
|
- sq. feet
|
2 baths 3 beds |
show details | |

|
#39
Donalynn Dr
Frankfort, KY 40601
|
- sq. feet
|
2 baths 3 beds |
show details | |

|
#40
Crab Orchard Rd
Frankfort, KY 40601
|
- sq. feet
|
1 baths 3 beds |
show details |
| Photo | Address | Area | Beds / Baths | Price | Details |
|---|---|---|---|---|---|

|
#41
Carla Ct
Frankfort, KY 40601
|
- sq. feet
|
1 baths 3 beds |
show details | |

|
#42
Victoria Dr
Shelbyville, KY 40065
|
1,378 sq. feet
|
1 baths - beds |
show details | |

|
#43
Tamworth Ln
Frankfort, KY 40601
|
- sq. feet
|
2 baths 3 beds |
show details | |

|
#44
Roscoe Ct
Frankfort, KY 40601
|
- sq. feet
|
2 baths 3 beds |
show details | |

|
#45
Fiesta Way
Frankfort, KY 40601
|
- sq. feet
|
1 baths 3 beds |
show details | |

|
#46
Creekstone Ct
Frankfort, KY 40601
|
- sq. feet
|
1 baths 3 beds |
show details | |

|
#47
Holly Berry Dr
Frankfort, KY 40601
|
- sq. feet
|
2 baths 3 beds |
show details | |

|
#48
Edgewood Dr
Frankfort, KY 40601
|
- sq. feet
|
1 baths 3 beds |
show details | |

|
#49
Dressage Ct
Frankfort, KY 40601
|
- sq. feet
|
2 baths 3 beds |
show details | |

|
Check over 1 million property listings on Foreclosure.com!
|
browse all offers | |||

Household type by relationship:
Households: 40,378- In family households: 35,309 (8,205 male householders, 3,102 female householders)
8,750 spouses, 11,790 children (10,762 natural, 335 adopted, 693 stepchildren), 935 grandchildren, 324 brothers or sisters, 283 parents, foster children, 542 other relatives, 1,127 non-relatives
- In nonfamily households: 5,069 (1,825 male householders (1,390 living alone)), 2,189 female householders (1,851 living alone)), 1,055 nonrelatives
- In group quarters: 1,696 (1,294 institutionalized population)
5,908 married couples with children.
1,612 single-parent households (370 men, 1,242 women).
98.1% of residents of Harrisonville speak English at home.
1.5% of residents speak Spanish at home (65% speak English very well, 22% speak English well, 13% speak English not well).
0.2% of residents speak other Indo-European language at home (100% speak English well).
0.2% of residents speak other language at home (100% speak English very well).
Foreign born population: 12 (0.3%)
(100.0% of them are naturalized citizens)
| Here: | 7.7 |
| State: | 6.4 |
| Here: | 6.2 |
| State: | 4.4 |

- Bedrooms in owner-occupied houses and condos in Harrisonville, Kentucky
- 0no bedroom
- 291 bedroom
- 1672 bedrooms
- 9093 bedrooms
- 2184 bedrooms
- 305+ bedrooms

- Bedrooms in renter-occupied apartments in Harrisonville, Kentucky
- 0no bedroom
- 311 bedroom
- 612 bedrooms
- 913 bedrooms
- 464 bedrooms
- 05+ bedrooms

- Cars and other vehicles available in Harrisonville in owner-occupied houses/condos
- 47no vehicle
- 1961 vehicle
- 6322 vehicles
- 3063 vehicles
- 1334 vehicles
- 395+ vehicles

- Cars and other vehicles available in Harrisonville in renter-occupied apartments
- 0no vehicle
- 981 vehicle
- 872 vehicles
- 353 vehicles
- 94 vehicles
- 05+ vehicles

- Rooms in owner-occupied houses in Harrisonville, Kentucky
- 01 room
- 02 rooms
- 153 rooms
- 1214 rooms
- 2685 rooms
- 3576 rooms
- 2817 rooms
- 2258 rooms
- 869+ rooms

- Rooms in renter-occupied apartments in Harrisonville, Kentucky
- 01 room
- 102 rooms
- 93 rooms
- 364 rooms
- 475 rooms
- 556 rooms
- 537 rooms
- 198 rooms
- 09+ rooms


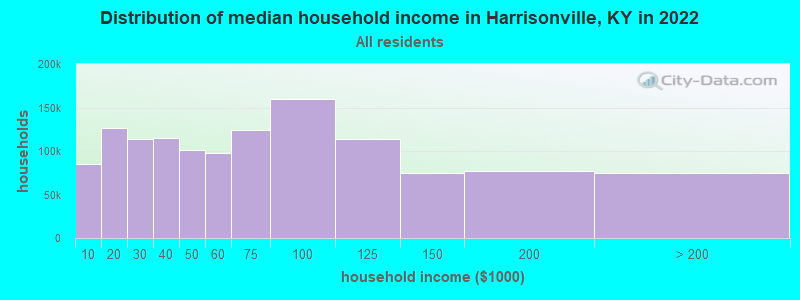
Harrisonville, KY household income distribution

- 74,157Less than $10,000
- 120,313$10,000 to $19,999
- 101,381$20,000 to $29,999
- 107,411$30,000 to $39,999
- 82,080$40,000 to $49,999
- 90,178$50,000 to $59,999
- 103,453$60,000 to $74,999
- 143,373$75,000 to $99,999
- 102,456$100,000 to $124,999
- 62,865$125,000 to $149,999
- 62,306$150,000 to $199,999
- 53,561$200,000 or more
Percentage of workers working in this county: 51.4%
Number of people working at home: 200 (8.6% of all workers)
Travel time to work (commute)
- Less than 5 minutes: 63
- 5 to 9 minutes: 92
- 10 to 14 minutes: 127
- 15 to 19 minutes: 348
- 20 to 24 minutes: 450
- 25 to 29 minutes: 166
- 30 to 34 minutes: 386
- 35 to 39 minutes: 114
- 40 to 44 minutes: 120
- 45 to 59 minutes: 170
- 60 to 89 minutes: 48
- 90 or more minutes: 60
Means of transportation to work:
- Drove a car alone: 1,816 (80.7%)
- Carpooled: 205 (9.1%)
- Bus or trolley bus: 29 (1.3%)
- Subway or elevated: 15 (0.7%)
- Railroad: 8 (0.4%)
- Ferryboat: 22 (1.0%)
- Taxi: 8 (0.4%)
- Walked: 41 (1.8%)
- Worked at home: 105 (4.7%)


- Year of entry for the foreign-born population in Harrisonville, Kentucky
- 01995 to March 2000
- 01990 to 1994
- 01985 to 1989
- 71980 to 1984
- 01975 to 1979
- 01970 to 1974
- 01965 to 1969
- 0Before 1965
Most common places of birth for foreign-born residents (%):
| Harrisonville: | 100.0% (7) |
| Kentucky: | 0.2% (195) |
Place of birth for U.S.-born residents:
- This state: 3,610
- Other state: 598
- Northeast: 26
- Midwest: 379
- South: 140
- West: 53
59% of Harrisonville residents lived in the same house 5 years ago.
Out of people who lived in different houses, 52% lived in this county.
Out of people who lived in different counties, 69% lived in Kentucky.
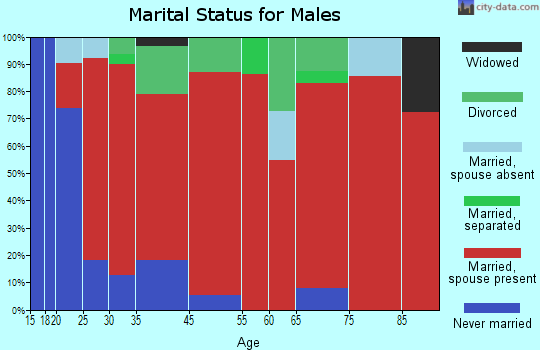
Education attainment for males 25 years and older:
- No schooling: 0
- Nursery to 4th grade: 0
- 5th and 6th grade: 34
- 7th and 8th grade: 97
- 9th grade: 35
- 10th grade: 51
- 11th grade: 44
- 12th grade, no diploma: 73
- High school graduate (or equivalency): 551
- Less than 1 year of college: 72
- Some college more than 1 year, no degree: 175
- Associate degree: 53
- Bachelor's degree: 127
- Master's degree: 67
- Professional school degree: 22
- Doctorate degree: 14

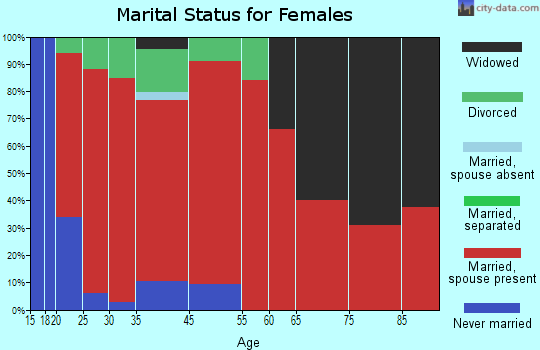
Education attainment for females 25 years and older:
- No schooling: 0
- Nursery to 4th grade: 0
- 5th and 6th grade: 6
- 7th and 8th grade: 51
- 9th grade: 30
- 10th grade: 75
- 11th grade: 50
- 12th grade, no diploma: 14
- High school graduate (or equivalency): 603
- Less than 1 year of college: 129
- Some college more than 1 year, no degree: 174
- Associate degree: 138
- Bachelor's degree: 85
- Master's degree: 73
- Professional school degree: 15
- Doctorate degree: 16

Housing units in structures:
- One, detached: 1,514
- One, attached: 15
- Two: 28
- Mobile homes: 127
Median worth of mobile homes: $148,823

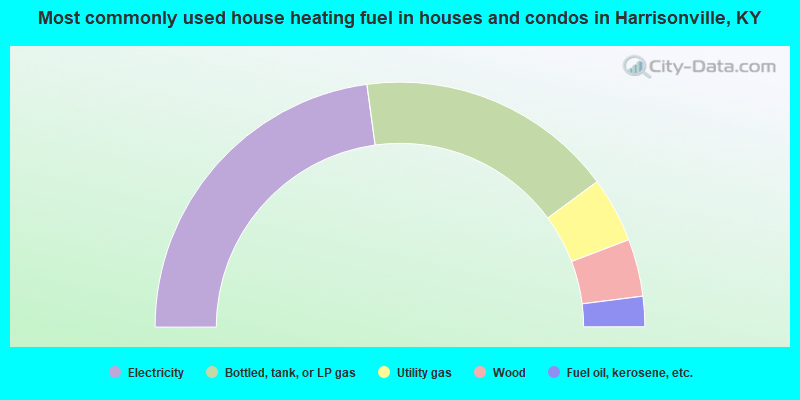
- 45.7%Electricity
- 34.1%Bottled, tank, or LP gas
- 8.6%Utility gas
- 7.6%Wood
- 4.0%Fuel oil, kerosene, etc.
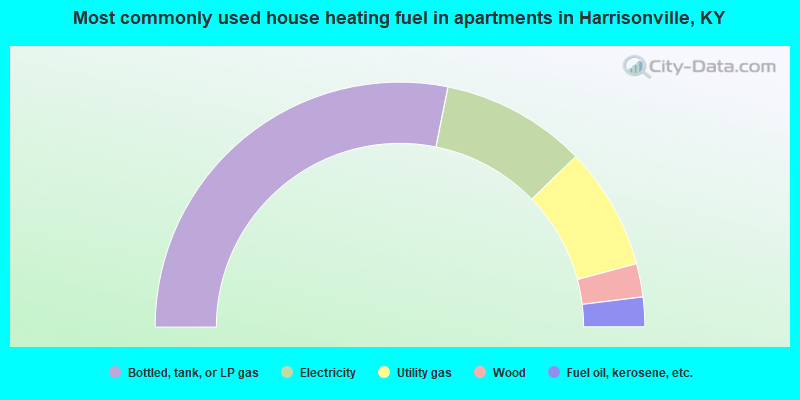
- 56.3%Bottled, tank, or LP gas
- 19.2%Electricity
- 16.2%Utility gas
- 4.4%Wood
- 3.9%Fuel oil, kerosene, etc.
Private vs. public school enrollment:
| Here: | 12.8% |
| Kentucky: | 11.9% |
| Here: | 6.9% |
| Kentucky: | 10.6% |
| Here: | 13.0% |
| Kentucky: | 18.1% |


