Hartsburg, IL (Illinois) Houses and Residents
| Hartsburg: | $77,448 |
| Illinois: | $251,600 |
Mean price in 2022:
Detached houses: $93,664
Here: $93,664 State: $310,164
Total population: 311 (Urban population: 0, Rural population: 378 (all nonfarm))
Houses: 198 (184 occupied: 135 owner occupied, 51 renter occupied)
| % of renters here: | 27% |
| State: | 33% |
Housing density: 1,364 houses/condos per square mile
Median price asked for vacant for-sale houses and condos in 2022: $37,661.
Median contract rent in 2022: $661 (lower quartile is $558, upper quartile is $691)
Median rent asked for vacant for-rent units in 2022: $740
Median gross rent in Hartsburg, IL in 2022: $920
Housing units in Hartsburg with a mortgage: 75 (4 second mortgage, 0 home equity loan, 4 both second mortgage and home equity loan)
Houses without a mortgage: 0
Median household income for houses/condos with a mortgage: $76,067
Median household income for apartments without a mortgage: $47,647
Median monthly housing costs: $812
Compare current foreclosures near Hartsburg, IL:
| Photo | Address | Area | Beds / Baths | Price | Details |
|---|---|---|---|---|---|

|
#1
N Main St
Lincoln, IL 62656
|
784 sq. feet
|
1 baths 2 beds |
$113,000
|
show details |

|
#2
N Maltby St
Waynesville, IL 61778
|
1,136 sq. feet
|
1 baths 3 beds |
show details | |

|
#3
N Anson St
Middletown, IL 62666
|
3,114 sq. feet
|
2 baths 3 beds |
show details | |

|
#4
N Verry St
Armington, IL 61721
|
1,344 sq. feet
|
1 baths 3 beds |
show details | |

|
#5
E 10th St
Delavan, IL 61734
|
1,040 sq. feet
|
1 baths 3 beds |
show details | |

|
#6
1500th St
Lincoln, IL 62656
|
- sq. feet
|
1 baths 2 beds |
show details | |

|
#7
W 5th St
Delavan, IL 61734
|
- sq. feet
|
- baths - beds |
$57,500
|
show details |

|
#8
E Pine St
Mason City, IL 62664
|
3,960 sq. feet
|
3 baths 4 beds |
show details | |

|
#9
N Minier Ave
Minier, IL 61759
|
1,168 sq. feet
|
1 baths 2 beds |
show details | |

|
#10
Hickory Rd
Tremont, IL 61568
|
2,054 sq. feet
|
2 baths 3 beds |
show details |
| Photo | Address | Area | Beds / Baths | Price | Details |
|---|---|---|---|---|---|

|
#11
N Keefer St
Mason City, IL 62664
|
- sq. feet
|
2 baths 2 beds |
show details | |

|
#12
North St
Armington, IL 61721
|
1,120 sq. feet
|
1 baths 3 beds |
show details | |

|
#13
S Catherine St
Atlanta, IL 61723
|
- sq. feet
|
2 baths 3 beds |
show details | |

|
#14
W Franklin St
Mc Lean, IL 61754
|
1,188 sq. feet
|
2 baths - beds |
show details | |

|
#15
Arrow Rd
Tremont, IL 61568
|
1,352 sq. feet
|
1 baths 3 beds |
show details | |

|
#16
S Monroe St
Armington, IL 61721
|
1,075 sq. feet
|
1 baths 3 beds |
show details | |

|
#17
East St
Mc Lean, IL 61754
|
868 sq. feet
|
1 baths - beds |
show details | |

|
#18
N Main St
Mason City, IL 62664
|
- sq. feet
|
- baths - beds |
show details | |

|
#19
W Arch St
Mason City, IL 62664
|
- sq. feet
|
- baths - beds |
show details | |

|
#20
Hopedale Rd
Hopedale, IL 61747
|
- sq. feet
|
- baths - beds |
show details |
| Photo | Address | Area | Beds / Baths | Price | Details |
|---|---|---|---|---|---|

|
#21
SW 5th St
Atlanta, IL 61723
|
- sq. feet
|
- baths - beds |
show details | |

|
#22
E 4th St
Delavan, IL 61734
|
- sq. feet
|
- baths - beds |
show details | |

|
#23
1275th Ave
Armington, IL 61721
|
- sq. feet
|
- baths - beds |
show details | |

|
#24
Lincoln St
Emden, IL 62635
|
- sq. feet
|
- baths - beds |
show details | |

|
#25
S Hamilton St
Lincoln, IL 62656
|
- sq. feet
|
- baths - beds |
show details | |

|
#26
Wichita Ave
Lincoln, IL 62656
|
- sq. feet
|
- baths - beds |
show details | |

|
#27
8th St
Lincoln, IL 62656
|
- sq. feet
|
- baths - beds |
show details | |

|
#28
Pekin St
Lincoln, IL 62656
|
- sq. feet
|
- baths - beds |
show details | |

|
#29
N Tonica St
Mason City, IL 62664
|
- sq. feet
|
- baths - beds |
show details | |

|
#30
15th St
Lincoln, IL 62656
|
- sq. feet
|
- baths - beds |
show details |
| Photo | Address | Area | Beds / Baths | Price | Details |
|---|---|---|---|---|---|

|
#31
N Union St
Lincoln, IL 62656
|
- sq. feet
|
- baths - beds |
show details | |

|
#32
11th St
Lincoln, IL 62656
|
- sq. feet
|
- baths - beds |
show details | |

|
#33
Broadway St
Beason, IL 62512
|
- sq. feet
|
- baths - beds |
show details | |

|
#34
N Ottawa St
Lincoln, IL 62656
|
- sq. feet
|
- baths - beds |
show details | |

|
#35
N Kankakee St
Lincoln, IL 62656
|
- sq. feet
|
- baths - beds |
show details | |

|
#36
W Elm St
Mason City, IL 62664
|
- sq. feet
|
- baths - beds |
show details | |

|
#37
S Jefferson St
Lincoln, IL 62656
|
- sq. feet
|
- baths - beds |
show details | |

|
#38
N Main St
Mason City, IL 62664
|
- sq. feet
|
- baths - beds |
show details | |

|
#39
4th St
Lincoln, IL 62656
|
- sq. feet
|
- baths - beds |
show details | |

|
#40
E Myrtle St
Mason City, IL 62664
|
- sq. feet
|
- baths - beds |
show details |
| Photo | Address | Area | Beds / Baths | Price | Details |
|---|---|---|---|---|---|

|
#41
Southgate St
Lincoln, IL 62656
|
- sq. feet
|
- baths - beds |
show details | |

|
#42
4th St
Lincoln, IL 62656
|
- sq. feet
|
- baths - beds |
show details | |

|
#43
Decatur St
Lincoln, IL 62656
|
- sq. feet
|
- baths - beds |
show details | |

|
#44
E High St
Mason City, IL 62664
|
- sq. feet
|
- baths - beds |
show details | |

|
#45
E Oak St
Elkhart, IL 62634
|
- sq. feet
|
- baths - beds |
show details | |

|
#46
S Martin St
Atlanta, IL 61723
|
- sq. feet
|
- baths - beds |
show details | |

|
#47
N Mclean St
Lincoln, IL 62656
|
- sq. feet
|
- baths - beds |
show details | |

|
#48
Omaha Ave
Lincoln, IL 62656
|
- sq. feet
|
- baths - beds |
show details | |

|
#49
NW Vine St
Atlanta, IL 61723
|
- sq. feet
|
- baths - beds |
show details | |

|
Check over 1 million property listings on Foreclosure.com!
|
browse all offers | |||

Latest news about housing in Hartsburg, IL collected exclusively by city-data.com from local newspapers, TV, and radio stations


Median year apartment built: 1972
Household type by relationship:
Households: 369- Male householders: 110 (20 living alone), Female householders: 71 (21 living alone)
54 spouses (54 opposite-sex spouses), 21 unmarried partners, (21 opposite-sex unmarried partners), 70 children (70 natural, 0 adopted, 0 stepchildren), 20 grandchildren, 0 brothers or sisters, 0 parents, 0 foster children, 20 other relatives, 0 non-relatives
Size of family households: 40 2-persons, 28 3-persons, 29 4-persons, 4 5-persons.
Size of nonfamily households: 44 1-person, 42 2-persons.
24 married couples with children.
12 single-parent households (5 men, 7 women).
98.8% of residents of Hartsburg speak English at home.
Foreign born population: 2 (0.5%)
(50.0% of them are naturalized citizens)
| Here: | 6.1 |
| State: | 6.4 |
| Here: | 4.2 |
| State: | 4.1 |

- Bedrooms in owner-occupied houses and condos in Hartsburg, Illinois
- 0no bedroom
- 01 bedroom
- 342 bedrooms
- 763 bedrooms
- 74 bedrooms
- 185+ bedrooms

- Bedrooms in renter-occupied apartments in Hartsburg, Illinois
- 0no bedroom
- 51 bedroom
- 392 bedrooms
- 53 bedrooms
- 34 bedrooms
- 05+ bedrooms

- Cars and other vehicles available in Hartsburg in owner-occupied houses/condos
- 4no vehicle
- 331 vehicle
- 332 vehicles
- 583 vehicles
- 84 vehicles
- 05+ vehicles

- Cars and other vehicles available in Hartsburg in renter-occupied apartments
- 5no vehicle
- 31 vehicle
- 442 vehicles
- 03 vehicles
- 04 vehicles
- 05+ vehicles

- Rooms in owner-occupied houses in Hartsburg, Illinois
- 01 room
- 02 rooms
- 03 rooms
- 164 rooms
- 115 rooms
- 666 rooms
- 147 rooms
- 38 rooms
- 249+ rooms

- Rooms in renter-occupied apartments in Hartsburg, Illinois
- 01 room
- 52 rooms
- 03 rooms
- 274 rooms
- 95 rooms
- 56 rooms
- 27 rooms
- 08 rooms
- 39+ rooms


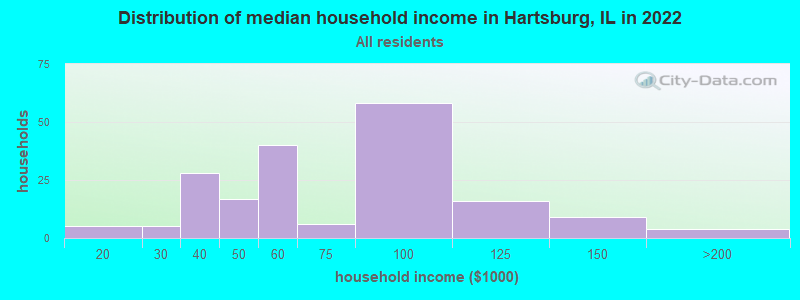
Hartsburg, IL household income distribution

- 5$10,000 to $19,999
- 5$20,000 to $29,999
- 28$30,000 to $39,999
- 17$40,000 to $49,999
- 40$50,000 to $59,999
- 6$60,000 to $74,999
- 58$75,000 to $99,999
- 16$100,000 to $124,999
- 9$125,000 to $149,999
- 4$150,000 to $199,999
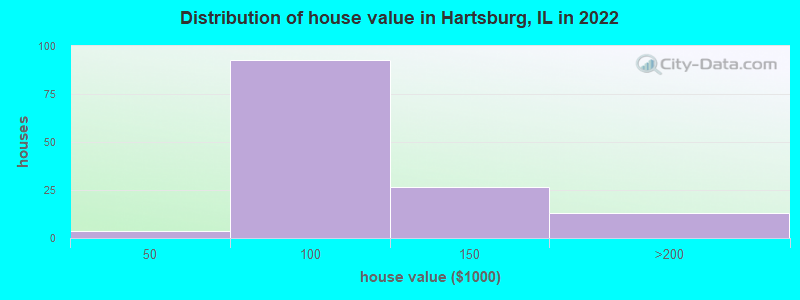
Home value of owner - occupied houses in 2022 in Hartsburg, IL
-
- 0$15,000 to $19,999
- 0$25,000 to $29,999
- 1$40,000 to $49,999
- 14$50,000 to $59,999
- 50$60,000 to $69,999
- 7$70,000 to $79,999
- 9$80,000 to $89,999
- 9$90,000 to $99,999
- 20$100,000 to $124,999
- 6$125,000 to $149,999
- 8$150,000 to $174,999
- 3$175,000 to $199,999
- 1$500,000 to $749,999
Rent paid by renters in 2022 in Hartsburg, IL
-
- 0$250 to $299
- 4$400 to $449
- 0$450 to $499
- 6$500 to $549
- 2$550 to $599
- 28$650 to $699
- 7$700 to $749
- 3No cash rent


Percentage of workers working in this county: 47.4%
Number of people working at home: 2 (0.9% of all workers)
Travel time to work (commute)
- Less than 5 minutes: 4
- 5 to 9 minutes: 1
- 10 to 14 minutes: 65
- 15 to 19 minutes: 32
- 20 to 24 minutes: 10
- 25 to 29 minutes: 2
- 30 to 34 minutes: 5
- 35 to 39 minutes: 6
- 40 to 44 minutes: 29
- 45 to 59 minutes: 36
- 60 to 89 minutes: 8
- 90 or more minutes: 0
Means of transportation to work:
- Drove a car alone: 148 (75.5%)
- Carpooled: 36 (18.4%)
- Walked: 12 (6.1%)

- Unemployment by race in 2022
- Unemployment rate for White non-Hispanic residents
- 3.5%Males
- 17.4%Females

First ancestries reported:
- German: 70 (36.7%)
- Irish: 45 (23.6%)
- American: 24 (12.6%)
- English: 7 (3.7%)
- European: 6 (3.1%)
- Swedish: 5 (2.6%)
Most common places of birth for foreign-born residents (%):
Place of birth for U.S.-born residents:
- This state: 342
- Other state: 23
- Northeast: 4
- Midwest: 8
- South: 7
- West: 4
97.2% of Hartsburg residents lived in the same house 1 years ago.
Out of people who lived in different houses, 28.6% lived in this county.
Out of people who lived in different counties, 0.0% lived in Illinois.
| Hartsburg: | 97.2% |
| State average: | 88.3% |
Education attainment for males 25 years and older:
- No schooling: 0
- Nursery to 4th grade: 0
- 5th and 6th grade: 0
- 7th and 8th grade: 1
- 9th grade: 0
- 10th grade: 0
- 11th grade: 0
- 12th grade, no diploma: 0
- High school graduate (or equivalency): 61
- Less than 1 year of college: 14
- Some college more than 1 year, no degree: 41
- Associate degree: 7
- Bachelor's degree: 15
- Master's degree: 0
- Professional school degree: 0
- Doctorate degree: 0

Education attainment for females 25 years and older:
- No schooling: 0
- Nursery to 4th grade: 0
- 5th and 6th grade: 0
- 7th and 8th grade: 0
- 9th grade: 1
- 10th grade: 0
- 11th grade: 0
- 12th grade, no diploma: 2
- High school graduate (or equivalency): 25
- Less than 1 year of college: 16
- Some college more than 1 year, no degree: 8
- Associate degree: 32
- Bachelor's degree: 18
- Master's degree: 1
- Professional school degree: 0
- Doctorate degree: 0


Housing units in structures:
- One, detached: 191
- 10 to 19: 7
Housing units lacking complete kitchen facilities in 2022: 6.6%
House/condo owner moved in on average 17 years ago
Renter moved in on average 1 years ago

Private vs. public school enrollment:
| Here: | 29.4% |
| Illinois: | 13.3% |
| Here: | 0.0% |
| Illinois: | 9.9% |
| Here: | 0.0% |
| Illinois: | 27.4% |


