Hawi, HI (Hawaii) Houses and Residents
| Hawi: | $714,212 |
| Hawaii: | $820,100 |
Mean price in 2022:
Detached houses: $542,458
Here: $542,458 State: $1,035,348 Townhouses or other attached units: $419,408
Here: $419,408 State: $976,474
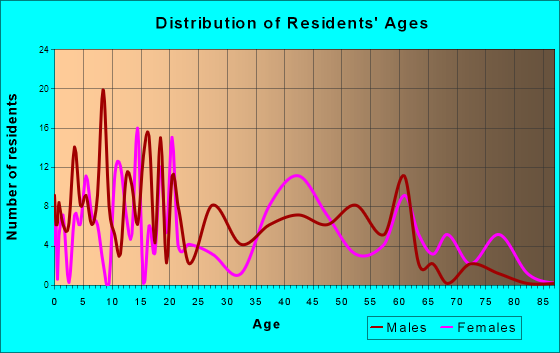
Total population: 1,081 (Urban population: 957 (all inside urban clusters), Rural population: 0)
Houses: 570 (463 occupied: 356 owner occupied, 112 renter occupied)
| % of renters here: | 24% |
| State: | 37% |
Housing density: 470 houses/condos per square mile
Median price asked for vacant for-sale houses and condos in 2022: $1,292,067.
Median contract rent in 2022: $1,174 (lower quartile is $1,111, upper quartile is $1,868)
Median rent asked for vacant for-rent units in 2022: $1,050
Median gross rent in Hawi, HI in 2022: $1,504
Housing units in Hawi with a mortgage: 172 (4 second mortgage, 0 home equity loan, 4 both second mortgage and home equity loan)
Houses without a mortgage: 11
Median household income for houses/condos with a mortgage: $102,835
Median household income for apartments without a mortgage: $69,032
Median monthly housing costs: $1,122
Compare current foreclosures near your location:
| Photo | Address | Area | Beds / Baths | Price | Details |
|---|---|---|---|---|---|

|
#1
E 21st Ave
Columbus, OH 43211
|
1,061 sq. feet
|
1 baths 3 beds |
$187,900
|
show details |

|
#2
S High St
Columbus, OH 43207
|
1,678 sq. feet
|
2 baths 4 beds |
$31,900
|
show details |

|
#3
Bayberry Cir
Columbus, OH 43207
|
1,564 sq. feet
|
1 baths 3 beds |
$127,500
|
show details |

|
#4
Armada Rd
Columbus, OH 43232
|
1,028 sq. feet
|
1 baths 4 beds |
show details | |

|
#5
E Howard Rd
Columbus, OH 43207
|
1,056 sq. feet
|
1 baths 3 beds |
show details | |

|
#6
High Free Pike
West Jefferson, OH 43162
|
1,216 sq. feet
|
2 baths 4 beds |
show details | |

|
#7
S Richardson Ave
Columbus, OH 43204
|
1,520 sq. feet
|
2 baths 3 beds |
show details | |

|
#8
Summertree Ln
Westerville, OH 43081
|
2,496 sq. feet
|
2 baths 3 beds |
show details | |

|
#9
Mink St SW
Pataskala, OH 43062
|
1,442 sq. feet
|
1 baths 3 beds |
show details | |

|
#10
Marshrun Dr
Grove City, OH 43123
|
2,036 sq. feet
|
2 baths 4 beds |
show details |
| Photo | Address | Area | Beds / Baths | Price | Details |
|---|---|---|---|---|---|

|
#11
Lehner Rd
Columbus, OH 43224
|
1,628 sq. feet
|
2 baths 4 beds |
show details | |

|
#12
N Roys Ave
Columbus, OH 43204
|
1,248 sq. feet
|
2 baths 3 beds |
show details | |

|
#13
Fergus Rd
Grove City, OH 43123
|
3,312 sq. feet
|
2 baths 4 beds |
show details | |

|
#14
Meadowbrook Dr
Columbus, OH 43207
|
1,752 sq. feet
|
2 baths 4 beds |
show details | |

|
#15
Wrexham Ave
Columbus, OH 43223
|
1,235 sq. feet
|
1 baths 3 beds |
show details | |

|
#16
N 18th St
Columbus, OH 43203
|
1,690 sq. feet
|
1 baths 4 beds |
show details | |

|
#17
Bretton Pl
Columbus, OH 43211
|
1,056 sq. feet
|
1 baths 3 beds |
show details | |

|
#18
Midland Ave
Columbus, OH 43223
|
1,518 sq. feet
|
1 baths 2 beds |
show details | |

|
#19
Striebel Ct
Columbus, OH 43227
|
925 sq. feet
|
1 baths 3 beds |
show details | |

|
#20
Grasmere Ave
Columbus, OH 43211
|
720 sq. feet
|
1 baths 2 beds |
show details |
| Photo | Address | Area | Beds / Baths | Price | Details |
|---|---|---|---|---|---|

|
#21
Mayflower Blvd
Columbus, OH 43213
|
1,591 sq. feet
|
2 baths 4 beds |
show details | |

|
#22
S Hague Ave
Columbus, OH 43204
|
979 sq. feet
|
1 baths 2 beds |
show details | |

|
#23
E Welch Ave
Columbus, OH 43207
|
1,864 sq. feet
|
2 baths 4 beds |
show details | |

|
#24
Kingsglen Dr
Grove City, OH 43123
|
1,635 sq. feet
|
2 baths 4 beds |
show details | |

|
#25
Trotter Dr
Columbus, OH 43207
|
1,478 sq. feet
|
1 baths 3 beds |
show details | |

|
#26
N Wayne Ave
Columbus, OH 43204
|
947 sq. feet
|
1 baths 3 beds |
show details | |

|
#27
Falls Peak Ln
Delaware, OH 43015
|
1,352 sq. feet
|
2 baths 2 beds |
show details | |

|
#28
Hiawatha Park Dr
Columbus, OH 43211
|
1,278 sq. feet
|
1 baths 4 beds |
show details | |

|
#29
Derrer Rd -872
Columbus, OH 43204
|
1,667 sq. feet
|
2 baths 5 beds |
show details | |

|
#30
Rosewood Ct
Powell, OH 43065
|
2,801 sq. feet
|
3 baths 4 beds |
show details |
| Photo | Address | Area | Beds / Baths | Price | Details |
|---|---|---|---|---|---|

|
#31
Glenmate Ct
Columbus, OH 43223
|
1,050 sq. feet
|
1 baths 3 beds |
show details | |

|
#32
N Grener Ave
Columbus, OH 43228
|
1,120 sq. feet
|
1 baths 3 beds |
show details | |

|
#33
Elaine Rd
Columbus, OH 43213
|
764 sq. feet
|
1 baths 2 beds |
show details | |

|
#34
Bernadette Rd
Columbus, OH 43204
|
1,168 sq. feet
|
1 baths 3 beds |
show details | |

|
#35
Scottwood Rd
Columbus, OH 43227
|
1,008 sq. feet
|
1 baths 3 beds |
show details | |

|
#36
Sleeping Meadow Dr
New Albany, OH 43054
|
3,211 sq. feet
|
2 baths 4 beds |
show details | |

|
#37
Chester Rd
Columbus, OH 43221
|
3,300 sq. feet
|
4 baths 5 beds |
show details | |

|
#38
London Groveport Rd
Grove City, OH 43123
|
816 sq. feet
|
1 baths 2 beds |
show details | |

|
#39
Fahlander Dr N
Columbus, OH 43229
|
1,338 sq. feet
|
2 baths 3 beds |
show details | |

|
#40
Hildreth Ave
Columbus, OH 43203
|
1,798 sq. feet
|
2 baths 4 beds |
show details |
| Photo | Address | Area | Beds / Baths | Price | Details |
|---|---|---|---|---|---|

|
#41
Fairfield Ave
Columbus, OH 43203
|
984 sq. feet
|
1 baths 2 beds |
show details | |

|
#42
Edgeview Rd
Columbus, OH 43207
|
1,700 sq. feet
|
1 baths 4 beds |
show details | |

|
#43
Stoneybrook Blvd # 21a
Hilliard, OH 43026
|
1,231 sq. feet
|
2 baths 3 beds |
show details | |

|
#44
Brookstone Dr
Westerville, OH 43082
|
1,783 sq. feet
|
3 baths 3 beds |
show details | |

|
#45
Oreily Dr
Galloway, OH 43119
|
1,533 sq. feet
|
2 baths 3 beds |
show details | |

|
#46
Windy Hill Ln
Galloway, OH 43119
|
1,108 sq. feet
|
2 baths 3 beds |
show details | |

|
#47
Renford Ct
Powell, OH 43065
|
1,795 sq. feet
|
1 baths 3 beds |
show details | |

|
#48
Falene Pl
Galloway, OH 43119
|
1,178 sq. feet
|
1 baths 3 beds |
show details | |

|
#49
Windy Hill Ln
Galloway, OH 43119
|
1,350 sq. feet
|
2 baths 3 beds |
show details | |

|
Check over 1 million property listings on Foreclosure.com!
|
browse all offers | |||

Latest news about housing in Hawi, HI collected exclusively by city-data.com from local newspapers, TV, and radio stations

 | My Hawaii plan...any critiques/suggestions? (9 replies) |
Median year apartment built: 1981
Household type by relationship:
Households: 1,411- Male householders: 144 (25 living alone), Female householders: 319 (47 living alone)
212 spouses (212 opposite-sex spouses), 90 unmarried partners, (90 opposite-sex unmarried partners), 305 children (305 natural, 0 adopted, 0 stepchildren), 77 grandchildren, 114 brothers or sisters, 10 parents, 0 foster children, 61 other relatives, 75 non-relatives
Size of family households: 152 2-persons, 67 3-persons, 56 4-persons, 6 5-persons, 21 7-or-more-persons.
Size of nonfamily households: 78 1-person, 79 2-persons.
106 married couples with children.
29 single-parent households (0 men, 29 women).
57.4% of residents of Hawi speak English at home.
6.6% of residents speak Spanish at home (100% speak English very well).
2.1% of residents speak other Indo-European language at home (100% speak English very well).
26.3% of residents speak Asian or Pacific Island language at home (80% speak English very well, 16% speak English well, 3% speak English not well).
6.5% of residents speak other language at home (100% speak English very well).
Foreign born population: 159 (11.3%)
(84.3% of them are naturalized citizens)
| Here: | 5.1 |
| State: | 5.5 |
| Here: | 4.3 |
| State: | 3.9 |

- Bedrooms in owner-occupied houses and condos in Hawi, Hawaii
- 0no bedroom
- 71 bedroom
- 932 bedrooms
- 1963 bedrooms
- 404 bedrooms
- 215+ bedrooms

- Bedrooms in renter-occupied apartments in Hawi, Hawaii
- 9no bedroom
- 01 bedroom
- 582 bedrooms
- 363 bedrooms
- 94 bedrooms
- 05+ bedrooms

- Cars and other vehicles available in Hawi in owner-occupied houses/condos
- 0no vehicle
- 1001 vehicle
- 1152 vehicles
- 1033 vehicles
- 174 vehicles
- 235+ vehicles

- Cars and other vehicles available in Hawi in renter-occupied apartments
- 0no vehicle
- 561 vehicle
- 352 vehicles
- 223 vehicles
- 04 vehicles
- 05+ vehicles

- Rooms in owner-occupied houses in Hawi, Hawaii
- 01 room
- 72 rooms
- 63 rooms
- 744 rooms
- 1545 rooms
- 766 rooms
- 197 rooms
- 118 rooms
- 99+ rooms

- Rooms in renter-occupied apartments in Hawi, Hawaii
- 91 room
- 02 rooms
- 93 rooms
- 534 rooms
- 05 rooms
- 256 rooms
- 177 rooms
- 08 rooms
- 09+ rooms


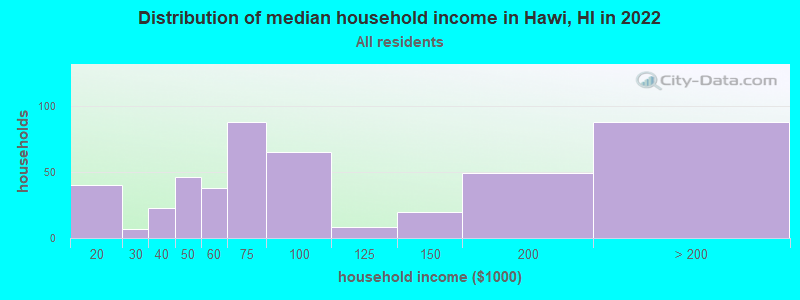
Hawi, HI household income distribution

- 40$10,000 to $19,999
- 7$20,000 to $29,999
- 23$30,000 to $39,999
- 46$40,000 to $49,999
- 38$50,000 to $59,999
- 88$60,000 to $74,999
- 65$75,000 to $99,999
- 8$100,000 to $124,999
- 20$125,000 to $149,999
- 49$150,000 to $199,999
- 88$200,000 or more
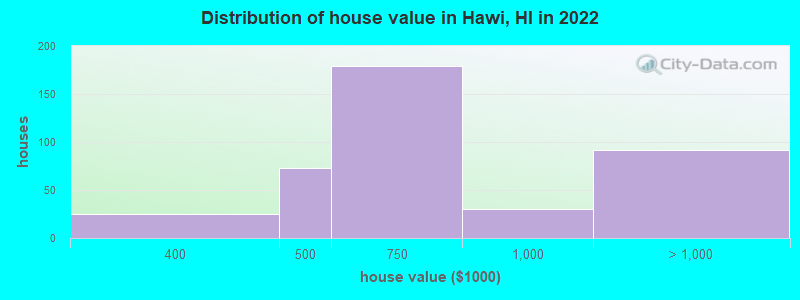
Home value of owner - occupied houses in 2022 in Hawi, HI
-
- 24$300,000 to $399,999
- 72$400,000 to $499,999
- 179$500,000 to $749,999
- 30$750,000 to $999,999
- 76$1,000,000 to $1,499,999
- 14$2,000,000 or more
Rent paid by renters in 2022 in Hawi, HI
-
- 46$1,000 to $1,249
- 14$1,500 to $1,999
- 21$2,000 to $2,499
- 38No cash rent


Percentage of workers working in this county: 100.0%
Number of people working at home: 75 (13.3% of all workers)
Travel time to work (commute)
- Less than 5 minutes: 0
- 5 to 9 minutes: 100
- 10 to 14 minutes: 104
- 15 to 19 minutes: 30
- 20 to 24 minutes: 0
- 25 to 29 minutes: 0
- 30 to 34 minutes: 110
- 35 to 39 minutes: 14
- 40 to 44 minutes: 21
- 45 to 59 minutes: 78
- 60 to 89 minutes: 34
- 90 or more minutes: 0
Means of transportation to work:
- Drove a car alone: 339 (75.8%)
- Carpooled: 70 (15.7%)
- Bus or trolley bus: 5 (1.1%)
- Walked: 11 (2.5%)
- Other means: 4 (0.9%)
- Worked at home: 18 (4.0%)

- Unemployment by race in 2022
- Unemployment rate for White non-Hispanic residents
- 20.4%Males
- Unemployment rate for Asian residents
- 37.9%Females
- Unemployment rate for two or more race residents
- 4.8%Males
- Unemployment rate for Hispanic or Latino residents
- 41.9%Females

- Year of entry for the foreign-born population in Hawi, Hawaii
- 272010 or later
- 72000 to 2009
- 511990 to 1999
- 261980 to 1989
- 151970 to 1979
- 17Before 1970

First ancestries reported:
- European: 58 (12.1%)
- Portuguese: 22 (4.6%)
- Slovak: 18 (3.7%)
- Irish: 7 (1.5%)
Most common places of birth for foreign-born residents (%):
| Hawi: | 43.1% (72) |
| Hawaii: | 44.3% (115,679) |
| Hawi: | 16.8% (28) |
| Hawaii: | 4.0% (10,430) |
| Hawi: | 16.8% (28) |
| Hawaii: | 1.8% (4,635) |
| Hawi: | 13.2% (22) |
| Hawaii: | 0.1% (314) |
| Hawi: | 9.0% (15) |
| Hawaii: | 1.6% (4,291) |
Place of birth for U.S.-born residents:
- This state: 811
- Other state: 381
- Northeast: 55
- Midwest: 0
- South: 63
- West: 243
94.9% of Hawi residents lived in the same house 1 years ago.
Out of people who lived in different houses, 49.6% lived in this county.
| Hawi: | 94.9% |
| State average: | 87.8% |
Education attainment for males 25 years and older:
- No schooling: 0
- Nursery to 4th grade: 0
- 5th and 6th grade: 20
- 7th and 8th grade: 0
- 9th grade: 0
- 10th grade: 0
- 11th grade: 10
- 12th grade, no diploma: 0
- High school graduate (or equivalency): 243
- Less than 1 year of college: 0
- Some college more than 1 year, no degree: 44
- Associate degree: 41
- Bachelor's degree: 49
- Master's degree: 64
- Professional school degree: 11
- Doctorate degree: 11

Education attainment for females 25 years and older:
- No schooling: 0
- Nursery to 4th grade: 0
- 5th and 6th grade: 4
- 7th and 8th grade: 16
- 9th grade: 0
- 10th grade: 0
- 11th grade: 0
- 12th grade, no diploma: 0
- High school graduate (or equivalency): 189
- Less than 1 year of college: 0
- Some college more than 1 year, no degree: 37
- Associate degree: 40
- Bachelor's degree: 150
- Master's degree: 77
- Professional school degree: 0
- Doctorate degree: 23

Housing units in structures:
- One, detached: 503
- Two: 14
- 3 or 4: 22
- 5 to 9: 9
- 10 to 19: 21
Housing units lacking complete kitchen facilities in 2022: 2.7%
House/condo owner moved in on average 20 years ago
Renter moved in on average 7 years ago

Private vs. public school enrollment:
| Here: | 8.9% |
| Hawaii: | 21.6% |
| Here: | 0.0% |
| Hawaii: | 21.5% |


