Hazel Dell North, WA (Washington) Houses and Residents
| Hazel Dell North: | $512,231 |
| Washington: | $569,500 |
Total population: 11,103 (Urban population: 9,382, Rural population: 0)
Houses: 3,768 (3,562 occupied: 2,112 owner occupied, 1,450 renter occupied)
| % of renters here: | 41% |
| State: | 36% |
Housing density: 1,412 houses/condos per square mile
Median price asked for vacant for-sale houses and condos in 2022 in this county: $858,483.
Median contract rent in 2022: $1,395 (lower quartile is $1,173, upper quartile is $1,679)
Median rent asked for vacant for-rent units in 2022: $1,364
Median gross rent in Hazel Dell North, WA in 2022: $1,463
Housing units in Hazel Dell North with a mortgage: 1,454 (173 second mortgage, 170 home equity loan, 0 both second mortgage and home equity loan)
Houses without a mortgage: 275
Compare current foreclosures near Hazel Dell North, WA:
| Photo | Address | Area | Beds / Baths | Price | Details |
|---|---|---|---|---|---|

|
#1
SW 1st Ave Apt 2125
Portland, OR 97201
|
1,950 sq. feet
|
2 baths 3 beds |
$715,000
|
show details |

|
#2
SE 116th Ave
Portland, OR 97266
|
1,678 sq. feet
|
1 baths 4 beds |
$485,000
|
show details |

|
#3
North East Brazee St
Portland, OR 97220
|
1,578 sq. feet
|
2 baths 3 beds |
$350,000
|
show details |

|
#4
NE Irving St Apt 208
Portland, OR 97220
|
- sq. feet
|
1 baths 2 beds |
$135,900
|
show details |

|
#5
Rossiter Ln
Vancouver, WA 98661
|
1,519 sq. feet
|
3 baths 2 beds |
show details | |

|
#6
W 15th Ave
La Center, WA 98629
|
1,688 sq. feet
|
2 baths 3 beds |
show details | |

|
#7
N Rosa Parks Way # 201
Portland, OR 97217
|
561 sq. feet
|
1 baths 2 beds |
show details | |

|
#8
W Burnside Rd Unit 527
Portland, OR 97210
|
1,288 sq. feet
|
2 baths 2 beds |
show details | |

|
#9
SE 44th Ave Unit 301
Portland, OR 97215
|
1,280 sq. feet
|
2 baths 2 beds |
show details | |

|
#10
SW Derby St
Beaverton, OR 97005
|
1,073 sq. feet
|
2 baths 3 beds |
show details |
| Photo | Address | Area | Beds / Baths | Price | Details |
|---|---|---|---|---|---|

|
#11
Norris Rd
Vancouver, WA 98661
|
1,116 sq. feet
|
1 baths 3 beds |
show details | |

|
#12
NW Galaxy St
Camas, WA 98607
|
1,950 sq. feet
|
1 baths 3 beds |
show details | |

|
#13
NE 94th Ave
Portland, OR 97220
|
1,506 sq. feet
|
2 baths 3 beds |
show details | |

|
#14
SE Rainbow Ln
Portland, OR 97222
|
1,496 sq. feet
|
2 baths 4 beds |
show details | |

|
#15
E 24th St
Vancouver, WA 98661
|
720 sq. feet
|
1 baths 2 beds |
show details | |

|
#16
SE Stephens St
Portland, OR 97233
|
2,200 sq. feet
|
1 baths 3 beds |
show details | |

|
#17
7th St
Washougal, WA 98671
|
1,644 sq. feet
|
1 baths 4 beds |
show details | |

|
#18
SE Carlton St
Portland, OR 97206
|
1,488 sq. feet
|
1 baths 4 beds |
show details | |

|
#19
SE Liebe St
Portland, OR 97266
|
606 sq. feet
|
1 baths 2 beds |
show details | |

|
#20
N 10th St
Saint Helens, OR 97051
|
1,223 sq. feet
|
2 baths 3 beds |
show details |
| Photo | Address | Area | Beds / Baths | Price | Details |
|---|---|---|---|---|---|

|
#21
Ave
Washougal, WA 98671
|
2,808 sq. feet
|
3 baths 4 beds |
show details | |

|
#22
NE Holman St
Portland, OR 97218
|
1,272 sq. feet
|
2 baths 2 beds |
show details | |

|
#23
SE Bush St
Portland, OR 97236
|
2,212 sq. feet
|
1 baths 3 beds |
show details | |

|
#24
SW Mayo St
Portland, OR 97223
|
2,592 sq. feet
|
2 baths 3 beds |
show details | |

|
#25
NW 8th St
Battle Ground, WA 98604
|
2,466 sq. feet
|
3 baths 4 beds |
show details | |

|
#26
SE 151st Ave
Portland, OR 97233
|
912 sq. feet
|
1 baths 3 beds |
show details | |

|
#27
NW Brooks Rd
Portland, OR 97231
|
2,058 sq. feet
|
4 baths 4 beds |
show details | |

|
#28
SE Woodstock Blvd
Portland, OR 97206
|
514 sq. feet
|
1 baths 1 beds |
show details | |

|
#29
Ne133rd Ave
Vancouver, WA 98682
|
- sq. feet
|
2 baths 3 beds |
show details | |

|
#30
NE 32nd St
Vancouver, WA 98682
|
1,094 sq. feet
|
2 baths 3 beds |
show details |
| Photo | Address | Area | Beds / Baths | Price | Details |
|---|---|---|---|---|---|

|
#31
NE 97th St
Vancouver, WA 98682
|
1,432 sq. feet
|
1 baths 3 beds |
show details | |

|
#32
NE Larkspur Ln
Fairview, OR 97024
|
1,941 sq. feet
|
2 baths 3 beds |
show details | |

|
#33
NE Klickitat St
Portland, OR 97230
|
1,693 sq. feet
|
1 baths 3 beds |
show details | |

|
#34
Ne82nd Street
Vancouver, WA 98662
|
- sq. feet
|
1 baths 3 beds |
show details | |

|
#35
NE 16th St
Vancouver, WA 98664
|
- sq. feet
|
2 baths 3 beds |
show details | |

|
#36
NE 96th Ave
Vancouver, WA 98662
|
1,270 sq. feet
|
2 baths 3 beds |
show details | |

|
#37
SE Yamhill St
Portland, OR 97233
|
- sq. feet
|
2 baths 2 beds |
show details | |

|
#38
Ne22nd St
Vancouver, WA 98664
|
- sq. feet
|
2 baths 2 beds |
show details | |

|
#39
NW 10th St
Battle Ground, WA 98604
|
1,410 sq. feet
|
2 baths 3 beds |
show details | |

|
#40
NE 149th Pl
Portland, OR 97230
|
1,524 sq. feet
|
3 baths 3 beds |
show details |
| Photo | Address | Area | Beds / Baths | Price | Details |
|---|---|---|---|---|---|

|
#41
NE Liberty Ct
Portland, OR 97211
|
2,257 sq. feet
|
3 baths 3 beds |
show details | |

|
#42
NE 77th Ave
Vancouver, WA 98664
|
1,094 sq. feet
|
2 baths 2 beds |
show details | |

|
#43
SE 68th Ave
Portland, OR 97206
|
1,490 sq. feet
|
1 baths 2 beds |
show details | |

|
#44
SW Fradeen Ln
Portland, OR 97225
|
4,684 sq. feet
|
4 baths 3 beds |
show details | |

|
#45
SE Division St Unit 111
Portland, OR 97266
|
760 sq. feet
|
2 baths 2 beds |
show details | |

|
#46
NE 85th Cir
Vancouver, WA 98662
|
1,635 sq. feet
|
1 baths 3 beds |
show details | |

|
#47
NE 162nd Pl
Vancouver, WA 98684
|
1,240 sq. feet
|
2 baths 3 beds |
show details | |

|
#48
SE 103rd Ave
Portland, OR 97266
|
1,700 sq. feet
|
2 baths 4 beds |
show details | |

|
#49
SE 83rd Ave
Portland, OR 97216
|
1,510 sq. feet
|
1 baths 4 beds |
show details | |

|
Check over 1 million property listings on Foreclosure.com!
|
browse all offers | |||

 | I got sticker shock by Vancouver housing price (28 replies) |

Household type by relationship:
Households: 422,153- In family households: 360,563 (79,262 male householders, 31,410 female householders)
84,752 spouses, 131,505 children (121,185 natural, 3,296 adopted, 7,024 stepchildren), 7,226 grandchildren, 3,444 brothers or sisters, 3,549 parents, foster children, 4,498 other relatives, 12,056 non-relatives
- In nonfamily households: 61,590 (22,699 male householders (16,393 living alone)), 24,728 female householders (20,133 living alone)), 14,163 nonrelatives
- In group quarters: 3,210 (1,691 institutionalized population)
71,295 married couples with children.
20,273 single-parent households (5,325 men, 14,948 women).
84.5% of residents of Hazel Dell North speak English at home.
8.5% of residents speak Spanish at home (28% speak English very well, 12% speak English well, 40% speak English not well, 19% don't speak English at all).
4.1% of residents speak other Indo-European language at home (65% speak English very well, 3% speak English well, 25% speak English not well, 7% don't speak English at all).
2.1% of residents speak Asian or Pacific Island language at home (38% speak English very well, 50% speak English well, 12% speak English not well).
0.8% of residents speak other language at home (74% speak English very well, 26% speak English well).
Foreign born population: 2,069 (14.7%)
(32.6% of them are naturalized citizens)
| Here: | 6.4 |
| State: | 6.5 |
| Here: | 4.1 |
| State: | 3.9 |
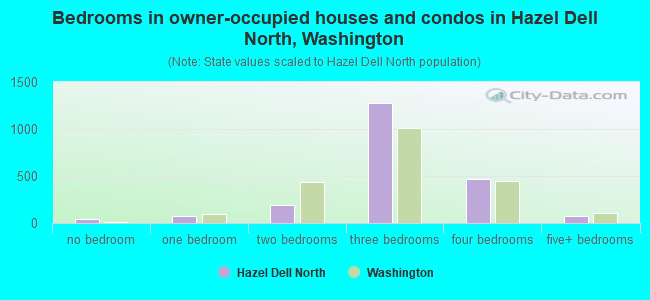
- Bedrooms in owner-occupied houses and condos in Hazel Dell North, Washington
- 38no bedroom
- 721 bedroom
- 1942 bedrooms
- 1,2753 bedrooms
- 4634 bedrooms
- 705+ bedrooms
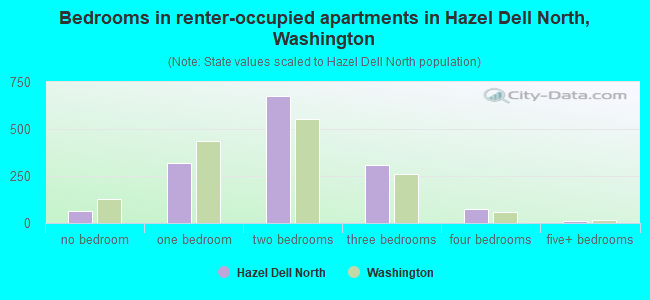
- Bedrooms in renter-occupied apartments in Hazel Dell North, Washington
- 65no bedroom
- 3201 bedroom
- 6732 bedrooms
- 3113 bedrooms
- 724 bedrooms
- 95+ bedrooms
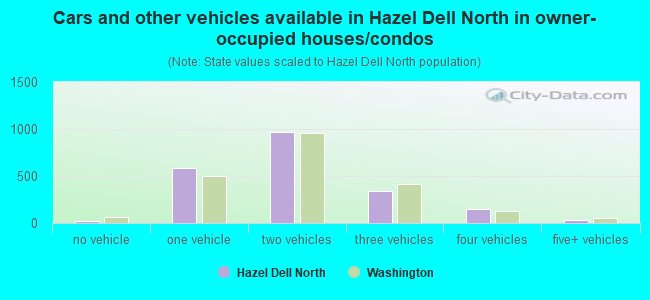
- Cars and other vehicles available in Hazel Dell North in owner-occupied houses/condos
- 26no vehicle
- 5901 vehicle
- 9722 vehicles
- 3433 vehicles
- 1524 vehicles
- 295+ vehicles
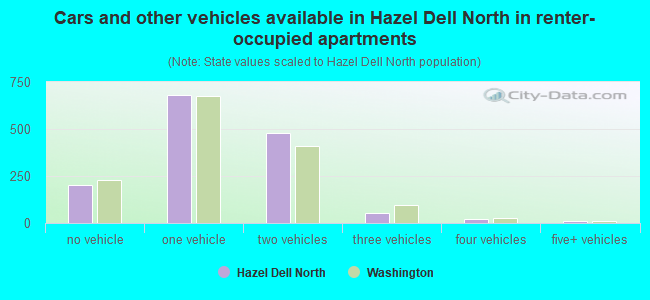
- Cars and other vehicles available in Hazel Dell North in renter-occupied apartments
- 203no vehicle
- 6831 vehicle
- 4812 vehicles
- 513 vehicles
- 214 vehicles
- 115+ vehicles
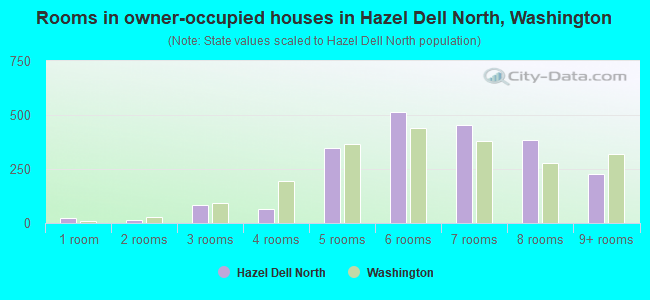
- Rooms in owner-occupied houses in Hazel Dell North, Washington
- 211 room
- 162 rooms
- 833 rooms
- 644 rooms
- 3495 rooms
- 5156 rooms
- 4527 rooms
- 3838 rooms
- 2299+ rooms
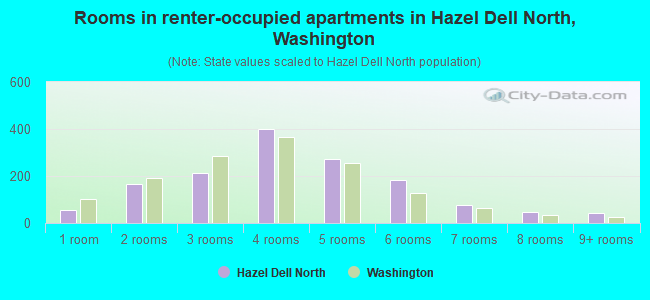
- Rooms in renter-occupied apartments in Hazel Dell North, Washington
- 551 room
- 1642 rooms
- 2143 rooms
- 3994 rooms
- 2725 rooms
- 1816 rooms
- 777 rooms
- 468 rooms
- 429+ rooms
Hazel Dell North, WA household income distribution

- 7,339Less than $10,000
- 6,747$10,000 to $19,999
- 7,341$20,000 to $29,999
- 11,118$30,000 to $39,999
- 10,319$40,000 to $49,999
- 10,103$50,000 to $59,999
- 16,507$60,000 to $74,999
- 27,624$75,000 to $99,999
- 22,063$100,000 to $124,999
- 15,113$125,000 to $149,999
- 18,891$150,000 to $199,999
- 23,445$200,000 or more
Percentage of workers working in this county: 72.1%
Number of people working at home: 1,327 (20.0% of all workers)
Travel time to work (commute)
- Less than 5 minutes: 86
- 5 to 9 minutes: 360
- 10 to 14 minutes: 570
- 15 to 19 minutes: 883
- 20 to 24 minutes: 831
- 25 to 29 minutes: 290
- 30 to 34 minutes: 442
- 35 to 39 minutes: 84
- 40 to 44 minutes: 156
- 45 to 59 minutes: 190
- 60 to 89 minutes: 146
- 90 or more minutes: 52
Means of transportation to work:
- Drove a car alone: 3,227 (75.8%)
- Carpooled: 582 (13.7%)
- Bus or trolley bus: 140 (3.3%)
- Subway or elevated: 23 (0.5%)
- Bicycle: 7 (0.2%)
- Walked: 93 (2.2%)
- Other means: 18 (0.4%)
- Worked at home: 167 (3.9%)
- Year of entry for the foreign-born population in Hazel Dell North, Washington
- 4951995 to March 2000
- 3261990 to 1994
- 1021985 to 1989
- 921980 to 1984
- 631975 to 1979
- 01970 to 1974
- 221965 to 1969
- 58Before 1965
First ancestries reported:
- Other: 2,594 (25.7%)
- German: 1,623 (16.1%)
- English: 1,139 (11.3%)
- Irish: 948 (9.4%)
- United States: 491 (4.9%)
- Dutch: 415 (4.1%)
- Norwegian: 387 (3.8%)
- Swedish: 339 (3.4%)
- French: 308 (3.1%)
- Scotch-Irish: 301 (3.0%)
- Scottish: 288 (2.9%)
- Italian: 279 (2.8%)
- Russian: 148 (1.5%)
- Ukrainian: 147 (1.5%)
- French Canadian: 136 (1.3%)
- Polish: 129 (1.3%)
- Danish: 99 (1.0%)
- Welsh: 76 (0.8%)
- Hungarian: 46 (0.5%)
- Czech: 41 (0.4%)
- Swiss: 41 (0.4%)
- Arab: 36 (0.4%)
- Lithuanian: 16 (0.2%)
- West Indian: 15 (0.1%)
- Portuguese: 11 (0.1%)
- Slovak: 10 (0.10%)
- Subsaharan African: 9 (0.09%)
- Greek: 6 (0.06%)
Most common places of birth for foreign-born residents (%):
| Hazel Dell North: | 54.4% (630) |
| Washington: | 24.1% (148,115) |
| Hazel Dell North: | 10.8% (125) |
| Washington: | 3.0% (18,572) |
| Hazel Dell North: | 9.2% (106) |
| Washington: | 2.5% (15,491) |
| Hazel Dell North: | 4.0% (46) |
| Washington: | 6.7% (40,879) |
| Hazel Dell North: | 3.8% (44) |
| Washington: | 6.2% (38,172) |
| Hazel Dell North: | 3.5% (41) |
| Washington: | 0.4% (2,755) |
| Hazel Dell North: | 2.4% (28) |
| Washington: | 3.3% (20,530) |
| Hazel Dell North: | 2.2% (25) |
| Washington: | 7.6% (46,733) |
| Hazel Dell North: | 2.0% (23) |
| Washington: | 7.7% (47,568) |
| Hazel Dell North: | 1.8% (21) |
| Washington: | 0.4% (2,213) |
Place of birth for U.S.-born residents:
- This state: 2,916
- Other state: 5,178
- Northeast: 168
- Midwest: 1,058
- South: 451
- West: 3,501
43% of Hazel Dell North residents lived in the same house 5 years ago.
Out of people who lived in different houses, 55% lived in this county.
Out of people who lived in different counties, 30% lived in Washington.
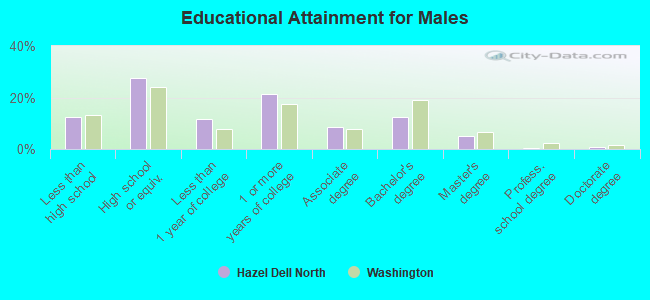
Education attainment for males 25 years and older:
- No schooling: 48
- Nursery to 4th grade: 8
- 5th and 6th grade: 46
- 7th and 8th grade: 40
- 9th grade: 20
- 10th grade: 50
- 11th grade: 58
- 12th grade, no diploma: 73
- High school graduate (or equivalency): 754
- Less than 1 year of college: 317
- Some college more than 1 year, no degree: 586
- Associate degree: 238
- Bachelor's degree: 339
- Master's degree: 136
- Professional school degree: 14
- Doctorate degree: 17
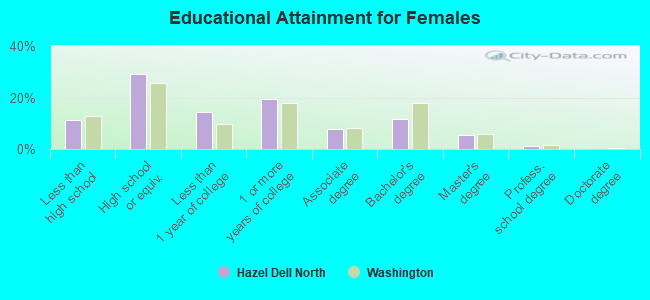
Education attainment for females 25 years and older:
- No schooling: 34
- Nursery to 4th grade: 9
- 5th and 6th grade: 45
- 7th and 8th grade: 43
- 9th grade: 16
- 10th grade: 62
- 11th grade: 56
- 12th grade, no diploma: 81
- High school graduate (or equivalency): 891
- Less than 1 year of college: 437
- Some college more than 1 year, no degree: 587
- Associate degree: 231
- Bachelor's degree: 353
- Master's degree: 170
- Professional school degree: 32
- Doctorate degree: 0


Housing units in structures:
- One, detached: 2,192
- One, attached: 53
- Two: 116
- 3 or 4: 78
- 5 to 9: 154
- 10 to 19: 263
- 20 to 49: 156
- 50 or more: 480
- Mobile homes: 228
- Boats, RVs, vans, etc.: 48
Median worth of mobile homes: $167,631
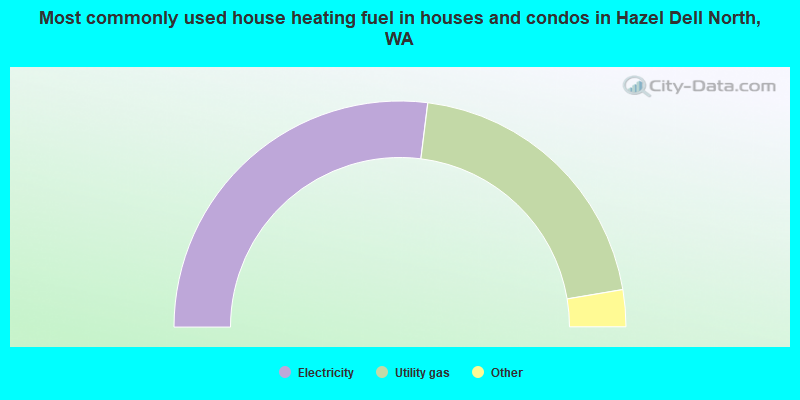
- 54.0%Electricity
- 40.8%Utility gas
- 2.6%Fuel oil, kerosene, etc.
- 1.5%Wood
- 1.2%Bottled, tank, or LP gas
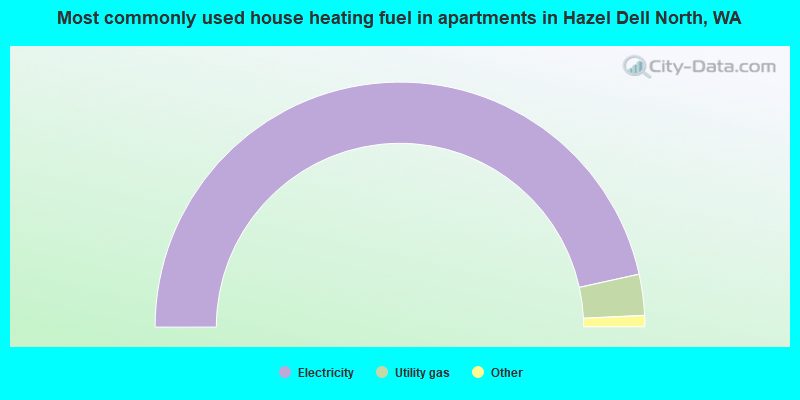
- 93.1%Electricity
- 5.4%Utility gas
- 0.9%Bottled, tank, or LP gas
- 0.6%Wood
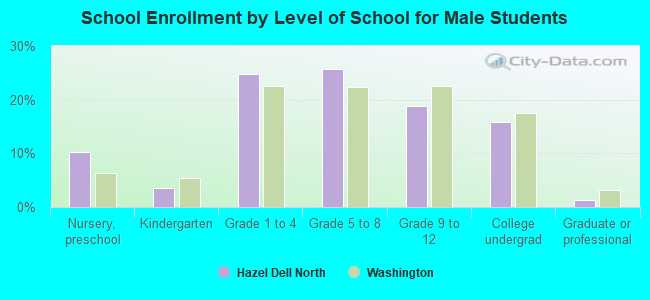
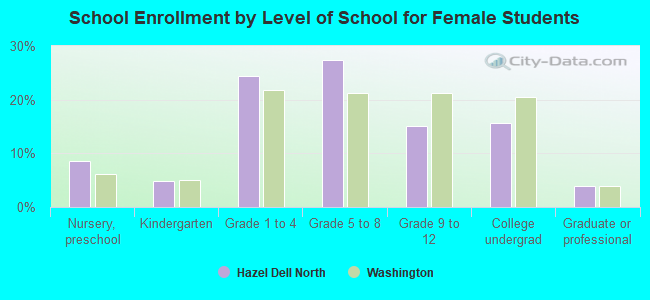
Private vs. public school enrollment:
| Here: | 6.2% |
| Washington: | 9.2% |
| Here: | 5.6% |
| Washington: | 7.0% |
| Here: | 13.1% |
| Washington: | 15.7% |