Hazleton, PA (Pennsylvania) Houses and Residents
Estimated median house or condo value in 2022: $133,209 (it was $67,400 in 2000 )
Hazleton:
$133,209Pennsylvania:
$245,500
Lower value quartile - upper value quartile: $83,142 - $189,399Mean price in 2022: Detached houses: $166,291 Here:
$166,291State:
$317,202
Townhouses or other attached units: $106,576 Here:
$106,576State:
$254,369
In 2-unit structures: $345,837 Here:
$345,837State:
$249,182
In 3-to-4-unit structures: $188,716 Here:
$188,716State:
$297,446
Mobile homes: $56,554 Here:
$56,554State:
$92,414
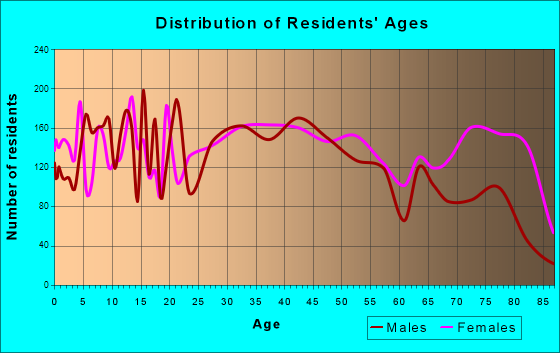
Total population: 24,932 (Urban population: 23,264, Rural population: 0)
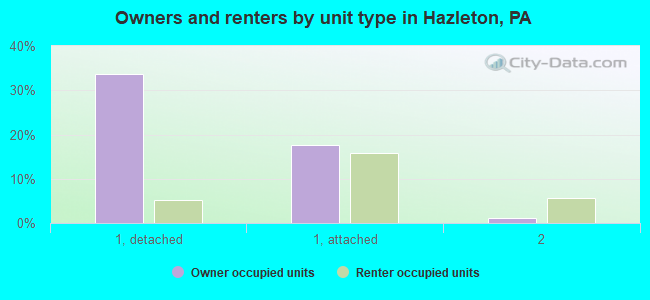
Houses: 12,490 (11,366 occupied: 5,352 owner occupied, 6,172 renter occupied )
% of renters here:
54%State:
31%
Housing density: 2,090 houses/condos per square mile
Median price asked for vacant for-sale houses and condos in 2022: $141,996.
Median contract rent in 2022: $812 (lower quartile is $652, upper quartile is $967)
Median rent asked for vacant for-rent units in 2022: $483
Median gross rent in Hazleton, PA in 2022: $1,023
Housing units in Hazleton with a mortgage: 2,562 (305 second mortgage, 0 home equity loan, 237 both second mortgage and home equity loan )Houses without a mortgage: 166
Median household income for houses/condos with a mortgage: $65,721
Median household income for apartments without a mortgage: $45,317
Median monthly housing costs: $940
Data:
Median house or condo value ($)
Median house or condo value ($ change since 2000)
Median house or condo value ($) - White
Median house or condo value ($) - Black or African American
Median house or condo value ($) - Asian
Median house or condo value ($) - Hispanic or Latino
Median house or condo value ($) - American Indian and Alaska Native
Median house or condo value ($) - Multirace
Median house or condo value ($) - Other Race
Median price asked for mobile homes ($)
Household density (households per square mile)
Mean house or condo value by units in structure - 1, detached ($)
Mean house or condo value by units in structure - 1, attached ($)
Mean house or condo value by units in structure - 2 ($)
Mean house or condo value by units in structure by units in structure - 3 or 4 ($)
Mean house or condo value by units in structure - 5 or more ($)
Mean house or condo value by units in structure - Boat, RV, van, etc. ($)
Mean house or condo value by units in structure - Mobile home ($)
Median contract rent ($)
Median contract rent - Lower quartile ($)
Median contract rent - Upper quartile ($)
Median gross rent ($)
Urban houses (%)
Rural houses (%)
Houses occupied (%)
Houses occupied (% change since 2000)
Houses owner occupied (%)
Houses owner occupied (% change since 2000)
Houses renter occupied (%)
Houses renter occupied (% change since 2000)
Vacant housing units - For rent (%)
Vacant housing units - For rent (% change since 2000)
Vacant housing units - For sale only (%)
Vacant housing units - For sale only (% change since 2000)
Vacant housing units - Rented or sold, not occupied (%)
Vacant housing units - Rented or sold, not occupied (% change since 2000)
Vacant housing units - For seasonal, recreational, or occasional use (%)
Vacant housing units - For seasonal, recreational, or occasional use (% change since 2000)
Vacant housing units - For migrant workers (%)
Vacant housing units - For migrant workers (% change since 2000)
Vacant housing units - Other vacant (%)
Vacant housing units - Other vacant (% change since 2000)
Median monthly housing costs ($)
Median household income for houses/condos with a mortgage ($)
Median household income for houses/condos without a mortgage ($)
Median household income ($)
Median household income ($) - White
Median household income ($) - Black or African American
Median household income ($) - Asian
Median household income ($) - Hispanic or Latino
Median household income ($) - American Indian and Alaska Native
Median household income ($) - Multirace
Median household income ($) - Other Race
Mortgage status - with mortgage (%)
Mortgage status - with second mortgage (%)
Mortgage status - with home equity loan (%)
Mortgage status - with both second mortgage and home equity loan (%)
Mortgage status - without a mortgage (%)
Median year house/condo built
Median year apartment built
Household type by relationship - Male householder living alone (%)
Household type by relationship - Male householder not living alone (%)
Household type by relationship - Female householder living alone (%)
Household type by relationship - Female householder not living alone (%)
Household type by relationship - Opposite-Sex spouse (%)
Household type by relationship - Same-Sex spouse (%)
Household type by relationship - Opposite-Sex unmarried partner (%)
Household type by relationship - Same-Sex unmarried partner (%)
Household type by relationship - In group quarters (%)
Size of family households - 2-person household (%)
Size of family households - 3-person household (%)
Size of family households - 4-person household (%)
Size of family households - 5-person household (%)
Size of family households - 6-person household (%)
Size of family households - 7-or-more-person household (%)
Size of nonfamily households - 1-person household (%)
Size of nonfamily households - 2-person household (%)
Size of nonfamily households - 3-person household (%)
Size of nonfamily households - 4-person household (%)
Size of nonfamily households - 5-person household (%)
Size of nonfamily households - 6-person household (%)
Size of nonfamily households - 7-or-moreperson household (%)
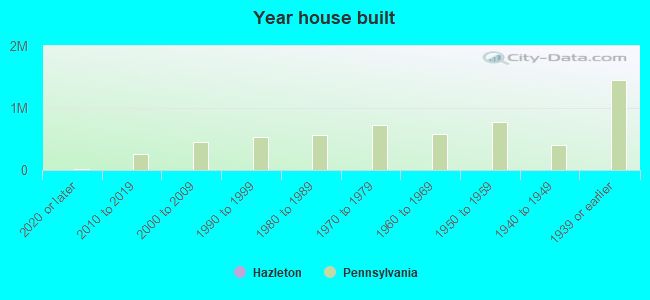
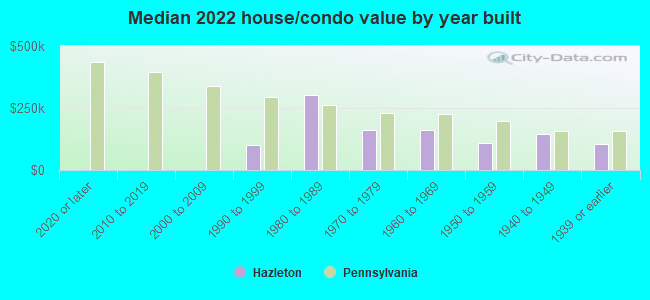
Year house built - Built 2010 or later (%)
Year house built - Built 2000 to 2009 (%)
Year house built - Built 1990 to 1999 (%)
Year house built - Built 1980 to 1989 (%)
Year house built - Built 1970 to 1979 (%)
Year house built - Built 1960 to 1969 (%)
Year house built - Built 1950 to 1959 (%)
Year house built - Built 1940 to 1949 (%)
Year house built - Built 1939 or earlier (%)
Median number of rooms in houses and condos
Median number of rooms in apartments
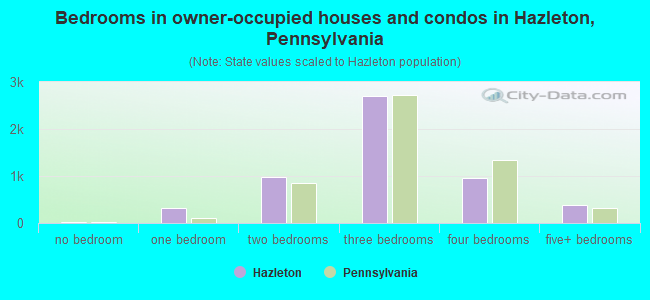
Median number of bedrooms in owner occupied houses
Mean number of bedrooms in owner occupied houses
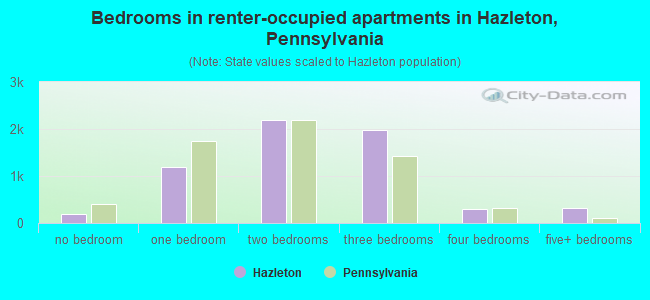
Median number of bedrooms in renter occupied houses
Mean number of bedrooms in renter occupied houses
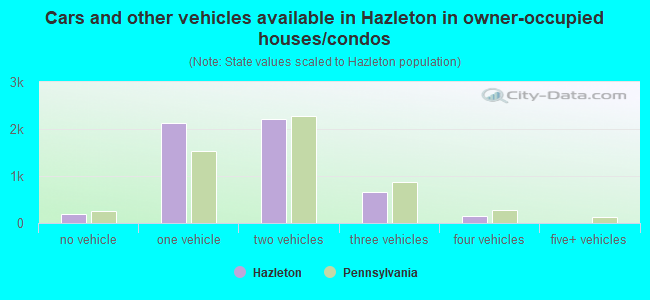
Median number of vehichles in owner occupied houses
Mean number of vehichles in owner occupied houses
Median number of vehichles in renter occupied houses
Mean number of vehichles in renter occupied houses
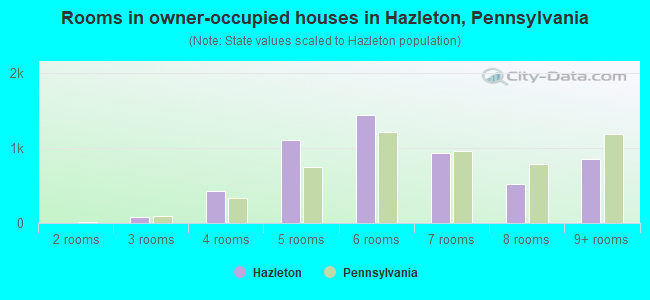
Rooms in owner-occupied houses - 1 room (%)
Rooms in owner-occupied houses - 2 rooms (%)
Rooms in owner-occupied houses - 3 rooms (%)
Rooms in owner-occupied houses - 4 rooms (%)
Rooms in owner-occupied houses - 5 rooms (%)
Rooms in owner-occupied houses - 6 rooms (%)
Rooms in owner-occupied houses - 7 rooms (%)
Rooms in owner-occupied houses - 8 rooms (%)
Rooms in owner-occupied houses - 9+ rooms (%)
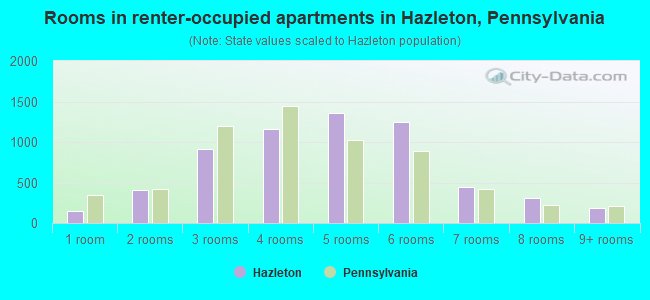
Rooms in renter-occupied houses - 1 room (%)
Rooms in renter-occupied houses - 2 rooms (%)
Rooms in renter-occupied houses - 3 rooms (%)
Rooms in renter-occupied houses - 4 rooms (%)
Rooms in renter-occupied houses - 5 rooms (%)
Rooms in renter-occupied houses - 6 rooms (%)
Rooms in renter-occupied houses - 7 rooms (%)
Rooms in renter-occupied houses - 8 rooms (%)
Rooms in renter-occupied houses - 9+ rooms (%)
Bedrooms in owner-occupied houses - no bedrooms (%)
Bedrooms in owner-occupied houses - 1 bedroom (%)
Bedrooms in owner-occupied houses - 2 bedrooms (%)
Bedrooms in owner-occupied houses - 3 bedrooms (%)
Bedrooms in owner-occupied houses - 4 bedrooms (%)
Bedrooms in owner-occupied houses - 5+ bedrooms (%)
Bedrooms in renter-occupied houses - no bedrooms (%)
Bedrooms in renter-occupied houses - 1 bedroom (%)
Bedrooms in renter-occupied houses - 2 bedrooms (%)
Bedrooms in renter-occupied houses - 3 bedrooms (%)
Bedrooms in renter-occupied houses - 4 bedrooms (%)
Bedrooms in renter-occupied houses - 5+ bedrooms (%)
Vehicles available in owner-occupied houses - no vehicle available (%)
Vehicles available in owner-occupied houses - 1 vehicle available(%)
Vehicles available in owner-occupied houses - 2 Vehicles available (%)
Vehicles available in owner-occupied houses - 3 Vehicles available (%)
Vehicles available in owner-occupied houses - 4 Vehicles available (%)
Vehicles available in owner-occupied houses - 5+ Vehicles available (%)
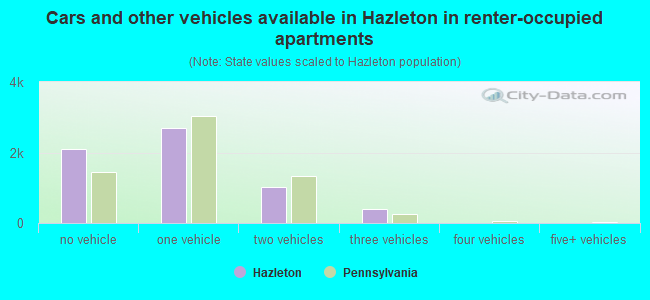
Vehicles available in renter-occupied houses - no vehicle available (%)
Vehicles available in renter-occupied houses - 1 vehicle available (%)
Vehicles available in renter-occupied houses - 2 Vehicles available (%)
Vehicles available in renter-occupied houses - 3 Vehicles available (%)
Vehicles available in renter-occupied houses - 4 Vehicles available (%)
Vehicles available in renter-occupied houses - 5+ Vehicles available (%)
Housing units in structures - 1, detached (%)
Housing units in structures - 1, attached (%)
Housing units in structures - 2 (%)
Housing units in structures - 3 or 4 (%)
Housing units in structures - 5 to 9 (%)
Housing units in structures - 10 to 19 (%)
Housing units in structures - 20 to 49 (%)
Housing units in structures - 50 or more (%)
Housing units in structures - Mobile home (%)
Housing units in structures - Boat, RV, van, etc. (%)
Housing units in structures - Owners - 1, detached (%)
Housing units in structures - Owners - 1, attached (%)
Housing units in structures - Owners - 2 (%)
Housing units in structures - Owners - 3 or 4 (%)
Housing units in structures - Owners - 5 to 9 (%)
Housing units in structures - Owners - 10 to 19 (%)
Housing units in structures - Owners - 20 to 49 (%)
Housing units in structures - Owners - 50 or more (%)
Housing units in structures - Owners - Mobile home (%)
Housing units in structures - Owners - Boat, RV, van, etc. (%)
Housing units in structures - Renters - 1, detached (%)
Housing units in structures - Renters - 1, attached (%)
Housing units in structures - Renters - 2 (%)
Housing units in structures - Renters - 3 or 4 (%)
Housing units in structures - Renters - 5 to 9 (%)
Housing units in structures - Renters - 10 to 19 (%)
Housing units in structures - Renters - 20 to 49 (%)
Housing units in structures - Renters - 50 or more (%)
Housing units in structures - Renters - Mobile home (%)
Housing units in structures - Renters - Boat, RV, van, etc. (%)
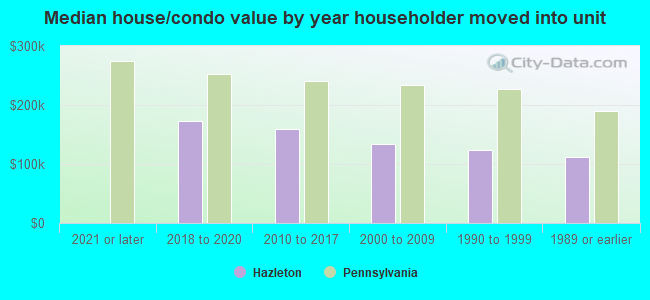
House/condo owner moved in on average (years ago)
Renter moved in on average (years ago)
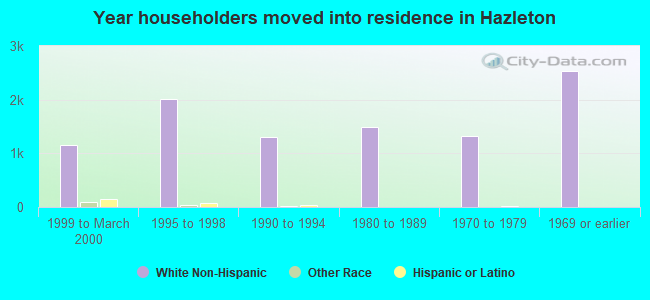
Year householder moved into unit - Moved in 1999 to March 2000 (%)
Year householder moved into unit - Moved in 1999 to March 2000 (%) - White
Year householder moved into unit - Moved in 1999 to March 2000 (%) - Black or African American
Year householder moved into unit - Moved in 1999 to March 2000 (%) - Asian
Year householder moved into unit - Moved in 1999 to March 2000 (%) - Hispanic or Latino
Year householder moved into unit - Moved in 1999 to March 2000 (%) - American Indian and Alaska Native
Year householder moved into unit - Moved in 1999 to March 2000 (%) - Multirace
Year householder moved into unit - Moved in 1999 to March 2000 (%) - Other Race
Year householder moved into unit - Moved in 1995 to 1998 (%)
Year householder moved into unit - Moved in 1995 to 1998 (%) - White
Year householder moved into unit - Moved in 1995 to 1998 (%) - Black or African American
Year householder moved into unit - Moved in 1995 to 1998 (%) - Asian
Year householder moved into unit - Moved in 1995 to 1998 (%) - Hispanic or Latino
Year householder moved into unit - Moved in 1995 to 1998 (%) - American Indian and Alaska Native
Year householder moved into unit - Moved in 1995 to 1998 (%) - Multirace
Year householder moved into unit - Moved in 1995 to 1998 (%) - Other Race
Year householder moved into unit - Moved in 1990 to 1994 (%)
Year householder moved into unit - Moved in 1990 to 1994 (%) - White
Year householder moved into unit - Moved in 1990 to 1994 (%) - Black or African American
Year householder moved into unit - Moved in 1990 to 1994 (%) - Asian
Year householder moved into unit - Moved in 1990 to 1994 (%) - Hispanic or Latino
Year householder moved into unit - Moved in 1990 to 1994 (%) - American Indian and Alaska Native
Year householder moved into unit - Moved in 1990 to 1994 (%) - Multirace
Year householder moved into unit - Moved in 1990 to 1994 (%) - Other Race
Year householder moved into unit - Moved in 1980 to 1989 (%)
Year householder moved into unit - Moved in 1980 to 1989 (%) - White
Year householder moved into unit - Moved in 1980 to 1989 (%) - Black or African American
Year householder moved into unit - Moved in 1980 to 1989 (%) - Asian
Year householder moved into unit - Moved in 1980 to 1989 (%) - Hispanic or Latino
Year householder moved into unit - Moved in 1980 to 1989 (%) - American Indian and Alaska Native
Year householder moved into unit - Moved in 1980 to 1989 (%) - Multirace
Year householder moved into unit - Moved in 1980 to 1989 (%) - Other Race
Year householder moved into unit - Moved in 1970 to 1979 (%)
Year householder moved into unit - Moved in 1970 to 1979 (%) - White
Year householder moved into unit - Moved in 1970 to 1979 (%) - Black or African American
Year householder moved into unit - Moved in 1970 to 1979 (%) - Asian
Year householder moved into unit - Moved in 1970 to 1979 (%) - Hispanic or Latino
Year householder moved into unit - Moved in 1970 to 1979 (%) - American Indian and Alaska Native
Year householder moved into unit - Moved in 1970 to 1979 (%) - Multirace
Year householder moved into unit - Moved in 1970 to 1979 (%) - Other Race
Year householder moved into unit - Moved in 1969 or earlier (%)
Year householder moved into unit - Moved in 1969 or earlier (%) - White
Year householder moved into unit - Moved in 1969 or earlier (%) - Black or African American
Year householder moved into unit - Moved in 1969 or earlier (%) - Asian
Year householder moved into unit - Moved in 1969 or earlier (%) - Hispanic or Latino
Year householder moved into unit - Moved in 1969 or earlier (%) - American Indian and Alaska Native
Year householder moved into unit - Moved in 1969 or earlier (%) - Multirace
Year householder moved into unit - Moved in 1969 or earlier (%) - Other Race
Housing units lacking complete plumbing facilities (%)
Housing units lacking complete kitchen facilities (%)
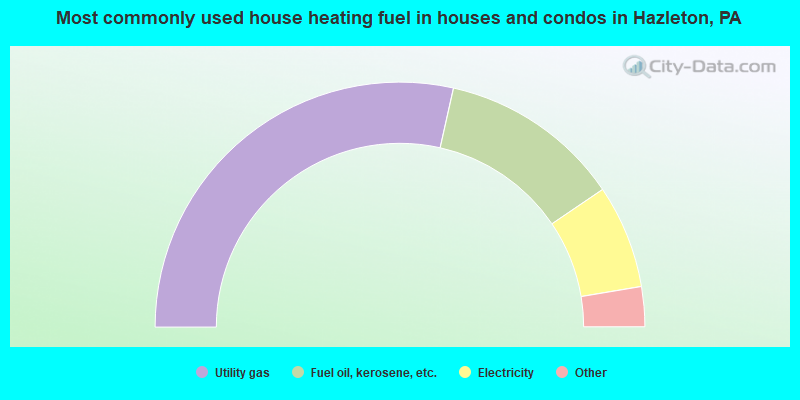
House heating fuel used in houses and condos - Utility gas (%)
House heating fuel used in houses and condos - Bottled, tank, or LP gas (%)
House heating fuel used in houses and condos - Electricity (%)
House heating fuel used in houses and condos - Fuel oil, kerosene, etc. (%)
House heating fuel used in houses and condos - Coal or coke (%)
House heating fuel used in houses and condos - Wood (%)
House heating fuel used in houses and condos - Solar energy (%)
House heating fuel used in houses and condos - Other fuel (%)
House heating fuel used in houses and condos - No fuel used (%)
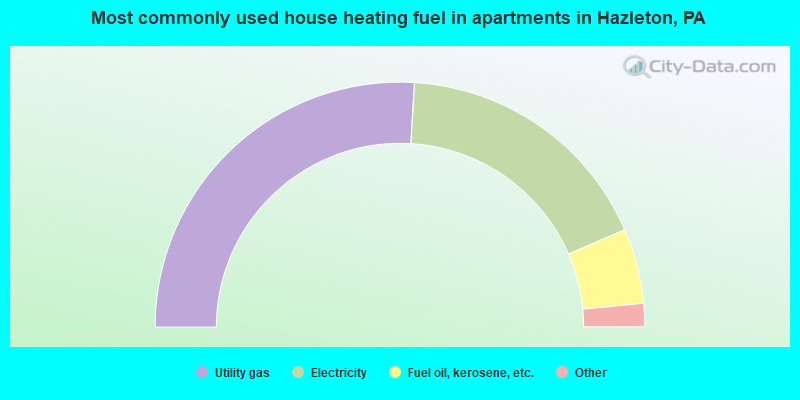
House heating fuel used in apartments - Utility gas (%)
House heating fuel used in apartments - Bottled, tank, or LP gas (%)
House heating fuel used in apartments - Electricity (%)
House heating fuel used in apartments - Fuel oil, kerosene, etc. (%)
House heating fuel used in apartments - Coal or coke (%)
House heating fuel used in apartments - Wood (%)
House heating fuel used in apartments - Solar energy (%)
House heating fuel used in apartments - Other fuel (%)
House heating fuel used in apartments - No fuel used (%)
Latest news about housing in Hazleton, PA collected exclusively by city-data.com from local newspapers, TV, and radio stations
Median year house/condo built: 1950Median year apartment built: 1956Household type by relationship:
Households: 29,759
Male householders: 5,950 (2,016 living alone ), Female householders: 5,416 (1,894 living alone )3,600 spouses (3,572 opposite-sex spouses ), 1,156 unmarried partners , (1,132 opposite-sex unmarried partners ), 8,705 children (8,123 natural , 30 adopted , 552 stepchildren ), 974 grandchildren , 509 brothers or sisters , 581 parents , 67 foster children , 1,008 other relatives , 1,496 non-relatives In group quarters: 291
Size of family households: 2,755 2-persons , 1,778 3-persons , 1,057 4-persons , 657 5-persons , 385 6-persons , 397 7-or-more-persons .
Size of nonfamily households: 3,771 1-person , 452 2-persons , 85 3-persons , 107 4-persons , 45 7-or-more-persons .
2,248 married couples with children. single-parent households (858 men , 2,715 women ).
42.9% of residents of Hazleton speak English at home. of residents speak Spanish at home (42% speak English very well , 22% speak English well , 20% speak English not well , 16% don't speak English at all ).of residents speak other Indo-European language at home (76% speak English very well , 15% speak English well , 5% speak English not well , 4% don't speak English at all ).
Foreign born population: 10,920 (36.7%)of them are naturalized citizens )
Median number of rooms in houses and condos:
Median number of rooms in apartments
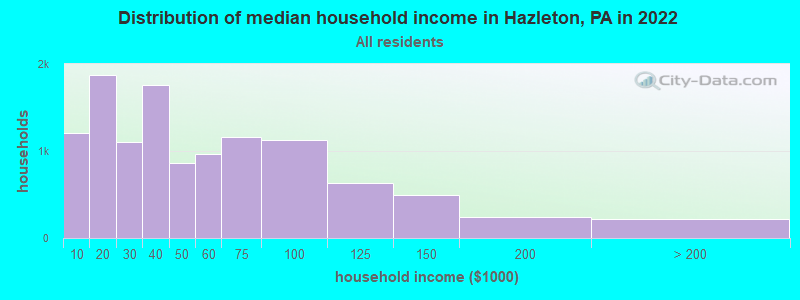
Hazleton, PA household income distribution 1,212 Less than $10,0001,878 $10,000 to $19,9991,101 $20,000 to $29,9991,764 $30,000 to $39,999858 $40,000 to $49,999965 $50,000 to $59,9991,163 $60,000 to $74,9991,127 $75,000 to $99,999637 $100,000 to $124,999493 $125,000 to $149,999241 $150,000 to $199,999216 $200,000 or more
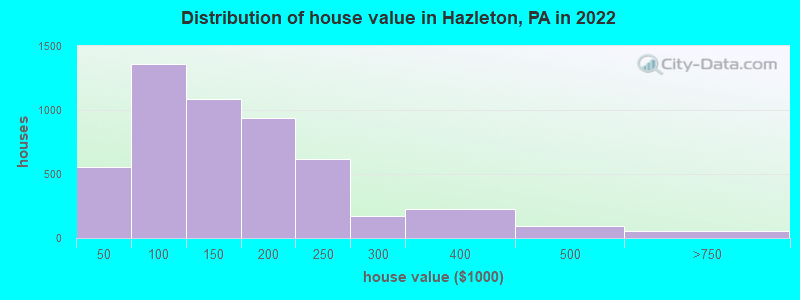
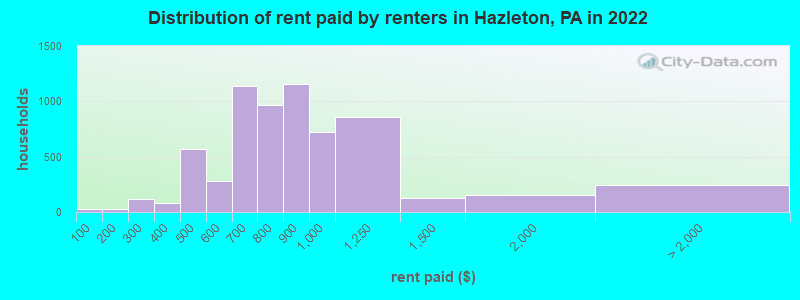
Home value of owner - occupied houses in 2022 in Hazleton, PA 102 Less than $10,00079 $10,000 to $14,999146 $15,000 to $19,99913 $20,000 to $24,99923 $25,000 to $29,99929 $30,000 to $34,99942 $35,000 to $39,999117 $40,000 to $49,999138 $50,000 to $59,999352 $60,000 to $69,999219 $70,000 to $79,999231 $80,000 to $89,999303 $90,000 to $99,999587 $100,000 to $124,999497 $125,000 to $149,999605 $150,000 to $174,999328 $175,000 to $199,999618 $200,000 to $249,999173 $250,000 to $299,999227 $300,000 to $399,99994 $400,000 to $499,99952 $500,000 to $749,999Rent paid by renters in 2022 in Hazleton, PA 22 Less than $10025 $150 to $19954 $200 to $24966 $250 to $29924 $300 to $34956 $350 to $399252 $400 to $449315 $450 to $499175 $500 to $549105 $550 to $599803 $600 to $649338 $650 to $699267 $700 to $749703 $750 to $7991,153 $800 to $899724 $900 to $999853 $1,000 to $1,249122 $1,250 to $1,499151 $1,500 to $1,999245 No cash rent
Percentage of workers working in this county: 85.5%Number of people working at home: 484 (3.6% of all workers )
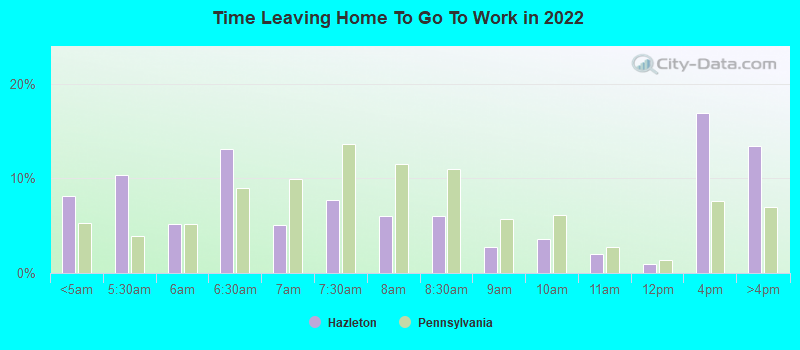
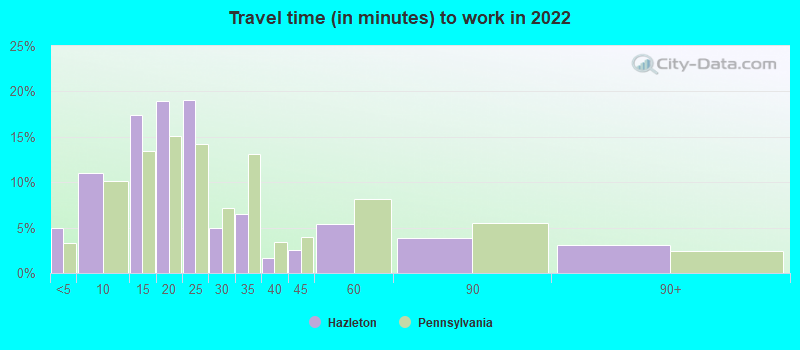
Travel time to work (commute)
Less than 5 minutes: 6385 to 9 minutes: 1,12110 to 14 minutes: 2,48715 to 19 minutes: 2,89020 to 24 minutes: 2,41325 to 29 minutes: 45630 to 34 minutes: 93635 to 39 minutes: 3640 to 44 minutes: 45045 to 59 minutes: 62160 to 89 minutes: 23890 or more minutes: 496
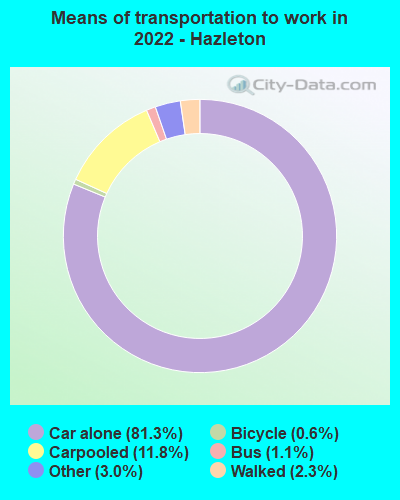
Means of transportation to work:
Drove a car alone: 8,275 (76.3%)Carpooled: 1,279 (11.8%)Bus : 102 (0.9%)Taxi: 367 (3.4%)Bicycle: 72 (0.7%)Walked: 219 (2.0%)Worked at home: 484 (4.5%)
Unemployment by race in 2022
Unemployment rate for White non-Hispanic residents 3.7% Males2.6% FemalesUnemployment rate for Black residents 12.3% Males1.9% FemalesUnemployment rate for other race residents 7.0% Males8.4% FemalesUnemployment rate for two or more race residents 7.1% Males3.8% FemalesUnemployment rate for Hispanic or Latino residents 14.3% Males7.3% Females
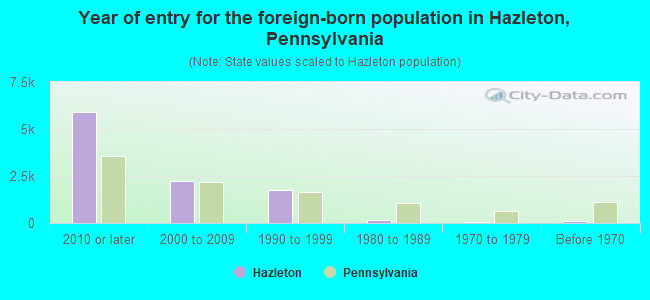
Year of entry for the foreign-born population in Hazleton, Pennsylvania
5,886 2010 or later 2,222 2000 to 2009 1,741 1990 to 1999 181 1980 to 1989 74 1970 to 1979 125 Before 1970
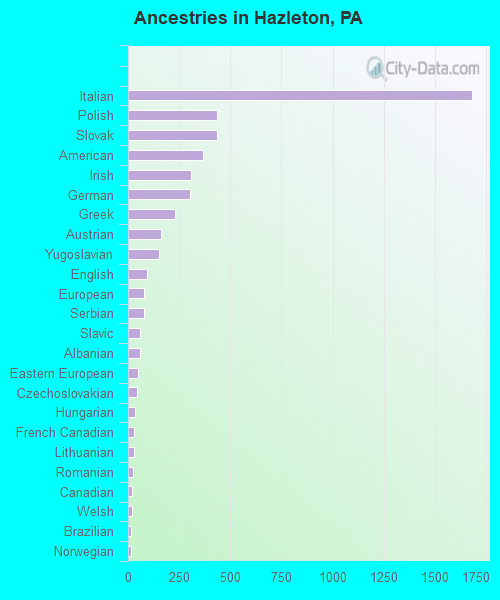
First ancestries reported:
Italian: 1,681 (9.1%)
Polish: 433 (2.3%)
Slovak: 433 (2.3%)
American: 368 (2.0%)
Irish: 309 (1.7%)
German: 301 (1.6%)
Greek: 230 (1.2%)
Austrian: 159 (0.9%)
Yugoslavian: 154 (0.8%)
English: 92 (0.5%)
European: 80 (0.4%)
Serbian: 80 (0.4%)
Slavic: 61 (0.3%)
Albanian: 60 (0.3%)
Eastern European: 50 (0.3%)
Czechoslovakian: 45 (0.2%)
Hungarian: 35 (0.2%)
French Canadian: 30 (0.2%)
Lithuanian: 27 (0.1%)
Romanian: 24 (0.1%)
Canadian: 19 (0.1%)
Welsh: 18 (0.10%)
Brazilian: 17 (0.09%)
Norwegian: 17 (0.09%)
Dutch: 14 (0.08%)
Pennsylvania German: 12 (0.06%)
Russian: 11 (0.06%)
French: 10 (0.05%)
Lebanese: 8 (0.04%)
Syrian: 8 (0.04%)
Carpatho Rusyn: 7 (0.04%) Most common places of birth for foreign-born residents (%): Dominican Republic Hazleton:
102.1% (11,081)Pennsylvania:
9.2% (86,544)
Mexico Hazleton:
5.0% (548)Pennsylvania:
5.8% (54,190)
Venezuela Hazleton:
3.7% (397)Pennsylvania:
0.6% (5,742)
Guatemala Hazleton:
2.1% (223)Pennsylvania:
1.4% (13,268)
El Salvador Hazleton:
1.7% (185)Pennsylvania:
0.8% (7,727)
Other Eastern Europe Hazleton:
1.5% (168)Pennsylvania:
0.7% (6,643)
Place of birth for U.S.-born residents:
This state: 11,301Other state: 6,700Northeast: 5,551Midwest: 207South: 631West: 275 85.0% of Hazleton residents lived in the same house 1 years ago.
Out of people who lived in different houses, 24.1% lived in this county.
Out of people who lived in different counties, 27.5% lived in Pennsylvania.
Hazleton:
85.0%State average:
89.3%
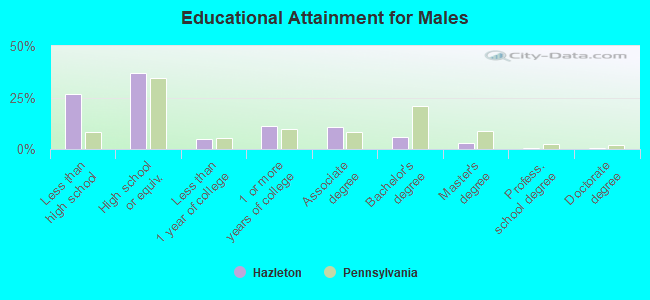
Education attainment for males 25 years and older:
No schooling: 708Nursery to 4th grade: 2375th and 6th grade: 1487th and 8th grade: 4829th grade: 16710th grade: 12211th grade: 28412th grade, no diploma: 335High school graduate (or equivalency): 3,409Less than 1 year of college: 436Some college more than 1 year, no degree: 1,037Associate degree: 1,011Bachelor's degree: 560Master's degree: 250Professional school degree: 42Doctorate degree: 45
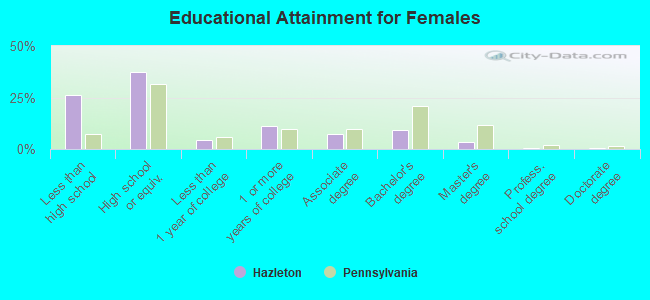
Education attainment for females 25 years and older:
No schooling: 722Nursery to 4th grade: 2035th and 6th grade: 837th and 8th grade: 5499th grade: 12610th grade: 14911th grade: 28612th grade, no diploma: 348High school graduate (or equivalency): 3,547Less than 1 year of college: 398Some college more than 1 year, no degree: 1,063Associate degree: 702Bachelor's degree: 895Master's degree: 299Professional school degree: 42Doctorate degree: 50
Housing units in structures:
One, detached: 4,787One, attached: 3,883Two: 1,1903 or 4: 1,1905 to 9: 70510 to 19: 6520 to 49: 16850 or more: 329Mobile homes: 166Boats, RVs, vans, etc.: 4Housing units lacking complete plumbing facilities in 2022: 1.2%Housing units lacking complete kitchen facilities in 2022: 1.8%House/condo owner moved in on average 18 years ago
Renter moved in on average 3 years ago
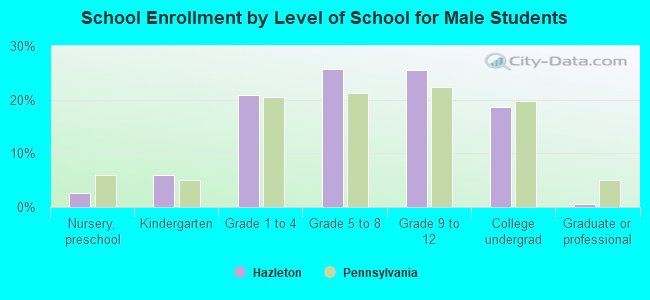
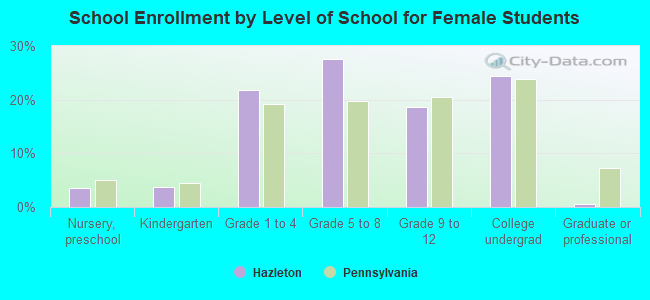
Private vs. public school enrollment:
Students in private schools in grades 1 to 8 (elementary and middle school): 215 Here:
6.7%Pennsylvania:
15.7%
Students in private schools in grades 9 to 12 (high school): 100 Here:
6.5%Pennsylvania:
13.4%
Students in private undergraduate colleges: 484 Here:
32.9%Pennsylvania:
39.8%