Helena Valley West Central, MT (Montana) Houses and Residents
| Helena Valley West Central: | $380,116 |
| Montana: | $366,400 |
Mean price in 2022:
Detached houses: $412,307
Here: $412,307 State: $518,333 In 2-unit structures: $167,501
Here: $167,501 State: $254,784 Mobile homes: $105,677
Here: $105,677 State: $139,111
Total population: 7,883 (Urban population: 4,630 (all inside urban clusters), Rural population: 2,543 (41 farm, 2,502 nonfarm))
Houses: 3,147 (3,059 occupied: 2,469 owner occupied, 569 renter occupied)
| % of renters here: | 19% |
| State: | 31% |
Housing density: 118 houses/condos per square mile
Median price asked for vacant for-sale houses and condos in 2022 in this county: $312,018.
Median contract rent in 2022: $1,091 (lower quartile is $678, upper quartile is $1,788)
Median rent asked for vacant for-rent units in 2022: $1,083
Median gross rent in Helena Valley West Central, MT in 2022: $1,277
Housing units in Helena Valley West Central with a mortgage: 1,517 (177 second mortgage, 18 home equity loan, 182 both second mortgage and home equity loan)
Houses without a mortgage: 6
Median household income for houses/condos with a mortgage: $98,312
Median household income for apartments without a mortgage: $70,860
Median monthly housing costs: $1,481
Compare current foreclosures near Helena Valley West Central, MT:
| Photo | Address | Area | Beds / Baths | Price | Details |
|---|---|---|---|---|---|

|
#1
Dutchman Ct
Helena, MT 59602
|
1,170 sq. feet
|
2 baths 3 beds |
show details | |

|
#2
Griffin Rd
Helena, MT 59602
|
1,716 sq. feet
|
3 baths 5 beds |
show details | |

|
#3
Saint John Road
East Helena, MT 59635
|
2,096 sq. feet
|
2 baths 3 beds |
show details | |

|
#4
Stacia Ave
Helena, MT 59601
|
1,057 sq. feet
|
1 baths 2 beds |
show details | |

|
#5
Wilder Ave
Helena, MT 59602
|
2,814 sq. feet
|
4 baths 6 beds |
show details | |

|
#6
Elk Run Rd
Helena, MT 59602
|
1,596 sq. feet
|
2 baths 4 beds |
show details | |

|
#7
Riviera Dr
Helena, MT 59602
|
924 sq. feet
|
1 baths 2 beds |
show details | |

|
#8
E 13th St
Helena, MT 59601
|
908 sq. feet
|
1 baths 1 beds |
show details | |

|
#9
Western Dr
Helena, MT 59602
|
1,216 sq. feet
|
2 baths 3 beds |
show details | |

|
#10
N Hill Rd
Helena, MT 59602
|
1,288 sq. feet
|
2 baths 3 beds |
show details |
| Photo | Address | Area | Beds / Baths | Price | Details |
|---|---|---|---|---|---|

|
#11
Last Straw Dr
Helena, MT 59602
|
2,281 sq. feet
|
2 baths 3 beds |
show details | |

|
#12
Lariat Rd
Helena, MT 59602
|
3,436 sq. feet
|
3 baths 5 beds |
show details | |

|
#13
Birkland Dr
Helena, MT 59602
|
2,551 sq. feet
|
2 baths 4 beds |
show details | |

|
#14
Elkview Rd
East Helena, MT 59635
|
924 sq. feet
|
1 baths 3 beds |
show details | |

|
#15
Ferry Dr
Helena, MT 59602
|
1,232 sq. feet
|
1 baths 3 beds |
show details | |

|
#16
Lone Pine Rd
Helena, MT 59602
|
1,836 sq. feet
|
2 baths 3 beds |
show details | |

|
#17
Kelly Rd
Helena, MT 59602
|
1,008 sq. feet
|
1 baths 3 beds |
show details | |

|
#18
E Dudley St
East Helena, MT 59635
|
784 sq. feet
|
1 baths 2 beds |
show details | |

|
#19
Concord Rd
Helena, MT 59602
|
1,839 sq. feet
|
2 baths 3 beds |
show details | |

|
#20
Wylie Dr Stop 3
Helena, MT 59602
|
- sq. feet
|
- baths - beds |
show details |
| Photo | Address | Area | Beds / Baths | Price | Details |
|---|---|---|---|---|---|

|
#21
E Clark St
East Helena, MT 59635
|
- sq. feet
|
- baths - beds |
show details | |

|
#22
Scott Dr
Helena, MT 59601
|
- sq. feet
|
- baths - beds |
show details | |

|
#23
Colter Loop Dr
Helena, MT 59602
|
- sq. feet
|
- baths - beds |
show details | |

|
#24
Green Meadow Dr
Helena, MT 59602
|
- sq. feet
|
- baths - beds |
show details | |

|
#25
E Broadway St Apt 11d
Helena, MT 59601
|
- sq. feet
|
- baths - beds |
show details | |

|
#26
Legend Loop, Apt 301
Helena, MT 59602
|
- sq. feet
|
- baths - beds |
show details | |

|
#27
1/2 South Rodney Street
Helena, MT 59601
|
- sq. feet
|
- baths - beds |
show details | |

|
#28
N Benton Ave
Helena, MT 59601
|
- sq. feet
|
- baths - beds |
show details | |

|
#29
Poplar St
Helena, MT 59601
|
- sq. feet
|
- baths - beds |
show details | |

|
#30
Aspen St # 520
Helena, MT 59601
|
- sq. feet
|
- baths - beds |
show details |
| Photo | Address | Area | Beds / Baths | Price | Details |
|---|---|---|---|---|---|

|
#31
Encore Way
Helena, MT 59602
|
- sq. feet
|
- baths - beds |
show details | |

|
#32
Cole Ave Apt 3
Helena, MT 59601
|
- sq. feet
|
- baths - beds |
show details | |

|
#33
Claim Jumper Dr
Helena, MT 59602
|
- sq. feet
|
- baths - beds |
show details | |

|
#34
Waukesha Ave
Helena, MT 59601
|
- sq. feet
|
- baths - beds |
show details | |

|
#35
Quail Dr Apt D
Helena, MT 59602
|
- sq. feet
|
- baths - beds |
show details | |

|
#36
Saint John Rd E
Helena, MT 59601
|
- sq. feet
|
- baths - beds |
show details | |

|
Check over 1 million property listings on Foreclosure.com!
|
browse all offers | |||


Median year apartment built: 1995
Household type by relationship:
Households: 8,475- Male householders: 1,717 (443 living alone), Female householders: 1,394 (192 living alone)
1,900 spouses (1,900 opposite-sex spouses), 122 unmarried partners, (122 opposite-sex unmarried partners), 2,665 children (2,252 natural, 318 adopted, 95 stepchildren), 77 grandchildren, 50 brothers or sisters, 144 parents, 32 foster children, 149 other relatives, 205 non-relatives
- In group quarters: 14
Size of family households: 1,166 2-persons, 603 3-persons, 285 4-persons, 274 5-persons, 103 6-persons, 73 7-or-more-persons.
Size of nonfamily households: 561 1-person, 68 2-persons, 40 3-persons.
1,821 married couples with children.
297 single-parent households (48 men, 249 women).
97.1% of residents of Helena Valley West Central speak English at home.
1.0% of residents speak Spanish at home (76% speak English very well, 24% speak English well).
1.4% of residents speak other Indo-European language at home (100% speak English very well).
0.3% of residents speak Asian or Pacific Island language at home (100% speak English very well).
Foreign born population: 329 (3.9%)
(33.7% of them are naturalized citizens)
| Here: | 6.8 |
| State: | 6.4 |
| Here: | 6.1 |
| State: | 4.2 |

- Bedrooms in owner-occupied houses and condos in Helena Valley West Central, Montana
- 0no bedroom
- 01 bedroom
- 3052 bedrooms
- 1,1723 bedrooms
- 7354 bedrooms
- 2575+ bedrooms

- Bedrooms in renter-occupied apartments in Helena Valley West Central, Montana
- 0no bedroom
- 451 bedroom
- 1752 bedrooms
- 1343 bedrooms
- 2154 bedrooms
- 05+ bedrooms

- Cars and other vehicles available in Helena Valley West Central in owner-occupied houses/condos
- 38no vehicle
- 2601 vehicle
- 1,1352 vehicles
- 5853 vehicles
- 3134 vehicles
- 1385+ vehicles

- Cars and other vehicles available in Helena Valley West Central in renter-occupied apartments
- 10no vehicle
- 2041 vehicle
- 1562 vehicles
- 643 vehicles
- 1284 vehicles
- 85+ vehicles

- Rooms in owner-occupied houses in Helena Valley West Central, Montana
- 01 room
- 02 rooms
- 743 rooms
- 2134 rooms
- 3735 rooms
- 4906 rooms
- 4517 rooms
- 3918 rooms
- 4779+ rooms

- Rooms in renter-occupied apartments in Helena Valley West Central, Montana
- 01 room
- 232 rooms
- 123 rooms
- 1064 rooms
- 1095 rooms
- 1076 rooms
- 657 rooms
- 1268 rooms
- 229+ rooms


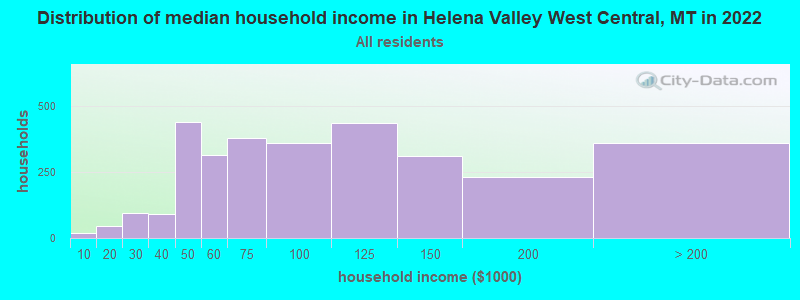
Helena Valley West Central, MT household income distribution

- 18Less than $10,000
- 44$10,000 to $19,999
- 94$20,000 to $29,999
- 91$30,000 to $39,999
- 438$40,000 to $49,999
- 313$50,000 to $59,999
- 378$60,000 to $74,999
- 359$75,000 to $99,999
- 434$100,000 to $124,999
- 309$125,000 to $149,999
- 231$150,000 to $199,999
- 360$200,000 or more
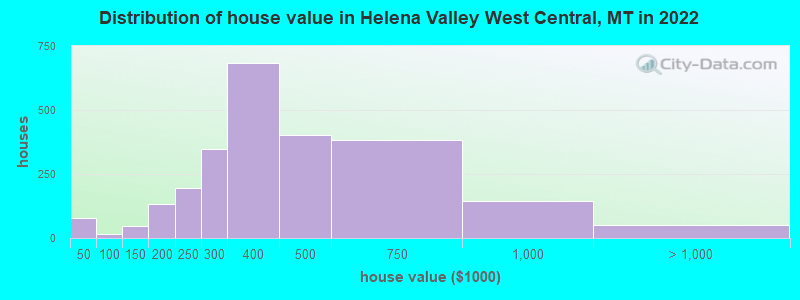
Home value of owner - occupied houses in 2022 in Helena Valley West Central, MT
-
- 37Less than $10,000
- 5$15,000 to $19,999
- 15$25,000 to $29,999
- 9$30,000 to $34,999
- 9$35,000 to $39,999
- 2$50,000 to $59,999
- 12$90,000 to $99,999
- 41$100,000 to $124,999
- 5$125,000 to $149,999
- 70$150,000 to $174,999
- 64$175,000 to $199,999
- 194$200,000 to $249,999
- 349$250,000 to $299,999
- 683$300,000 to $399,999
- 400$400,000 to $499,999
- 382$500,000 to $749,999
- 146$750,000 to $999,999
- 29$1,000,000 to $1,499,999
- 22$2,000,000 or more
Rent paid by renters in 2022 in Helena Valley West Central, MT
-
- 19$550 to $599
- 126$600 to $649
- 11$700 to $749
- 65$800 to $899
- 39$900 to $999
- 30$1,000 to $1,249
- 76$1,250 to $1,499
- 203$1,500 to $1,999
- 61No cash rent


Percentage of workers working in this county: 96.9%
Number of people working at home: 446 (10.6% of all workers)
Travel time to work (commute)
- Less than 5 minutes: 224
- 5 to 9 minutes: 256
- 10 to 14 minutes: 773
- 15 to 19 minutes: 1,295
- 20 to 24 minutes: 429
- 25 to 29 minutes: 144
- 30 to 34 minutes: 261
- 35 to 39 minutes: 0
- 40 to 44 minutes: 0
- 45 to 59 minutes: 150
- 60 to 89 minutes: 65
- 90 or more minutes: 21
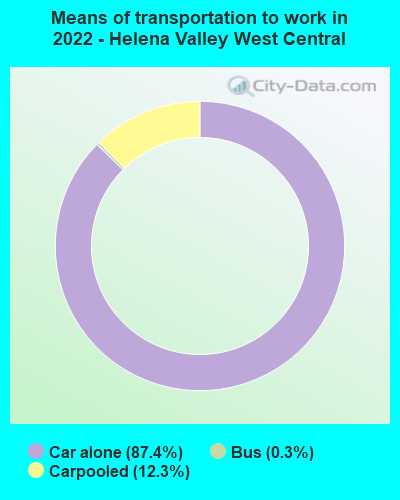
Means of transportation to work:
- Drove a car alone: 633 (55.7%)
- Carpooled: 105 (9.2%)
- Bus: 1 (0.1%)
- Worked at home: 446 (39.2%)

- Unemployment by race in 2022
- Unemployment rate for White non-Hispanic residents
- 10.3%Males
- 3.6%Females

- Year of entry for the foreign-born population in Helena Valley West Central, Montana
- 02010 or later
- 242000 to 2009
- 891990 to 1999
- 291980 to 1989
- 151970 to 1979
- 51Before 1970

First ancestries reported:
- German: 756 (26.0%)
- English: 612 (21.0%)
- American: 415 (14.3%)
- Norwegian: 163 (5.6%)
- Italian: 102 (3.5%)
- Scottish: 102 (3.5%)
- Irish: 93 (3.2%)
- Croatian: 45 (1.5%)
- Portuguese: 30 (1.0%)
- Scotch-Irish: 30 (1.0%)
- British: 27 (0.9%)
- Hungarian: 26 (0.9%)
- Polish: 24 (0.8%)
- European: 23 (0.8%)
- Czech: 20 (0.7%)
- Dutch: 7 (0.2%)
- Pennsylvania German: 7 (0.2%)
- Slovene: 6 (0.2%)
- African: 6 (0.2%)
- Austrian: 5 (0.2%)
- Luxembourger: 4 (0.1%)
Most common places of birth for foreign-born residents (%):
| Helena Valley West Central: | 40.5% (125) |
| Montana: | 9.3% (2,310) |
| Helena Valley West Central: | 27.2% (84) |
| Montana: | 10.6% (2,608) |
| Helena Valley West Central: | 17.5% (54) |
| Montana: | 7.0% (1,735) |
| Helena Valley West Central: | 8.7% (27) |
| Montana: | 1.1% (268) |
| Helena Valley West Central: | 2.3% (7) |
| Montana: | 14.2% (3,503) |
Place of birth for U.S.-born residents:
- This state: 4,265
- Other state: 3,806
- Northeast: 288
- Midwest: 1,275
- South: 588
- West: 1,644
92.8% of Helena Valley West Central residents lived in the same house 1 years ago.
Out of people who lived in different houses, 40.4% lived in this county.
Out of people who lived in different counties, 11.4% lived in Montana.
| Helena Valley West Central: | 92.8% |
| State average: | 86.7% |
Education attainment for males 25 years and older:
- No schooling: 11
- Nursery to 4th grade: 6
- 5th and 6th grade: 0
- 7th and 8th grade: 1
- 9th grade: 0
- 10th grade: 23
- 11th grade: 9
- 12th grade, no diploma: 63
- High school graduate (or equivalency): 724
- Less than 1 year of college: 175
- Some college more than 1 year, no degree: 459
- Associate degree: 358
- Bachelor's degree: 873
- Master's degree: 174
- Professional school degree: 43
- Doctorate degree: 48

Education attainment for females 25 years and older:
- No schooling: 43
- Nursery to 4th grade: 0
- 5th and 6th grade: 0
- 7th and 8th grade: 0
- 9th grade: 0
- 10th grade: 0
- 11th grade: 35
- 12th grade, no diploma: 29
- High school graduate (or equivalency): 578
- Less than 1 year of college: 365
- Some college more than 1 year, no degree: 161
- Associate degree: 368
- Bachelor's degree: 701
- Master's degree: 441
- Professional school degree: 72
- Doctorate degree: 22


Housing units in structures:
- One, detached: 2,659
- One, attached: 29
- 5 to 9: 9
- 20 to 49: 16
- Mobile homes: 423
- Boats, RVs, vans, etc.: 9
Median worth of mobile homes: $248,731
Housing units lacking complete kitchen facilities in 2022: 0.2%
House/condo owner moved in on average 9 years ago
Renter moved in on average 1 years ago

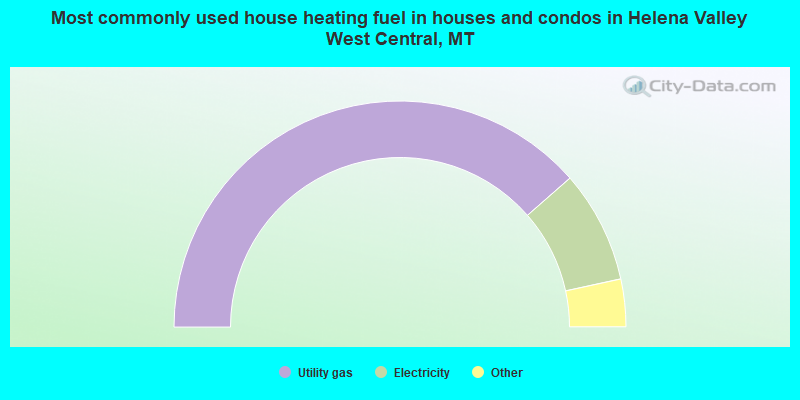
- 77.1%Utility gas
- 16.1%Electricity
- 3.8%Wood
- 2.3%Bottled, tank, or LP gas
- 0.6%Other fuel
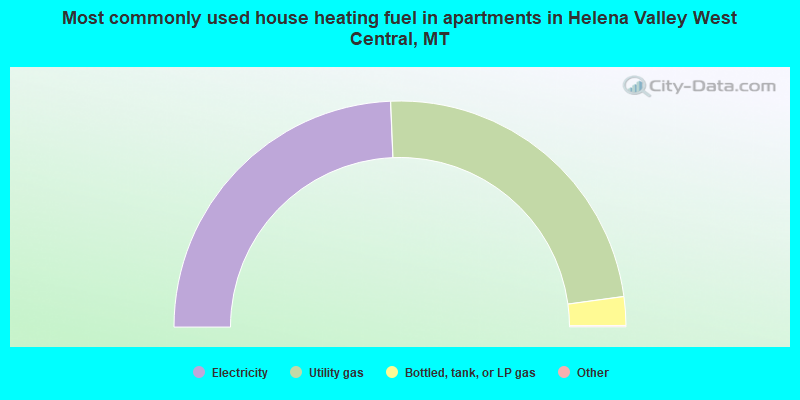
- 48.8%Electricity
- 47.1%Utility gas
- 4.1%Bottled, tank, or LP gas
Private vs. public school enrollment:
| Here: | 11.1% |
| Montana: | 15.3% |
| Here: | 5.8% |
| Montana: | 12.2% |
| Here: | 28.9% |
| Montana: | 15.0% |


