Hendersonville, TN (Tennessee) Houses and Residents
| Hendersonville: | $433,321 |
| Tennessee: | $284,800 |
Mean price in 2022:
Detached houses: $403,198
Here: $403,198 State: $374,382 Townhouses or other attached units: $224,781
Here: $224,781 State: $354,101 In 2-unit structures: $133,065
Here: $133,065 State: $247,693 In 3-to-4-unit structures: $123,543
Here: $123,543 State: $239,060 In 5-or-more-unit structures: $166,012
Here: $166,012 State: $317,434 Mobile homes: $69,381
Here: $69,381 State: $101,421
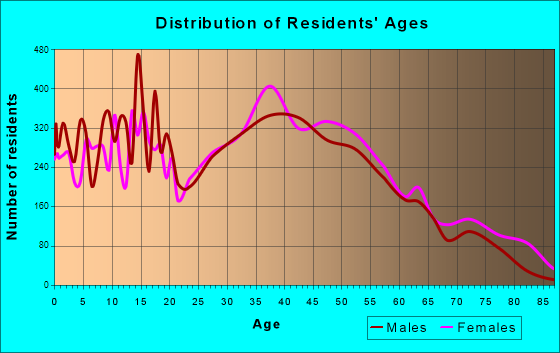
Total population: 55,153 (Urban population: 40,348, Rural population: 189 (14 farm, 175 nonfarm))
Houses: 26,805 (25,437 occupied: 18,462 owner occupied, 7,270 renter occupied)
| % of renters here: | 28% |
| State: | 33% |
Housing density: 981 houses/condos per square mile
Median price asked for vacant for-sale houses and condos in 2022: $990,583.
Median contract rent in 2022: $1,365 (lower quartile is $1,115, upper quartile is $1,857)
Median rent asked for vacant for-rent units in 2022: $1,721
Median gross rent in Hendersonville, TN in 2022: $1,543
Housing units in Hendersonville with a mortgage: 12,797 (1,548 second mortgage, 262 home equity loan, 1,180 both second mortgage and home equity loan)
Houses without a mortgage: 58
Median household income for houses/condos with a mortgage: $113,597
Median household income for apartments without a mortgage: $88,113
Median monthly housing costs: $1,579
Compare current foreclosures in Hendersonville, TN:
| Photo | Address | Area | Beds / Baths | Price | Details |
|---|---|---|---|---|---|

|
#1
Chippendale Dr
Hendersonville, TN 37075
|
1,819 sq. feet
|
1 baths 4 beds |
show details | |

|
#2
Manor Way
Hendersonville, TN 37075
|
- sq. feet
|
4 baths 6 beds |
show details | |

|
#3
Tamaras Ct
Hendersonville, TN 37075
|
2,638 sq. feet
|
3 baths - beds |
show details | |

|
#4
Burrus Ave
Hendersonville, TN 37075
|
1,384 sq. feet
|
1 baths - beds |
show details | |

|
#5
Lucinda Ln
Hendersonville, TN 37075
|
1,100 sq. feet
|
1 baths - beds |
show details | |

|
#6
Cumberland Hills Dr
Hendersonville, TN 37075
|
2,696 sq. feet
|
2 baths - beds |
show details | |

|
#7
N Birchwood Dr
Hendersonville, TN 37075
|
1,178 sq. feet
|
2 baths - beds |
show details | |

|
#8
Dennis Rd
Hendersonville, TN 37075
|
1,575 sq. feet
|
1 baths - beds |
show details | |

|
#9
Ashland Pt
Hendersonville, TN 37075
|
2,880 sq. feet
|
5 baths - beds |
show details | |

|
#10
Beaumont Dr
Hendersonville, TN 37075
|
2,532 sq. feet
|
3 baths - beds |
show details |
| Photo | Address | Area | Beds / Baths | Price | Details |
|---|---|---|---|---|---|

|
#11
Paradise Dr
Hendersonville, TN 37075
|
2,031 sq. feet
|
2 baths - beds |
show details | |

|
#12
S Valley Rd
Hendersonville, TN 37075
|
2,030 sq. feet
|
1 baths - beds |
show details | |

|
#13
Bluegrass Cir
Hendersonville, TN 37075
|
4,276 sq. feet
|
3 baths - beds |
show details | |

|
#14
Raindrop Ln
Hendersonville, TN 37075
|
1,133 sq. feet
|
2 baths - beds |
show details | |

|
#15
Cumberland Hills Dr
Hendersonville, TN 37075
|
2,709 sq. feet
|
2 baths - beds |
show details | |

|
#16
Bay Dr
Hendersonville, TN 37075
|
1,506 sq. feet
|
2 baths - beds |
show details | |

|
#17
Shoreside Dr
Hendersonville, TN 37075
|
3,132 sq. feet
|
2 baths - beds |
show details | |

|
#18
Robinhood Cir
Hendersonville, TN 37075
|
1,188 sq. feet
|
1 baths - beds |
show details | |

|
#19
Raindrop Ln # A
Hendersonville, TN 37075
|
1,620 sq. feet
|
2 baths - beds |
show details | |

|
#20
Herons Nest Ln
Hendersonville, TN 37075
|
3,061 sq. feet
|
2 baths - beds |
show details |
| Photo | Address | Area | Beds / Baths | Price | Details |
|---|---|---|---|---|---|

|
#21
Brookside Ct
Hendersonville, TN 37075
|
1,084 sq. feet
|
1 baths - beds |
show details | |

|
#22
Sandy Valley Rd
Hendersonville, TN 37075
|
1,440 sq. feet
|
1 baths - beds |
show details | |

|
#23
Valley View Ct
Hendersonville, TN 37075
|
1,234 sq. feet
|
2 baths - beds |
show details | |

|
#24
Country Hills Dr
Hendersonville, TN 37075
|
3,180 sq. feet
|
3 baths - beds |
show details | |

|
#25
Cumberland Hills Dr
Hendersonville, TN 37075
|
2,920 sq. feet
|
2 baths - beds |
show details | |

|
#26
Walton Ferry Rd Apt 102
Hendersonville, TN 37075
|
1,064 sq. feet
|
1 baths - beds |
show details | |

|
#27
Lake Ridge Dr
Hendersonville, TN 37075
|
2,102 sq. feet
|
3 baths - beds |
show details | |

|
#28
Paradise Dr
Hendersonville, TN 37075
|
2,440 sq. feet
|
3 baths - beds |
show details | |

|
#29
Berrywood Dr
Hendersonville, TN 37075
|
1,368 sq. feet
|
1 baths - beds |
show details | |

|
#30
Harbor Dr
Hendersonville, TN 37075
|
2,998 sq. feet
|
3 baths - beds |
show details |
| Photo | Address | Area | Beds / Baths | Price | Details |
|---|---|---|---|---|---|

|
#31
Creekwood Ln
Hendersonville, TN 37075
|
1,080 sq. feet
|
1 baths - beds |
show details | |

|
#32
Northlake Dr
Hendersonville, TN 37075
|
1,522 sq. feet
|
2 baths - beds |
show details | |

|
#33
Maple Dr
Hendersonville, TN 37075
|
1,732 sq. feet
|
2 baths - beds |
show details | |

|
#34
Keene Vly S
Hendersonville, TN 37075
|
2,405 sq. feet
|
3 baths - beds |
show details | |

|
#35
Moyna Dr
Hendersonville, TN 37075
|
1,100 sq. feet
|
2 baths - beds |
show details | |

|
#36
La Via Dr
Hendersonville, TN 37075
|
1,534 sq. feet
|
1 baths - beds |
show details | |

|
#37
Savo Bay
Hendersonville, TN 37075
|
1,975 sq. feet
|
3 baths - beds |
show details | |

|
#38
Leeward Pt
Hendersonville, TN 37075
|
3,700 sq. feet
|
3 baths - beds |
show details | |

|
#39
Stirlingshire Dr
Hendersonville, TN 37075
|
2,562 sq. feet
|
3 baths - beds |
show details | |

|
#40
Nokes Dr
Hendersonville, TN 37075
|
2,004 sq. feet
|
1 baths - beds |
show details |
| Photo | Address | Area | Beds / Baths | Price | Details |
|---|---|---|---|---|---|

|
#41
Devonshire Trl
Hendersonville, TN 37075
|
3,081 sq. feet
|
2 baths - beds |
show details | |

|
#42
Peartree Dr
Hendersonville, TN 37075
|
1,166 sq. feet
|
2 baths - beds |
show details | |

|
#43
Fulman Rd
Hendersonville, TN 37075
|
2,532 sq. feet
|
3 baths - beds |
show details | |

|
#44
Monthaven Park Pl
Hendersonville, TN 37075
|
- sq. feet
|
- baths - beds |
show details | |

|
#45
Hazelwood Dr Apt B6
Hendersonville, TN 37075
|
- sq. feet
|
- baths - beds |
show details | |

|
#46
Hickory Heights Dr Apt 35d
Hendersonville, TN 37075
|
- sq. feet
|
- baths - beds |
show details | |

|
#47
Williamsburg Dr Apt 310
Hendersonville, TN 37075
|
- sq. feet
|
- baths - beds |
show details | |

|
#48
Lakeside Park Dr
Hendersonville, TN 37075
|
- sq. feet
|
- baths - beds |
show details | |

|
#49
Tiffany Ln
Hendersonville, TN 37075
|
- sq. feet
|
- baths - beds |
show details | |

|
Check over 1 million property listings on Foreclosure.com!
|
browse all offers | |||

Latest news about housing in Hendersonville, TN collected exclusively by city-data.com from local newspapers, TV, and radio stations

 | House Rentals in Hendersonville (3 replies) |
| Hendersonville Apartments (possible move from Bellevue) (7 replies) |
| Mount Juliet versus Hendersonville (95 replies) |
| Hendersonville - White house utility (6 replies) |
| Hendersonville Rental HOUSE (4 replies) |
| Hendersonville Apartments/Vacation Rentals??? (1 reply) |
Median year apartment built: 1994
Household type by relationship:
Households: 63,783- Male householders: 12,190 (2,854 living alone), Female householders: 12,918 (4,049 living alone)
13,953 spouses (13,826 opposite-sex spouses), 1,623 unmarried partners, (1,561 opposite-sex unmarried partners), 17,828 children (16,189 natural, 540 adopted, 1,097 stepchildren), 933 grandchildren, 332 brothers or sisters, 860 parents, 37 foster children, 946 other relatives, 1,881 non-relatives
- In group quarters: 277
Size of family households: 6,605 2-persons, 4,403 3-persons, 3,680 4-persons, 1,962 5-persons, 295 6-persons, 272 7-or-more-persons.
Size of nonfamily households: 7,081 1-person, 1,430 2-persons, 224 3-persons.
11,576 married couples with children.
1,903 single-parent households (327 men, 1,576 women).
93.0% of residents of Hendersonville speak English at home.
3.7% of residents speak Spanish at home (70% speak English very well, 13% speak English well, 10% speak English not well, 7% don't speak English at all).
1.8% of residents speak other Indo-European language at home (73% speak English very well, 14% speak English well, 14% speak English not well).
0.6% of residents speak Asian or Pacific Island language at home (60% speak English very well, 10% speak English well, 27% speak English not well, 3% don't speak English at all).
0.6% of residents speak other language at home (23% speak English very well, 58% speak English well, 19% speak English not well).
Foreign born population: 2,831 (4.4%)
(58.2% of them are naturalized citizens)
| Here: | 7.2 |
| State: | 6.5 |
| Here: | 4.3 |
| State: | 4.4 |

- Bedrooms in owner-occupied houses and condos in Hendersonville, Tennessee
- 72no bedroom
- 741 bedroom
- 9762 bedrooms
- 10,2453 bedrooms
- 6,0954 bedrooms
- 9995+ bedrooms

- Bedrooms in renter-occupied apartments in Hendersonville, Tennessee
- 308no bedroom
- 1,9361 bedroom
- 3,0862 bedrooms
- 1,5043 bedrooms
- 3244 bedrooms
- 1135+ bedrooms

- Cars and other vehicles available in Hendersonville in owner-occupied houses/condos
- 305no vehicle
- 3,7111 vehicle
- 8,1622 vehicles
- 3,8123 vehicles
- 1,4434 vehicles
- 1,0305+ vehicles

- Cars and other vehicles available in Hendersonville in renter-occupied apartments
- 324no vehicle
- 3,4391 vehicle
- 2,6022 vehicles
- 6793 vehicles
- 1204 vehicles
- 1065+ vehicles

- Rooms in owner-occupied houses in Hendersonville, Tennessee
- 571 room
- 172 rooms
- 833 rooms
- 5354 rooms
- 2,3025 rooms
- 3,7546 rooms
- 3,5317 rooms
- 3,6038 rooms
- 4,5809+ rooms

- Rooms in renter-occupied apartments in Hendersonville, Tennessee
- 3081 room
- 4822 rooms
- 1,6373 rooms
- 1,7184 rooms
- 1,2265 rooms
- 8466 rooms
- 4107 rooms
- 3108 rooms
- 3349+ rooms


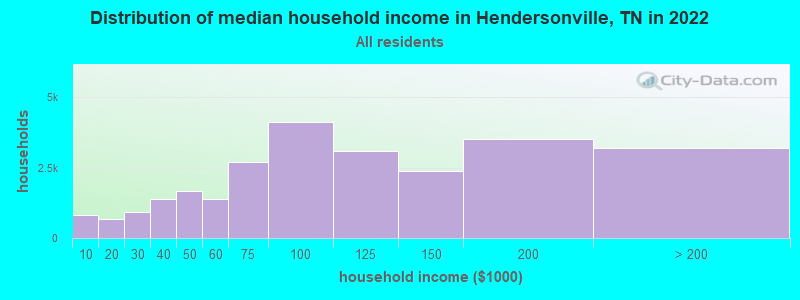
Hendersonville, TN household income distribution

- 817Less than $10,000
- 674$10,000 to $19,999
- 914$20,000 to $29,999
- 1,394$30,000 to $39,999
- 1,688$40,000 to $49,999
- 1,392$50,000 to $59,999
- 2,686$60,000 to $74,999
- 4,126$75,000 to $99,999
- 3,108$100,000 to $124,999
- 2,390$125,000 to $149,999
- 3,520$150,000 to $199,999
- 3,199$200,000 or more
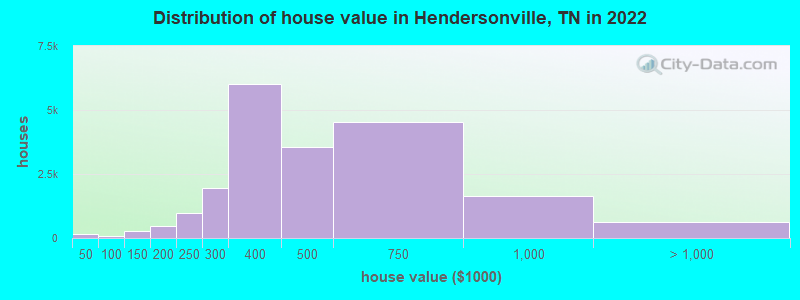
Home value of owner - occupied houses in 2022 in Hendersonville, TN
-
- 70Less than $10,000
- 17$10,000 to $14,999
- 5$15,000 to $19,999
- 16$25,000 to $29,999
- 11$30,000 to $34,999
- 10$35,000 to $39,999
- 24$40,000 to $49,999
- 20$50,000 to $59,999
- 28$80,000 to $89,999
- 14$90,000 to $99,999
- 66$100,000 to $124,999
- 214$125,000 to $149,999
- 152$150,000 to $174,999
- 323$175,000 to $199,999
- 991$200,000 to $249,999
- 1,947$250,000 to $299,999
- 6,013$300,000 to $399,999
- 3,539$400,000 to $499,999
- 4,544$500,000 to $749,999
- 1,653$750,000 to $999,999
- 576$1,000,000 to $1,499,999
- 15$1,500,000 to $1,999,999
- 17$2,000,000 or more
Rent paid by renters in 2022 in Hendersonville, TN
-
- 45Less than $100
- 44$100 to $149
- 21$150 to $199
- 132$200 to $249
- 20$300 to $349
- 8$350 to $399
- 35$400 to $449
- 6$450 to $499
- 80$500 to $549
- 19$550 to $599
- 87$600 to $649
- 48$650 to $699
- 278$700 to $749
- 21$750 to $799
- 112$800 to $899
- 519$900 to $999
- 2,111$1,000 to $1,249
- 1,259$1,250 to $1,499
- 1,818$1,500 to $1,999
- 563$2,000 to $2,499
- 9$2,500 to $2,999
- 18$3,000 to $3,499
- 62$3,500 or more
- 152No cash rent


Percentage of workers working in this county: 58.8%
Number of people working at home: 8,147 (24.2% of all workers)
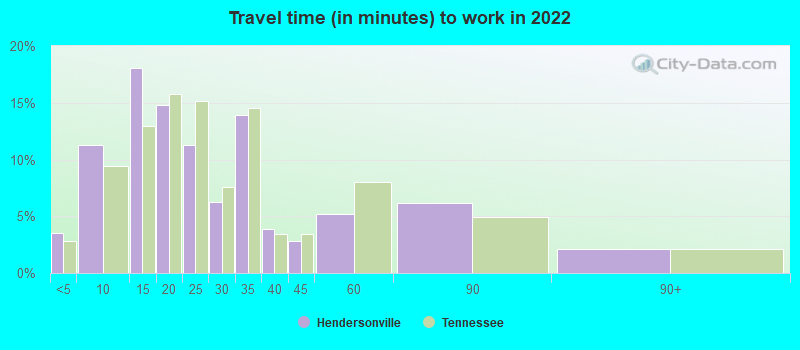
Travel time to work (commute)
- Less than 5 minutes: 654
- 5 to 9 minutes: 2,628
- 10 to 14 minutes: 3,599
- 15 to 19 minutes: 2,746
- 20 to 24 minutes: 2,308
- 25 to 29 minutes: 1,534
- 30 to 34 minutes: 3,825
- 35 to 39 minutes: 1,602
- 40 to 44 minutes: 1,197
- 45 to 59 minutes: 3,934
- 60 to 89 minutes: 1,928
- 90 or more minutes: 305
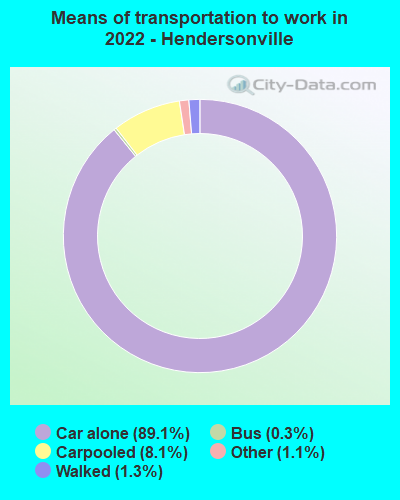
Means of transportation to work:
- Drove a car alone: 18,655 (68.7%)
- Carpooled: 1,801 (6.6%)
- Bus: 54 (0.2%)
- Taxi: 277 (1.0%)
- Bicycle: 21 (0.1%)
- Walked: 274 (1.0%)
- Worked at home: 7,110 (26.2%)

- Unemployment by race in 2022
- Unemployment rate for White non-Hispanic residents
- 2.9%Males
- 2.3%Females
- Unemployment rate for Black residents
- 1.9%Females
- Unemployment rate for American Indian and Alaska Native residents
- 100.0%Females
- Unemployment rate for Asian residents
- 3.6%Females
- Unemployment rate for other race residents
- 9.1%Females
- Unemployment rate for two or more race residents
- 4.1%Males
- Unemployment rate for Hispanic or Latino residents
- 4.3%Males
- 2.1%Females

- Year of entry for the foreign-born population in Hendersonville, Tennessee
- 9212010 or later
- 6342000 to 2009
- 8351990 to 1999
- 2581980 to 1989
- 2101970 to 1979
- 201Before 1970
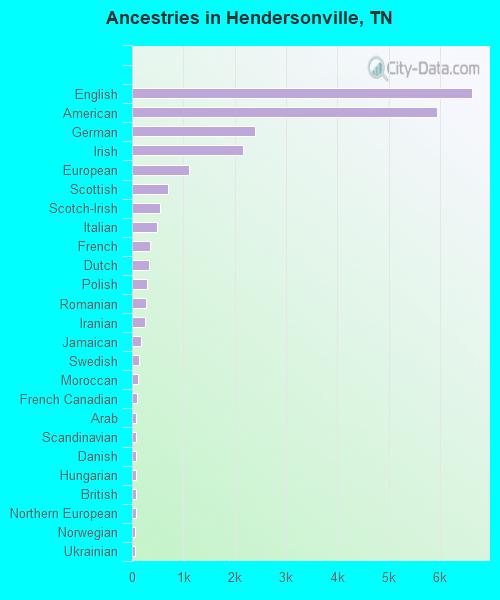
First ancestries reported:
- English: 6,627 (21.4%)
- American: 5,952 (19.2%)
- German: 2,396 (7.7%)
- Irish: 2,168 (7.0%)
- European: 1,120 (3.6%)
- Scottish: 702 (2.3%)
- Scotch-Irish: 554 (1.8%)
- Italian: 488 (1.6%)
- French: 343 (1.1%)
- Dutch: 332 (1.1%)
- Polish: 289 (0.9%)
- Romanian: 264 (0.9%)
- Iranian: 250 (0.8%)
- Jamaican: 171 (0.6%)
- Swedish: 133 (0.4%)
- Moroccan: 124 (0.4%)
- French Canadian: 89 (0.3%)
- Arab: 86 (0.3%)
- Scandinavian: 86 (0.3%)
- Danish: 85 (0.3%)
- Hungarian: 80 (0.3%)
- British: 73 (0.2%)
- Northern European: 71 (0.2%)
- Norwegian: 63 (0.2%)
- Ukrainian: 63 (0.2%)
- African: 58 (0.2%)
- Luxembourger: 50 (0.2%)
- West Indian: 50 (0.2%)
- Turkish: 47 (0.2%)
- Swiss: 39 (0.1%)
- Greek: 37 (0.1%)
- Bahamian: 34 (0.1%)
- Welsh: 33 (0.1%)
- U.S. Virgin Islander: 29 (0.09%)
- Belgian: 27 (0.09%)
- Russian: 24 (0.08%)
- Canadian: 24 (0.08%)
- Eastern European: 18 (0.06%)
- Czechoslovakian: 14 (0.05%)
- Brazilian: 11 (0.04%)
- Austrian: 11 (0.04%)
- Celtic: 10 (0.03%)
- Croatian: 7 (0.02%)
- Lithuanian: 7 (0.02%)
Most common places of birth for foreign-born residents (%):
| Hendersonville: | 13.4% (412) |
| Tennessee: | 23.0% (86,435) |
| Hendersonville: | 9.8% (303) |
| Tennessee: | 1.6% (5,936) |
| Hendersonville: | 9.6% (297) |
| Tennessee: | 2.7% (10,313) |
| Hendersonville: | 8.9% (273) |
| Tennessee: | 0.4% (1,593) |
| Hendersonville: | 5.6% (174) |
| Tennessee: | 6.1% (23,079) |
| Hendersonville: | 5.5% (168) |
| Tennessee: | 2.2% (8,261) |
| Hendersonville: | 3.8% (118) |
| Tennessee: | 0.6% (2,405) |
| Hendersonville: | 3.7% (113) |
| Tennessee: | 0.2% (634) |
| Hendersonville: | 3.6% (111) |
| Tennessee: | 2.3% (8,490) |
| Hendersonville: | 3.4% (106) |
| Tennessee: | 0.3% (980) |
| Hendersonville: | 2.6% (81) |
| Tennessee: | 2.7% (10,295) |
| Hendersonville: | 2.3% (72) |
| Tennessee: | 0.3% (1,195) |
| Hendersonville: | 2.3% (70) |
| Tennessee: | 1.2% (4,662) |
| Hendersonville: | 2.3% (70) |
| Tennessee: | 0.6% (2,336) |
| Hendersonville: | 2.1% (65) |
| Tennessee: | 0.8% (3,002) |
| Hendersonville: | 1.9% (58) |
| Tennessee: | 3.1% (11,640) |
| Hendersonville: | 1.9% (57) |
| Tennessee: | 0.2% (928) |
| Hendersonville: | 1.7% (52) |
| Tennessee: | 0.0% (171) |
Place of birth for U.S.-born residents:
- This state: 29,849
- Other state: 30,545
- Northeast: 4,986
- Midwest: 10,749
- South: 11,369
- West: 3,495
86.1% of Hendersonville residents lived in the same house 1 years ago.
Out of people who lived in different houses, 30.7% lived in this county.
Out of people who lived in different counties, 70.3% lived in Tennessee.
| Hendersonville: | 86.1% |
| State average: | 87.0% |
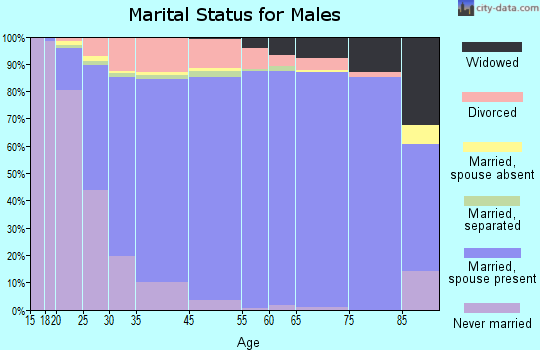
Education attainment for males 25 years and older:
- No schooling: 73
- Nursery to 4th grade: 36
- 5th and 6th grade: 21
- 7th and 8th grade: 73
- 9th grade: 73
- 10th grade: 190
- 11th grade: 156
- 12th grade, no diploma: 239
- High school graduate (or equivalency): 4,659
- Less than 1 year of college: 1,910
- Some college more than 1 year, no degree: 3,435
- Associate degree: 1,527
- Bachelor's degree: 6,351
- Master's degree: 1,605
- Professional school degree: 573
- Doctorate degree: 598

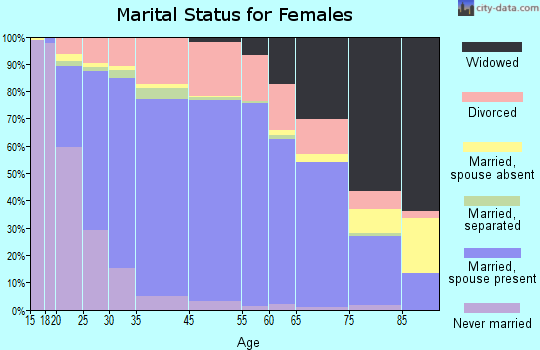
Education attainment for females 25 years and older:
- No schooling: 80
- Nursery to 4th grade: 13
- 5th and 6th grade: 0
- 7th and 8th grade: 100
- 9th grade: 92
- 10th grade: 172
- 11th grade: 261
- 12th grade, no diploma: 251
- High school graduate (or equivalency): 5,170
- Less than 1 year of college: 1,430
- Some college more than 1 year, no degree: 2,755
- Associate degree: 2,789
- Bachelor's degree: 7,617
- Master's degree: 3,511
- Professional school degree: 96
- Doctorate degree: 308

Housing units in structures:
- One, detached: 19,661
- One, attached: 907
- Two: 194
- 3 or 4: 624
- 5 to 9: 1,286
- 10 to 19: 1,278
- 20 to 49: 1,362
- 50 or more: 1,292
- Mobile homes: 197
Median worth of mobile homes: $47,697
Housing units lacking complete kitchen facilities in 2022: 1.1%
House/condo owner moved in on average 10 years ago
Renter moved in on average 3 years ago

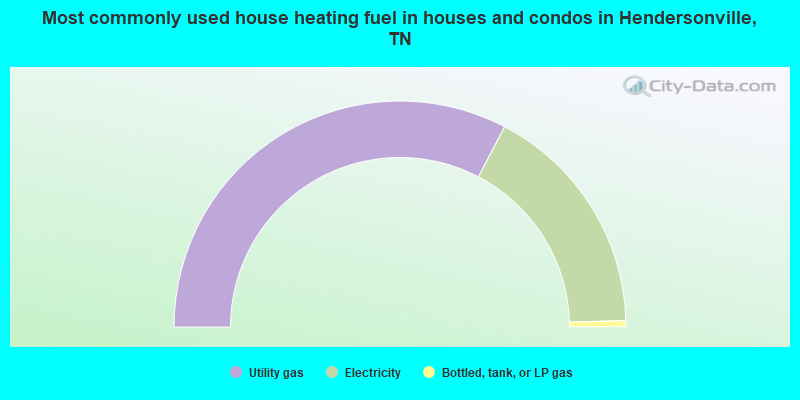
- 65.2%Utility gas
- 33.7%Electricity
- 0.9%Bottled, tank, or LP gas
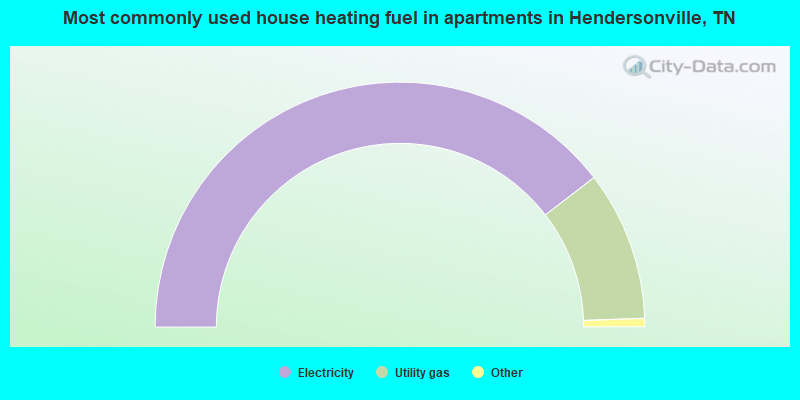
- 79.2%Electricity
- 19.8%Utility gas
- 0.9%No fuel used
- 0.2%Bottled, tank, or LP gas
Private vs. public school enrollment:
| Here: | 16.0% |
| Tennessee: | 15.0% |
| Here: | 15.4% |
| Tennessee: | 16.2% |
| Here: | 24.4% |
| Tennessee: | 23.5% |


