Herrick, IL (Illinois) Houses and Residents
| Herrick: | $70,397 |
| Illinois: | $251,600 |
Mean price in 2022:
Detached houses: $77,420
Here: $77,420 State: $310,164 Mobile homes: $56,765
Here: $56,765 State: $78,855
Total population: 429 (Urban population: 0, Rural population: 540 (all nonfarm))
Houses: 158 (140 occupied: 126 owner occupied, 16 renter occupied)
| % of renters here: | 11% |
| State: | 33% |
Housing density: 435 houses/condos per square mile
Median price asked for vacant for-sale houses and condos in 2022 in this county: $98,226.
Median contract rent in 2022: $413
Median rent asked for vacant for-rent units in 2022: $565
Median gross rent in Herrick, IL in 2022: $590
Housing units in Herrick with a mortgage: 65 (2 second mortgage, 0 home equity loan, 0 both second mortgage and home equity loan)
Houses without a mortgage: 0
Median household income for houses/condos with a mortgage: $65,870
Median household income for apartments without a mortgage: $33,071
Median monthly housing costs: $665
Compare current foreclosures near Herrick, IL:
| Photo | Address | Area | Beds / Baths | Price | Details |
|---|---|---|---|---|---|

|
#1
N Long St
Shelbyville, IL 62565
|
- sq. feet
|
2 baths 2 beds |
show details | |

|
#2
E North 3rd St
Shelbyville, IL 62565
|
520 sq. feet
|
1 baths 2 beds |
show details | |

|
#3
S Sweazy St
Beecher City, IL 62414
|
1,077 sq. feet
|
- baths - beds |
show details | |

|
#4
N Rosamond Ave
Rosamond, IL 62083
|
1,176 sq. feet
|
- baths - beds |
show details | |

|
#5
E 3250 Ave
Ramsey, IL 62080
|
- sq. feet
|
- baths - beds |
show details | |

|
#6
N Main St
Saint Elmo, IL 62458
|
- sq. feet
|
- baths - beds |
show details | |

|
#7
N Main St
Saint Elmo, IL 62458
|
1,868 sq. feet
|
- baths - beds |
show details | |

|
#8
E 4th St
Saint Elmo, IL 62458
|
- sq. feet
|
- baths - beds |
show details | |

|
#9
E Ash St
Brownstown, IL 62418
|
1,608 sq. feet
|
- baths - beds |
show details | |

|
#10
W North 3rd St
Shelbyville, IL 62565
|
- sq. feet
|
- baths - beds |
show details |
| Photo | Address | Area | Beds / Baths | Price | Details |
|---|---|---|---|---|---|

|
#11
E 11th St
Saint Elmo, IL 62458
|
- sq. feet
|
- baths - beds |
show details | |

|
#12
W Elm St
Altamont, IL 62411
|
- sq. feet
|
- baths - beds |
show details | |

|
#13
E 1650 North Rd
Tower Hill, IL 62571
|
- sq. feet
|
- baths - beds |
show details | |

|
#14
Us Highway 40
Brownstown, IL 62418
|
- sq. feet
|
- baths - beds |
show details | |

|
#15
S 3rd St
Altamont, IL 62411
|
- sq. feet
|
- baths - beds |
show details | |

|
#16
S Oak St
Nokomis, IL 62075
|
- sq. feet
|
- baths - beds |
show details | |

|
#17
E 650 North Rd
Pana, IL 62557
|
- sq. feet
|
- baths - beds |
show details | |

|
#18
E 10th St
Saint Elmo, IL 62458
|
- sq. feet
|
- baths - beds |
show details | |

|
#19
Circle Dr
Saint Elmo, IL 62458
|
1,425 sq. feet
|
- baths - beds |
show details | |

|
#20
S Front St
Ramsey, IL 62080
|
1,744 sq. feet
|
- baths - beds |
show details |
| Photo | Address | Area | Beds / Baths | Price | Details |
|---|---|---|---|---|---|

|
#21
E 3rd St
Ramsey, IL 62080
|
- sq. feet
|
- baths - beds |
show details | |

|
#22
E 3rd St
Ramsey, IL 62080
|
- sq. feet
|
- baths - beds |
show details | |

|
#23
Birch Ave, Trlr 1
Pana, IL 62557
|
- sq. feet
|
- baths - beds |
show details | |

|
#24
N Wyandotte St Apt D
Beecher City, IL 62414
|
- sq. feet
|
- baths - beds |
show details | |

|
#25
State Highway 16
Shelbyville, IL 62565
|
- sq. feet
|
- baths - beds |
show details | |

|
#26
S Front St
Ramsey, IL 62080
|
682 sq. feet
|
- baths - beds |
show details | |

|
#27
S Front St
Ramsey, IL 62080
|
- sq. feet
|
- baths - beds |
show details | |

|
#28
N Broadway St
Shelbyville, IL 62565
|
- sq. feet
|
- baths - beds |
show details | |

|
#29
2 Box 124a
Ramsey, IL 62080
|
- sq. feet
|
- baths - beds |
show details | |

|
#30
N Long St
Shelbyville, IL 62565
|
- sq. feet
|
- baths - beds |
show details |
| Photo | Address | Area | Beds / Baths | Price | Details |
|---|---|---|---|---|---|

|
#31
Capps Ave
Nokomis, IL 62075
|
- sq. feet
|
- baths - beds |
show details | |

|
#32
Oak Valley Rd
Ramsey, IL 62080
|
- sq. feet
|
- baths - beds |
show details | |

|
#33
W John Adams Ave
Altamont, IL 62411
|
- sq. feet
|
- baths - beds |
show details | |

|
#34
N 2250 St
Saint Elmo, IL 62458
|
- sq. feet
|
- baths - beds |
show details | |

|
#35
E 3100 Ave
Ramsey, IL 62080
|
- sq. feet
|
- baths - beds |
show details | |

|
#36
E 2595 Ave
Ramsey, IL 62080
|
- sq. feet
|
- baths - beds |
show details | |

|
#37
E 2100th Ave
Beecher City, IL 62414
|
- sq. feet
|
- baths - beds |
show details | |

|
#38
Michaels St
Pana, IL 62557
|
- sq. feet
|
- baths - beds |
show details | |

|
#39
S Edwards St
Altamont, IL 62411
|
- sq. feet
|
- baths - beds |
show details | |

|
Check over 1 million property listings on Foreclosure.com!
|
browse all offers | |||

Latest news about housing in Herrick, IL collected exclusively by city-data.com from local newspapers, TV, and radio stations


Median year apartment built: 1968
Household type by relationship:
Households: 367- Male householders: 79 (21 living alone), Female householders: 58 (6 living alone)
78 spouses (78 opposite-sex spouses), 8 unmarried partners, (8 opposite-sex unmarried partners), 121 children (114 natural, 0 adopted, 6 stepchildren), 8 grandchildren, 0 brothers or sisters, 0 parents, 0 foster children, 5 other relatives, 5 non-relatives
Size of family households: 38 2-persons, 23 3-persons, 37 4-persons, 1 5-persons, 3 7-or-more-persons.
Size of nonfamily households: 30 1-person, 8 2-persons.
60 married couples with children.
39 single-parent households (10 men, 29 women).
99.4% of residents of Herrick speak English at home.
| Here: | 6.1 |
| State: | 6.4 |
| Here: | 5.7 |
| State: | 4.1 |

- Bedrooms in owner-occupied houses and condos in Herrick, Illinois
- 7no bedroom
- 21 bedroom
- 452 bedrooms
- 603 bedrooms
- 114 bedrooms
- 15+ bedrooms

- Bedrooms in renter-occupied apartments in Herrick, Illinois
- 0no bedroom
- 01 bedroom
- 102 bedrooms
- 63 bedrooms
- 04 bedrooms
- 05+ bedrooms

- Cars and other vehicles available in Herrick in owner-occupied houses/condos
- 1no vehicle
- 391 vehicle
- 482 vehicles
- 253 vehicles
- 94 vehicles
- 45+ vehicles

- Cars and other vehicles available in Herrick in renter-occupied apartments
- 0no vehicle
- 71 vehicle
- 22 vehicles
- 53 vehicles
- 24 vehicles
- 05+ vehicles

- Rooms in owner-occupied houses in Herrick, Illinois
- 71 room
- 22 rooms
- 13 rooms
- 274 rooms
- 135 rooms
- 206 rooms
- 187 rooms
- 48 rooms
- 339+ rooms

- Rooms in renter-occupied apartments in Herrick, Illinois
- 01 room
- 02 rooms
- 03 rooms
- 54 rooms
- 25 rooms
- 36 rooms
- 07 rooms
- 28 rooms
- 49+ rooms


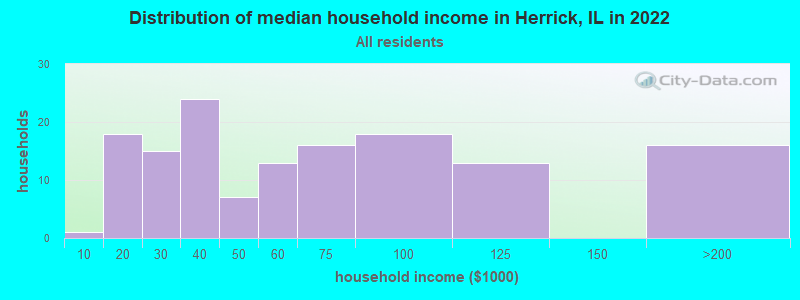
Herrick, IL household income distribution

- 1Less than $10,000
- 18$10,000 to $19,999
- 15$20,000 to $29,999
- 24$30,000 to $39,999
- 7$40,000 to $49,999
- 13$50,000 to $59,999
- 16$60,000 to $74,999
- 18$75,000 to $99,999
- 13$100,000 to $124,999
- 16$150,000 to $199,999
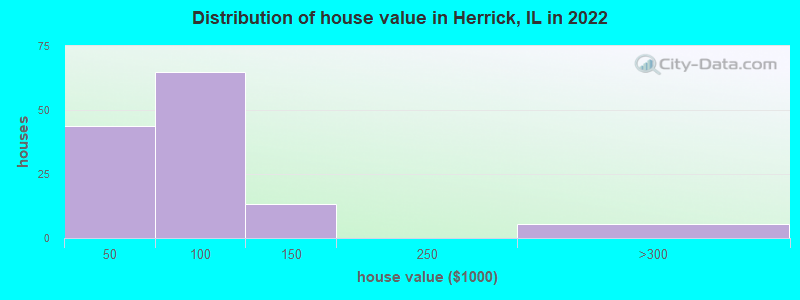
Home value of owner - occupied houses in 2022 in Herrick, IL
-
- 3Less than $10,000
- 4$10,000 to $14,999
- 8$15,000 to $19,999
- 20$20,000 to $24,999
- 0$25,000 to $29,999
- 1$30,000 to $34,999
- 3$35,000 to $39,999
- 0$40,000 to $49,999
- 9$50,000 to $59,999
- 15$60,000 to $69,999
- 16$70,000 to $79,999
- 15$80,000 to $89,999
- 6$90,000 to $99,999
- 8$100,000 to $124,999
- 4$125,000 to $149,999
- 5$250,000 to $299,999
Rent paid by renters in 2022 in Herrick, IL
-
- 1$100 to $149
- 8$400 to $449
- 7No cash rent


Percentage of workers working in this county: 36.5%
Number of people working at home: 10 (6.8% of all workers)
Travel time to work (commute)
- Less than 5 minutes: 17
- 5 to 9 minutes: 2
- 10 to 14 minutes: 7
- 15 to 19 minutes: 2
- 20 to 24 minutes: 5
- 25 to 29 minutes: 8
- 30 to 34 minutes: 8
- 35 to 39 minutes: 10
- 40 to 44 minutes: 9
- 45 to 59 minutes: 24
- 60 to 89 minutes: 18
- 90 or more minutes: 14
Means of transportation to work:
- Drove a car alone: 111 (66.9%)
- Carpooled: 45 (27.1%)
- Bus or trolley bus: 4 (2.4%)
- Walked: 5 (3.0%)
- Other means: 1 (0.6%)

- Unemployment by race in 2022
- Unemployment rate for White non-Hispanic residents
- 4.8%Males
- 5.8%Females

First ancestries reported:
- American: 67 (45.1%)
- German: 38 (25.6%)
- English: 9 (6.1%)
- Irish: 7 (4.7%)
- French Canadian: 1 (0.7%)
- Italian: 1 (0.7%)
- Scandinavian: 1 (0.7%)
- Slovak: 1 (0.7%)
Place of birth for U.S.-born residents:
- This state: 336
- Other state: 26
- Northeast: 2
- Midwest: 11
- South: 5
- West: 8
96.4% of Herrick residents lived in the same house 1 years ago.
Out of people who lived in different houses, 45.5% lived in this county.
Out of people who lived in different counties, 0.0% lived in Illinois.
| Herrick: | 96.4% |
| State average: | 88.3% |
Education attainment for males 25 years and older:
- No schooling: 1
- Nursery to 4th grade: 0
- 5th and 6th grade: 0
- 7th and 8th grade: 0
- 9th grade: 0
- 10th grade: 3
- 11th grade: 1
- 12th grade, no diploma: 2
- High school graduate (or equivalency): 73
- Less than 1 year of college: 9
- Some college more than 1 year, no degree: 5
- Associate degree: 9
- Bachelor's degree: 7
- Master's degree: 6
- Professional school degree: 0
- Doctorate degree: 0

Education attainment for females 25 years and older:
- No schooling: 0
- Nursery to 4th grade: 0
- 5th and 6th grade: 0
- 7th and 8th grade: 0
- 9th grade: 1
- 10th grade: 1
- 11th grade: 4
- 12th grade, no diploma: 2
- High school graduate (or equivalency): 55
- Less than 1 year of college: 0
- Some college more than 1 year, no degree: 9
- Associate degree: 20
- Bachelor's degree: 26
- Master's degree: 0
- Professional school degree: 0
- Doctorate degree: 0


Housing units in structures:
- One, detached: 101
- Two: 3
- Mobile homes: 54
Housing units lacking complete kitchen facilities in 2022: 4.4%
House/condo owner moved in on average 7 years ago
Renter moved in on average 7 years ago

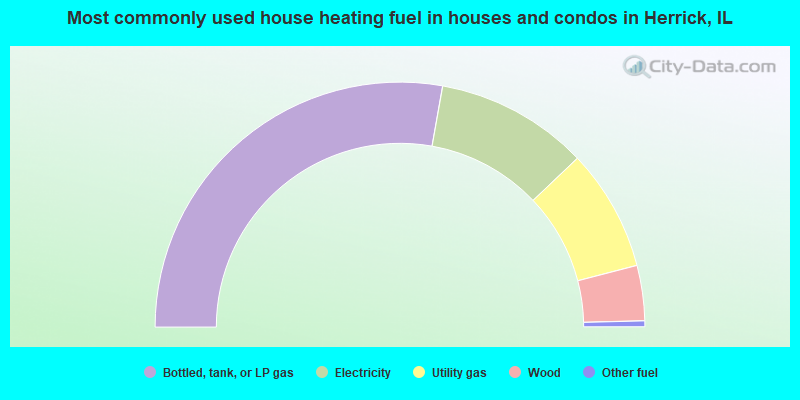
- 55.6%Bottled, tank, or LP gas
- 20.2%Electricity
- 16.1%Utility gas
- 7.3%Wood
- 0.8%Other fuel
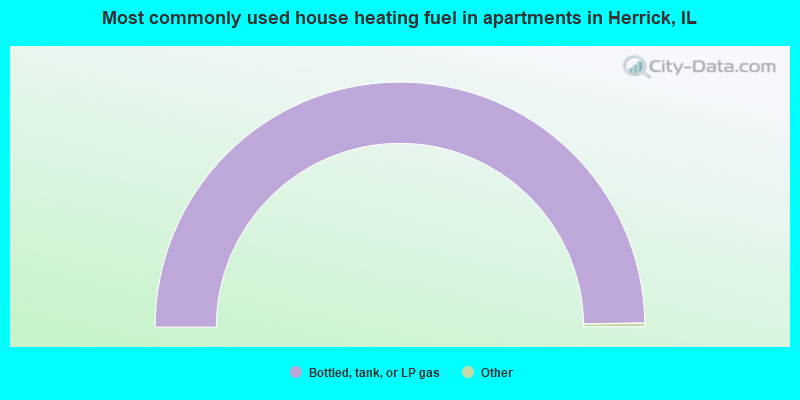
- 100.0%Bottled, tank, or LP gas
Private vs. public school enrollment:
| Here: | 4.8% |
| Illinois: | 13.3% |
| Here: | 0.0% |
| Illinois: | 9.9% |
| Here: | 28.6% |
| Illinois: | 27.4% |


