Hooppole, IL (Illinois) Houses and Residents
| Hooppole: | $73,660 |
| Illinois: | $251,600 |
Mean price in 2022:
Detached houses: $69,757
Here: $69,757 State: $310,164
Total population: 201 (Urban population: 0, Rural population: 163 (all nonfarm))
Houses: 76 (70 occupied: 67 owner occupied, 4 renter occupied)
| % of renters here: | 6% |
| State: | 33% |
Housing density: 219 houses/condos per square mile
Median price asked for vacant for-sale houses and condos in 2022 in this county: $76,206.
Median gross rent in Hooppole, IL in 2022: $-661,577,607
Housing units in Hooppole with a mortgage: 49 (0 second mortgage, 0 home equity loan, 0 both second mortgage and home equity loan)
Houses without a mortgage: 1
Median household income for houses/condos with a mortgage: $37,290
Median household income for apartments without a mortgage: $76,486
Median monthly housing costs: $737
Compare current foreclosures near Hooppole, IL:
| Photo | Address | Area | Beds / Baths | Price | Details |
|---|---|---|---|---|---|

|
#1
E 2nd St
Tampico, IL 61283
|
1,008 sq. feet
|
1 baths 3 beds |
$127,000
|
show details |

|
#2
S Henry St
Geneseo, IL 61254
|
968 sq. feet
|
1 baths 3 beds |
show details | |

|
#3
Ridge Rd
Rock Falls, IL 61071
|
1,609 sq. feet
|
1 baths 4 beds |
show details | |

|
#4
Main St
Erie, IL 61250
|
1,397 sq. feet
|
1 baths 3 beds |
show details | |

|
#5
E Park St
Geneseo, IL 61254
|
1,434 sq. feet
|
1 baths 2 beds |
show details | |

|
#6
Goldfinch Ct
Geneseo, IL 61254
|
3,240 sq. feet
|
1 baths 5 beds |
show details | |

|
#7
W Exchange St
Geneseo, IL 61254
|
960 sq. feet
|
1 baths 2 beds |
show details | |

|
#8
2nd St
Hillsdale, IL 61257
|
1,080 sq. feet
|
- baths - beds |
show details | |

|
#9
300 East St
Sheffield, IL 61361
|
- sq. feet
|
- baths - beds |
show details | |

|
#10
Olivia Dr, Apt 214
Geneseo, IL 61254
|
- sq. feet
|
- baths - beds |
show details |
| Photo | Address | Area | Beds / Baths | Price | Details |
|---|---|---|---|---|---|

|
#11
W 6th St
Prophetstown, IL 61277
|
- sq. feet
|
- baths - beds |
show details | |

|
#12
Luther Rd
Rock Falls, IL 61071
|
- sq. feet
|
- baths - beds |
show details | |

|
#13
E Orange St
Geneseo, IL 61254
|
- sq. feet
|
- baths - beds |
show details | |

|
#14
Anderson Rd
Prophetstown, IL 61277
|
- sq. feet
|
- baths - beds |
show details | |

|
#15
E Commercial St
Lyndon, IL 61261
|
- sq. feet
|
- baths - beds |
show details | |

|
#16
N 4th St
Neponset, IL 61345
|
- sq. feet
|
- baths - beds |
show details | |

|
#17
4th St
Hillsdale, IL 61257
|
- sq. feet
|
- baths - beds |
show details | |

|
#18
N Main St
Manlius, IL 61338
|
- sq. feet
|
- baths - beds |
show details | |

|
#19
S Mason St
Sheffield, IL 61361
|
- sq. feet
|
- baths - beds |
show details | |

|
#20
Hoover Rd
Rock Falls, IL 61071
|
- sq. feet
|
- baths - beds |
show details |
| Photo | Address | Area | Beds / Baths | Price | Details |
|---|---|---|---|---|---|

|
#21
Mc Donald St
Walnut, IL 61376
|
- sq. feet
|
- baths - beds |
show details | |

|
#22
Main St
Hillsdale, IL 61257
|
- sq. feet
|
- baths - beds |
show details | |

|
#23
Perkins Rd
Prophetstown, IL 61277
|
- sq. feet
|
- baths - beds |
show details | |

|
#24
Ridge Rd
Rock Falls, IL 61071
|
- sq. feet
|
- baths - beds |
show details | |

|
#25
S 4th St
Manlius, IL 61338
|
- sq. feet
|
- baths - beds |
show details | |

|
#26
E Kimball Rd
Tampico, IL 61283
|
- sq. feet
|
- baths - beds |
show details | |

|
#27
Highland Ave
Erie, IL 61250
|
- sq. feet
|
- baths - beds |
show details | |

|
#28
Market St
Prophetstown, IL 61277
|
- sq. feet
|
- baths - beds |
show details | |

|
#29
Locust St
Prophetstown, IL 61277
|
- sq. feet
|
- baths - beds |
show details | |

|
#30
Woodlawn Dr
Prophetstown, IL 61277
|
- sq. feet
|
- baths - beds |
show details |
| Photo | Address | Area | Beds / Baths | Price | Details |
|---|---|---|---|---|---|

|
#31
Depot St
Walnut, IL 61376
|
- sq. feet
|
- baths - beds |
show details | |

|
Check over 1 million property listings on Foreclosure.com!
|
browse all offers | |||

Latest news about housing in Hooppole, IL collected exclusively by city-data.com from local newspapers, TV, and radio stations


Household type by relationship:
Households: 185- Male householders: 42 (23 living alone), Female householders: 26 (15 living alone)
27 spouses (27 opposite-sex spouses), 7 unmarried partners, (7 opposite-sex unmarried partners), 40 children (23 natural, 0 adopted, 16 stepchildren), 0 grandchildren, 0 brothers or sisters, 0 parents, 0 foster children, 0 other relatives, 39 non-relatives
Size of family households: 6 2-persons, 4 3-persons, 13 4-persons, 2 5-persons.
Size of nonfamily households: 41 1-person, 3 7-or-more-persons.
32 married couples with children.
1 single-parent households (0 men, 1 women).
98.9% of residents of Hooppole speak English at home.
| Here: | 6.5 |
| State: | 6.4 |
| Here: | -650793650.1 |
| State: | 4.1 |

- Bedrooms in owner-occupied houses and condos in Hooppole, Illinois
- 0no bedroom
- 11 bedroom
- 302 bedrooms
- 143 bedrooms
- 184 bedrooms
- 45+ bedrooms

- Bedrooms in renter-occupied apartments in Hooppole, Illinois
- 0no bedroom
- 01 bedroom
- 02 bedrooms
- 43 bedrooms
- 04 bedrooms
- 05+ bedrooms

- Cars and other vehicles available in Hooppole in owner-occupied houses/condos
- 1no vehicle
- 241 vehicle
- 62 vehicles
- 353 vehicles
- 04 vehicles
- 15+ vehicles

- Cars and other vehicles available in Hooppole in renter-occupied apartments
- 0no vehicle
- 01 vehicle
- 02 vehicles
- 13 vehicles
- 34 vehicles
- 05+ vehicles

- Rooms in owner-occupied houses in Hooppole, Illinois
- 01 room
- 02 rooms
- 13 rooms
- 24 rooms
- 15 rooms
- 306 rooms
- 77 rooms
- 68 rooms
- 209+ rooms

- Rooms in renter-occupied apartments in Hooppole, Illinois
- 01 room
- 02 rooms
- 03 rooms
- 34 rooms
- 05 rooms
- 06 rooms
- 17 rooms
- 08 rooms
- 09+ rooms


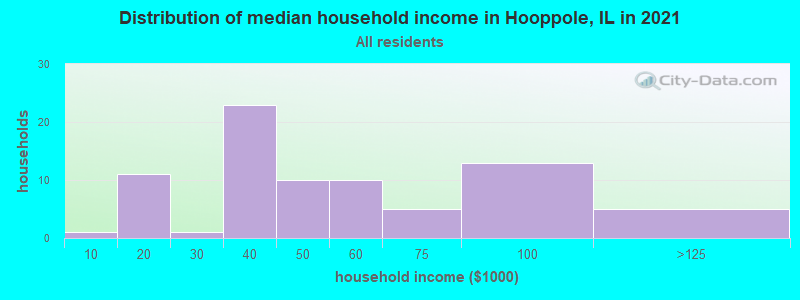
Hooppole, IL household income distribution

- 1Less than $10,000
- 11$10,000 to $19,999
- 2$20,000 to $29,999
- 26$30,000 to $39,999
- 3$40,000 to $49,999
- 9$50,000 to $59,999
- 3$60,000 to $74,999
- 9$75,000 to $99,999
- 2$100,000 to $124,999
- 4$125,000 to $149,999
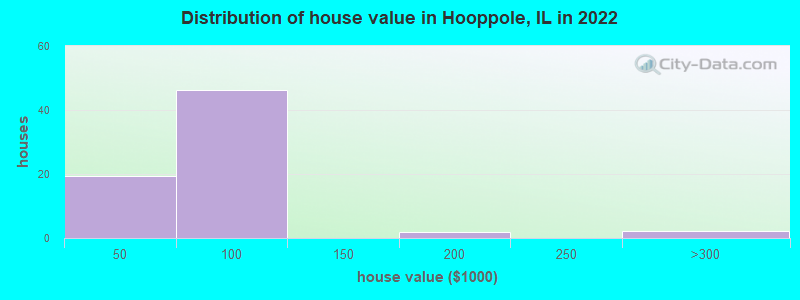
Home value of owner - occupied houses in 2022 in Hooppole, IL
-
- 10Less than $10,000
- 5$30,000 to $34,999
- 2$40,000 to $49,999
- 9$50,000 to $59,999
- 3$60,000 to $69,999
- 5$70,000 to $79,999
- 23$80,000 to $89,999
- 0$90,000 to $99,999
- 1$175,000 to $199,999
- 2$250,000 to $299,999
Rent paid by renters in 2022 in Hooppole, IL
-
- 1$500 to $549
- 2$700 to $749


Percentage of workers working in this county: 53.2%
Number of people working at home: 14 (18.2% of all workers)
Travel time to work (commute)
- Less than 5 minutes: 0
- 5 to 9 minutes: 0
- 10 to 14 minutes: 1
- 15 to 19 minutes: 1
- 20 to 24 minutes: 1
- 25 to 29 minutes: 22
- 30 to 34 minutes: 3
- 35 to 39 minutes: 3
- 40 to 44 minutes: 0
- 45 to 59 minutes: 25
- 60 to 89 minutes: 0
- 90 or more minutes: 0
Means of transportation to work:
- Drove a car alone: 58 (64.4%)
- Carpooled: 22 (24.4%)
- Walked: 2 (2.2%)
- Other means: 5 (5.6%)
- Worked at home: 3 (3.3%)

- Unemployment by race in 2022
- Unemployment rate for White non-Hispanic residents
- 1.5%Males
- 2.7%Females

First ancestries reported:
- German: 26 (48.4%)
- Irish: 15 (27.9%)
- English: 4 (7.5%)
Place of birth for U.S.-born residents:
- This state: 143
- Other state: 41
- Northeast: 2
- Midwest: 30
- South: 2
- West: 7
73.5% of Hooppole residents lived in the same house 1 years ago.
Out of people who lived in different houses, 41.2% lived in this county.
Out of people who lived in different counties, 50.0% lived in Illinois.
| Hooppole: | 73.5% |
| State average: | 88.3% |
Education attainment for males 25 years and older:
- No schooling: 0
- Nursery to 4th grade: 0
- 5th and 6th grade: 0
- 7th and 8th grade: 0
- 9th grade: 0
- 10th grade: 0
- 11th grade: 1
- 12th grade, no diploma: 1
- High school graduate (or equivalency): 35
- Less than 1 year of college: 1
- Some college more than 1 year, no degree: 9
- Associate degree: 22
- Bachelor's degree: 2
- Master's degree: 0
- Professional school degree: 0
- Doctorate degree: 0

Education attainment for females 25 years and older:
- No schooling: 0
- Nursery to 4th grade: 1
- 5th and 6th grade: 0
- 7th and 8th grade: 0
- 9th grade: 0
- 10th grade: 0
- 11th grade: 0
- 12th grade, no diploma: 0
- High school graduate (or equivalency): 27
- Less than 1 year of college: 7
- Some college more than 1 year, no degree: 11
- Associate degree: 3
- Bachelor's degree: 6
- Master's degree: 0
- Professional school degree: 0
- Doctorate degree: 0


Housing units in structures:
- One, detached: 76
Housing units lacking complete kitchen facilities in 2022: 7.9%

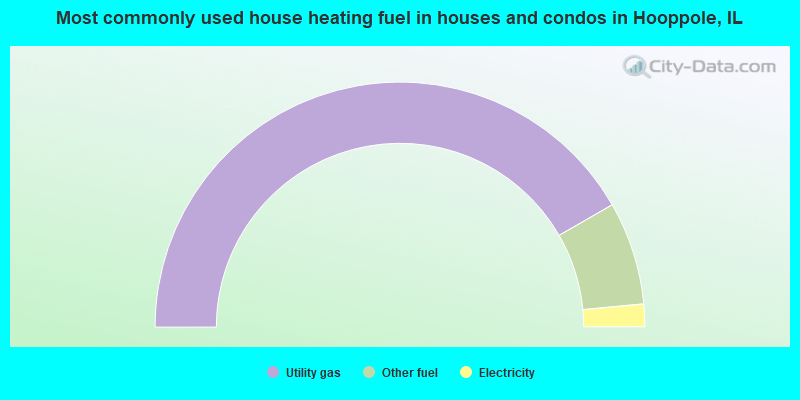
- 83.3%Utility gas
- 13.6%Other fuel
- 3.0%Electricity
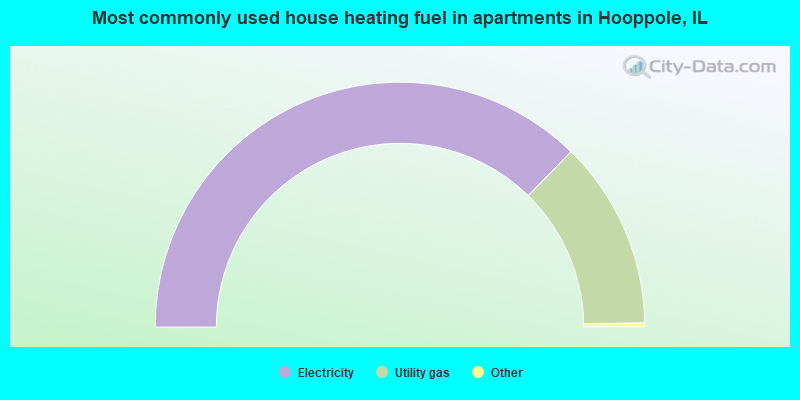
- 75.0%Electricity
- 25.0%Utility gas
Private vs. public school enrollment:
| Here: | 0.0% |
| Illinois: | 13.3% |
| Here: | 0.0% |
| Illinois: | 9.9% |
| Here: | 0.0% |
| Illinois: | 27.4% |


