Horse Pasture, VA (Virginia) Houses and Residents
| Horse Pasture: | $109,559 |
| Virginia: | $365,700 |
Mean price in 2022:
Detached houses: $138,449
Here: $138,449 State: $472,865 Mobile homes: $68,344
Here: $68,344 State: $100,736
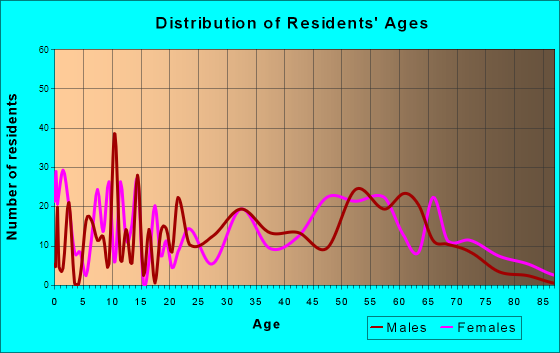
Total population: 2,227 (Urban population: 872 (all inside urban clusters), Rural population: 1,387 (19 farm, 1,368 nonfarm))
Houses: 1,039 (896 occupied: 673 owner occupied, 233 renter occupied)
| % of renters here: | 26% |
| State: | 33% |
Housing density: 108 houses/condos per square mile
Median price asked for vacant for-sale houses and condos in 2022 in this county: $151,156.
Median contract rent in 2022: $621 (lower quartile is $518, upper quartile is $678)
Median rent asked for vacant for-rent units in 2022: $551
Median gross rent in Horse Pasture, VA in 2022: $747
Housing units in Horse Pasture with a mortgage: 223 (27 second mortgage, 0 home equity loan, 17 both second mortgage and home equity loan)
Houses without a mortgage: 35
Median household income for houses/condos with a mortgage: $91,282
Median household income for apartments without a mortgage: $30,047
Median monthly housing costs: $469
Compare current foreclosures near Horse Pasture, VA:
| Photo | Address | Area | Beds / Baths | Price | Details |
|---|---|---|---|---|---|

|
#1
7th St
Fieldale, VA 24089
|
1,213 sq. feet
|
1 baths 3 beds |
$160,000
|
show details |

|
#2
Austin Dr
Martinsville, VA 24112
|
- sq. feet
|
2 baths 2 beds |
$67,600
|
show details |

|
#3
Knob Church Rd
Henry, VA 24102
|
1,400 sq. feet
|
1 baths 3 beds |
show details | |

|
#4
Cypress Hill Dr
Eden, NC 27288
|
1,133 sq. feet
|
2 baths 3 beds |
show details | |

|
#5
Early Ave
Eden, NC 27288
|
1,100 sq. feet
|
- baths - beds |
$29,900
|
show details |

|
#6
Manning St
Eden, NC 27288
|
1,577 sq. feet
|
2 baths 3 beds |
show details | |

|
#7
Boone Rd
Eden, NC 27288
|
2,584 sq. feet
|
2 baths 3 beds |
show details | |

|
#8
River Rd
Stoneville, NC 27048
|
2,535 sq. feet
|
4 baths 3 beds |
show details | |

|
#9
Healms Rd
Bassett, VA 24055
|
- sq. feet
|
1 baths 3 beds |
show details | |

|
#10
Kathren St
Martinsville, VA 24112
|
816 sq. feet
|
1 baths 2 beds |
show details |
| Photo | Address | Area | Beds / Baths | Price | Details |
|---|---|---|---|---|---|

|
#11
Westerly Park Rd
Eden, NC 27288
|
1,034 sq. feet
|
- baths 3 beds |
show details | |

|
#12
Roach St
Mayodan, NC 27027
|
1,880 sq. feet
|
2 baths 3 beds |
show details | |

|
#13
Mosco Rd
Axton, VA 24054
|
1,728 sq. feet
|
2 baths 3 beds |
show details | |

|
#14
Tender Ln
Cascade, VA 24069
|
1,406 sq. feet
|
2 baths 3 beds |
show details | |

|
#15
Lauten Loop
Madison, NC 27025
|
1,384 sq. feet
|
2 baths 3 beds |
show details | |

|
#16
Maple Springs Dr
Axton, VA 24054
|
1,149 sq. feet
|
1 baths 3 beds |
show details | |

|
#17
Locust Dr
Cascade, VA 24069
|
3,052 sq. feet
|
3 baths 4 beds |
show details | |

|
#18
Egg Farm Rd
Patrick Springs, VA 24133
|
- sq. feet
|
1 baths 2 beds |
show details | |

|
#19
Martin Farm Rd
Stuart, VA 24171
|
- sq. feet
|
2 baths 2 beds |
show details | |

|
#20
Loblolly Dr
Axton, VA 24054
|
1,350 sq. feet
|
2 baths 3 beds |
show details |
| Photo | Address | Area | Beds / Baths | Price | Details |
|---|---|---|---|---|---|

|
#21
Mountain View Rd
Martinsville, VA 24112
|
- sq. feet
|
1 baths 3 beds |
show details | |

|
#22
Laurel Ln
Martinsville, VA 24112
|
1,000 sq. feet
|
- baths - beds |
show details | |

|
#23
Crestview Dr
Bassett, VA 24055
|
- sq. feet
|
- baths - beds |
show details | |

|
#24
Flamingo Rd
Bassett, VA 24055
|
- sq. feet
|
- baths - beds |
show details | |

|
#25
Park Rd
Mayodan, NC 27027
|
1,064 sq. feet
|
- baths - beds |
show details | |

|
#26
Highland Park Dr
Eden, NC 27288
|
1,144 sq. feet
|
- baths - beds |
show details | |

|
#27
Plantation Dr Lot 5
Axton, VA 24054
|
- sq. feet
|
- baths - beds |
show details | |

|
#28
S 4th Ave
Mayodan, NC 27027
|
773 sq. feet
|
- baths - beds |
show details | |

|
#29
N 6th Ave
Mayodan, NC 27027
|
- sq. feet
|
- baths - beds |
show details | |

|
#30
Mosco Rd
Axton, VA 24054
|
- sq. feet
|
- baths - beds |
show details |
| Photo | Address | Area | Beds / Baths | Price | Details |
|---|---|---|---|---|---|

|
#31
Hobson Rd
Axton, VA 24054
|
- sq. feet
|
- baths - beds |
show details | |

|
#32
Henry Rd
Henry, VA 24102
|
- sq. feet
|
- baths - beds |
show details | |

|
#33
Clay Hodge Ln
Axton, VA 24054
|
- sq. feet
|
- baths - beds |
show details | |

|
#34
Lemons St
Stoneville, NC 27048
|
1,196 sq. feet
|
- baths - beds |
show details | |

|
#35
Nc Highway 135
Mayodan, NC 27027
|
1,025 sq. feet
|
- baths - beds |
show details | |

|
#36
Tern Ln
Madison, NC 27025
|
1,209 sq. feet
|
- baths - beds |
show details | |

|
#37
Moorefield Store Rd
Spencer, VA 24165
|
- sq. feet
|
- baths - beds |
show details | |

|
#38
Hill Street
Eden, NC 27288
|
- sq. feet
|
- baths - beds |
show details | |

|
#39
Overland Trl
Stoneville, NC 27048
|
1,040 sq. feet
|
- baths - beds |
show details | |

|
#40
Moir St Apt B
Eden, NC 27288
|
- sq. feet
|
- baths - beds |
show details |
| Photo | Address | Area | Beds / Baths | Price | Details |
|---|---|---|---|---|---|

|
#41
Sunset Dr
Eden, NC 27288
|
1,320 sq. feet
|
- baths - beds |
show details | |

|
#42
Patrick St
Eden, NC 27288
|
- sq. feet
|
- baths - beds |
show details | |

|
#43
Country Creek Rd
Stoneville, NC 27048
|
1,500 sq. feet
|
- baths - beds |
show details | |

|
#44
Prospect St
Eden, NC 27288
|
- sq. feet
|
- baths - beds |
show details | |

|
#45
Moir St
Eden, NC 27288
|
1,672 sq. feet
|
- baths - beds |
show details | |

|
#46
Riverside Dr
Eden, NC 27288
|
- sq. feet
|
- baths - beds |
show details | |

|
#47
Ayersville Rd
Mayodan, NC 27027
|
- sq. feet
|
- baths - beds |
show details | |

|
#48
Virginia St
Eden, NC 27288
|
- sq. feet
|
- baths - beds |
show details | |

|
#49
E Warren Ave
Eden, NC 27288
|
1,512 sq. feet
|
- baths - beds |
show details | |

|
Check over 1 million property listings on Foreclosure.com!
|
browse all offers | |||


 | moving (8 replies) |
Median year apartment built: 1977
Household type by relationship:
Households: 2,306- Male householders: 446 (107 living alone), Female householders: 442 (165 living alone)
381 spouses (370 opposite-sex spouses), 97 unmarried partners, (97 opposite-sex unmarried partners), 445 children (363 natural, 69 adopted, 12 stepchildren), 50 grandchildren, 46 brothers or sisters, 116 parents, 0 foster children, 77 other relatives, 73 non-relatives
- In group quarters: 129
Size of family households: 284 2-persons, 98 3-persons, 31 4-persons, 67 6-persons, 13 7-or-more-persons.
Size of nonfamily households: 280 1-person, 146 2-persons.
174 married couples with children.
142 single-parent households (2 men, 140 women).
99.4% of residents of Horse Pasture speak English at home.
1.1% of residents speak Spanish at home (100% speak English very well).
Foreign born population: 69 (3.0%)
(92.8% of them are naturalized citizens)
| Here: | 6.0 |
| State: | 7.0 |
| Here: | 4.8 |
| State: | 4.3 |

- Bedrooms in owner-occupied houses and condos in Horse Pasture, Virginia
- 13no bedroom
- 01 bedroom
- 1782 bedrooms
- 3803 bedrooms
- 844 bedrooms
- 175+ bedrooms

- Bedrooms in renter-occupied apartments in Horse Pasture, Virginia
- 0no bedroom
- 321 bedroom
- 1102 bedrooms
- 913 bedrooms
- 04 bedrooms
- 05+ bedrooms

- Cars and other vehicles available in Horse Pasture in owner-occupied houses/condos
- 39no vehicle
- 1491 vehicle
- 2362 vehicles
- 1473 vehicles
- 554 vehicles
- 465+ vehicles

- Cars and other vehicles available in Horse Pasture in renter-occupied apartments
- 22no vehicle
- 1601 vehicle
- 432 vehicles
- 83 vehicles
- 04 vehicles
- 05+ vehicles

- Rooms in owner-occupied houses in Horse Pasture, Virginia
- 131 room
- 02 rooms
- 03 rooms
- 404 rooms
- 1775 rooms
- 2126 rooms
- 1247 rooms
- 538 rooms
- 539+ rooms

- Rooms in renter-occupied apartments in Horse Pasture, Virginia
- 01 room
- 02 rooms
- 323 rooms
- 274 rooms
- 1495 rooms
- 176 rooms
- 87 rooms
- 08 rooms
- 09+ rooms


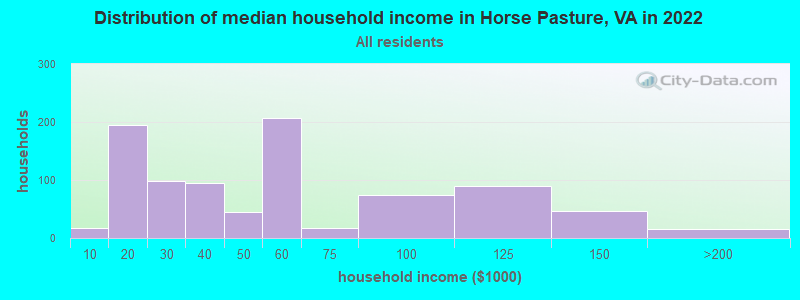
Horse Pasture, VA household income distribution

- 17Less than $10,000
- 195$10,000 to $19,999
- 98$20,000 to $29,999
- 95$30,000 to $39,999
- 45$40,000 to $49,999
- 207$50,000 to $59,999
- 18$60,000 to $74,999
- 75$75,000 to $99,999
- 89$100,000 to $124,999
- 46$125,000 to $149,999
- 15$150,000 to $199,999
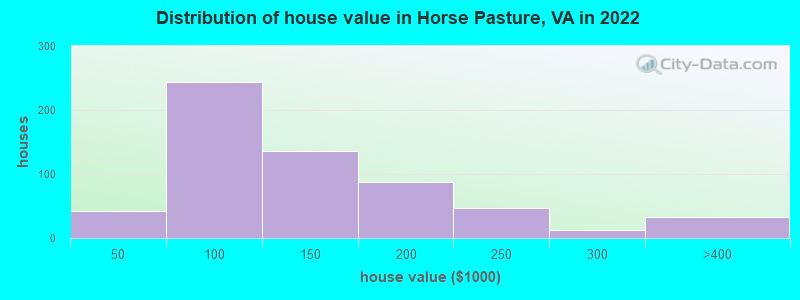
Home value of owner - occupied houses in 2022 in Horse Pasture, VA
-
- 6$10,000 to $14,999
- 35$30,000 to $34,999
- 56$50,000 to $59,999
- 75$70,000 to $79,999
- 33$80,000 to $89,999
- 76$90,000 to $99,999
- 129$100,000 to $124,999
- 6$125,000 to $149,999
- 46$150,000 to $174,999
- 40$175,000 to $199,999
- 46$200,000 to $249,999
- 11$250,000 to $299,999
- 32$300,000 to $399,999
Rent paid by renters in 2022 in Horse Pasture, VA
-
- 10$200 to $249
- 4$300 to $349
- 11$450 to $499
- 71$500 to $549
- 44$600 to $649
- 29$650 to $699
- 29$700 to $749
- 41No cash rent


Percentage of workers working in this county: 71.9%
Number of people working at home: 0 (0.0% of all workers)
Travel time to work (commute)
- Less than 5 minutes: 50
- 5 to 9 minutes: 42
- 10 to 14 minutes: 68
- 15 to 19 minutes: 155
- 20 to 24 minutes: 168
- 25 to 29 minutes: 62
- 30 to 34 minutes: 78
- 35 to 39 minutes: 0
- 40 to 44 minutes: 44
- 45 to 59 minutes: 21
- 60 to 89 minutes: 0
- 90 or more minutes: 7
Means of transportation to work:
- Drove a car alone: 884 (84.4%)
- Carpooled: 94 (9.0%)
- Bus or trolley bus: 14 (1.3%)
- Walked: 7 (0.7%)
- Other means: 18 (1.7%)
- Worked at home: 30 (2.9%)

- Unemployment by race in 2022
- Unemployment rate for White non-Hispanic residents
- 8.2%Males
- Unemployment rate for Black residents
- 13.6%Males

- Year of entry for the foreign-born population in Horse Pasture, Virginia
- 02010 or later
- 02000 to 2009
- 201990 to 1999
- 01980 to 1989
- 101970 to 1979
- 0Before 1970

First ancestries reported:
- American: 726 (44.2%)
- English: 152 (9.3%)
- Scotch-Irish: 88 (5.4%)
- Irish: 67 (4.1%)
- Italian: 54 (3.3%)
- German: 44 (2.7%)
- European: 19 (1.2%)
- Dutch: 9 (0.5%)
- African: 2 (0.1%)
Most common places of birth for foreign-born residents (%):
| Horse Pasture: | 39.1% (27) |
| Virginia: | 4.9% (52,857) |
| Horse Pasture: | 23.2% (16) |
| Virginia: | 1.7% (18,227) |
| Horse Pasture: | 17.4% (12) |
| Virginia: | 5.3% (57,498) |
| Horse Pasture: | 8.7% (6) |
| Virginia: | 0.2% (2,246) |
Place of birth for U.S.-born residents:
- This state: 1,626
- Other state: 599
- Northeast: 68
- Midwest: 92
- South: 391
- West: 45
85.7% of Horse Pasture residents lived in the same house 1 years ago.
Out of people who lived in different houses, 32.5% lived in this county.
Out of people who lived in different counties, 57.3% lived in Virginia.
| Horse Pasture: | 85.7% |
| State average: | 86.6% |
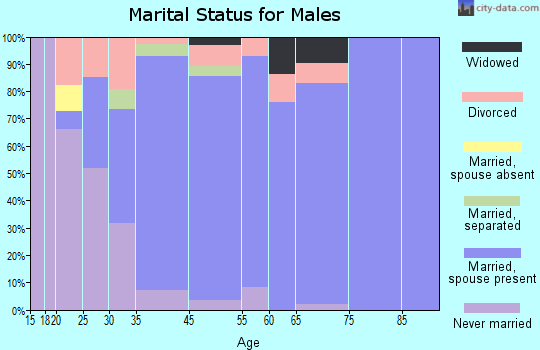
Education attainment for males 25 years and older:
- No schooling: 0
- Nursery to 4th grade: 0
- 5th and 6th grade: 19
- 7th and 8th grade: 0
- 9th grade: 4
- 10th grade: 31
- 11th grade: 26
- 12th grade, no diploma: 25
- High school graduate (or equivalency): 388
- Less than 1 year of college: 34
- Some college more than 1 year, no degree: 131
- Associate degree: 61
- Bachelor's degree: 69
- Master's degree: 24
- Professional school degree: 62
- Doctorate degree: 0

Education attainment for females 25 years and older:
- No schooling: 20
- Nursery to 4th grade: 0
- 5th and 6th grade: 11
- 7th and 8th grade: 72
- 9th grade: 0
- 10th grade: 9
- 11th grade: 0
- 12th grade, no diploma: 18
- High school graduate (or equivalency): 276
- Less than 1 year of college: 14
- Some college more than 1 year, no degree: 79
- Associate degree: 219
- Bachelor's degree: 134
- Master's degree: 13
- Professional school degree: 0
- Doctorate degree: 0

Housing units in structures:
- One, detached: 709
- One, attached: 22
- 3 or 4: 82
- Mobile homes: 225
House/condo owner moved in on average 24 years ago
Renter moved in on average 0 years ago

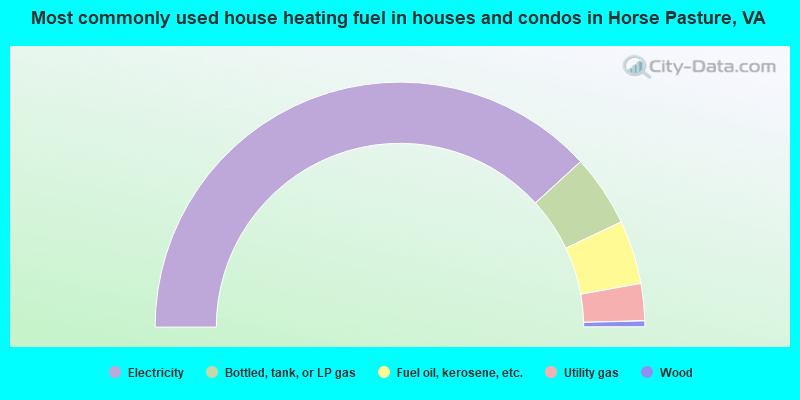
- 76.5%Electricity
- 9.5%Bottled, tank, or LP gas
- 8.4%Fuel oil, kerosene, etc.
- 4.9%Utility gas
- 0.8%Wood
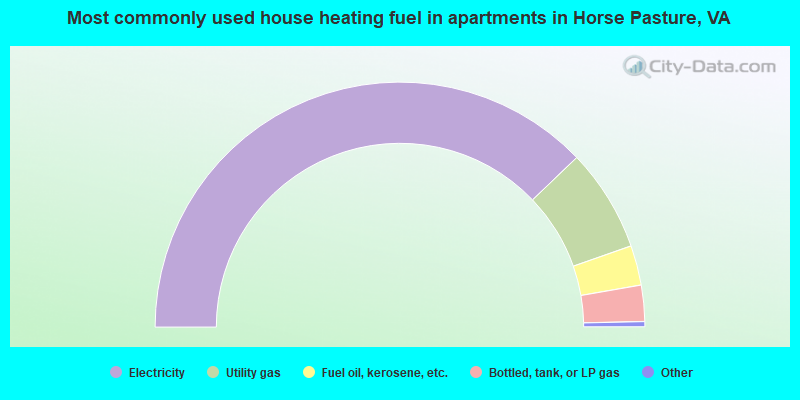
- 76.2%Electricity
- 13.7%Utility gas
- 5.3%Fuel oil, kerosene, etc.
- 4.8%Bottled, tank, or LP gas
Private vs. public school enrollment:
| Here: | 42.4% |
| Virginia: | 13.2% |
| Here: | 37.5% |
| Virginia: | 10.2% |
| Here: | 65.0% |
| Virginia: | 18.7% |


