Houston, TX (Texas) Houses and Residents
Estimated median house or condo value in 2022: $267,000 (it was $77,500 in 2000 )
Houston:
$267,000Texas:
$275,400
Lower value quartile - upper value quartile: $167,400 - $452,700Mean price in 2022: Detached houses: $398,497 Here:
$398,497State:
$369,058
Townhouses or other attached units: $331,802 Here:
$331,802State:
$327,631
In 2-unit structures: $404,196 Here:
$404,196State:
$374,947
In 3-to-4-unit structures: $227,661 Here:
$227,661State:
$209,652
In 5-or-more-unit structures: $320,273 Here:
$320,273State:
$413,944
Mobile homes: $103,950 Here:
$103,950State:
$124,413
Occupied boats, RVs, vans, etc.: $144,752 Here:
$144,752State:
$73,921
Total population: 2,239,558 (Urban population: 1,952,132 (1,952,055 inside urbanized areas, 77 inside urban clusters ), Rural population: 2,716 (48 farm, 2,668 nonfarm ))
Houses: 1,043,326 (947,632 occupied: 386,376 owner occupied, 561,256 renter occupied )
% of renters here:
59%State:
38%
Housing density: 1,801 houses/condos per square mile
Median price asked for vacant for-sale houses and condos in 2022: $408,496.
Median contract rent in 2022: $1,089 (lower quartile is $835, upper quartile is $1,465)
Median rent asked for vacant for-rent units in 2022: $1,323
Median gross rent in Houston, TX in 2022: $1,246
Housing units in Houston with a mortgage: 196,165 (11,768 second mortgage, 926 home equity loan, 7,246 both second mortgage and home equity loan )Houses without a mortgage: 4,089
Median household income for houses/condos with a mortgage: $119,428
Median household income for apartments without a mortgage: $67,192
Median monthly housing costs: $1,251
Data:
Median house or condo value ($)
Median house or condo value ($ change since 2000)
Median house or condo value ($) - White
Median house or condo value ($) - Black or African American
Median house or condo value ($) - Asian
Median house or condo value ($) - Hispanic or Latino
Median house or condo value ($) - American Indian and Alaska Native
Median house or condo value ($) - Multirace
Median house or condo value ($) - Other Race
Median price asked for mobile homes ($)
Household density (households per square mile)
Mean house or condo value by units in structure - 1, detached ($)
Mean house or condo value by units in structure - 1, attached ($)
Mean house or condo value by units in structure - 2 ($)
Mean house or condo value by units in structure by units in structure - 3 or 4 ($)
Mean house or condo value by units in structure - 5 or more ($)
Mean house or condo value by units in structure - Boat, RV, van, etc. ($)
Mean house or condo value by units in structure - Mobile home ($)
Median contract rent ($)
Median contract rent - Lower quartile ($)
Median contract rent - Upper quartile ($)
Median gross rent ($)
Urban houses (%)
Rural houses (%)
Houses occupied (%)
Houses occupied (% change since 2000)
Houses owner occupied (%)
Houses owner occupied (% change since 2000)
Houses renter occupied (%)
Houses renter occupied (% change since 2000)
Vacant housing units - For rent (%)
Vacant housing units - For rent (% change since 2000)
Vacant housing units - For sale only (%)
Vacant housing units - For sale only (% change since 2000)
Vacant housing units - Rented or sold, not occupied (%)
Vacant housing units - Rented or sold, not occupied (% change since 2000)
Vacant housing units - For seasonal, recreational, or occasional use (%)
Vacant housing units - For seasonal, recreational, or occasional use (% change since 2000)
Vacant housing units - For migrant workers (%)
Vacant housing units - For migrant workers (% change since 2000)
Vacant housing units - Other vacant (%)
Vacant housing units - Other vacant (% change since 2000)
Median monthly housing costs ($)
Median household income for houses/condos with a mortgage ($)
Median household income for houses/condos without a mortgage ($)
Median household income ($)
Median household income ($) - White
Median household income ($) - Black or African American
Median household income ($) - Asian
Median household income ($) - Hispanic or Latino
Median household income ($) - American Indian and Alaska Native
Median household income ($) - Multirace
Median household income ($) - Other Race
Mortgage status - with mortgage (%)
Mortgage status - with second mortgage (%)
Mortgage status - with home equity loan (%)
Mortgage status - with both second mortgage and home equity loan (%)
Mortgage status - without a mortgage (%)
Median year house/condo built
Median year apartment built
Household type by relationship - Male householder living alone (%)
Household type by relationship - Male householder not living alone (%)
Household type by relationship - Female householder living alone (%)
Household type by relationship - Female householder not living alone (%)
Household type by relationship - Opposite-Sex spouse (%)
Household type by relationship - Same-Sex spouse (%)
Household type by relationship - Opposite-Sex unmarried partner (%)
Household type by relationship - Same-Sex unmarried partner (%)
Household type by relationship - In group quarters (%)
Size of family households - 2-person household (%)
Size of family households - 3-person household (%)
Size of family households - 4-person household (%)
Size of family households - 5-person household (%)
Size of family households - 6-person household (%)
Size of family households - 7-or-more-person household (%)
Size of nonfamily households - 1-person household (%)
Size of nonfamily households - 2-person household (%)
Size of nonfamily households - 3-person household (%)
Size of nonfamily households - 4-person household (%)
Size of nonfamily households - 5-person household (%)
Size of nonfamily households - 6-person household (%)
Size of nonfamily households - 7-or-moreperson household (%)
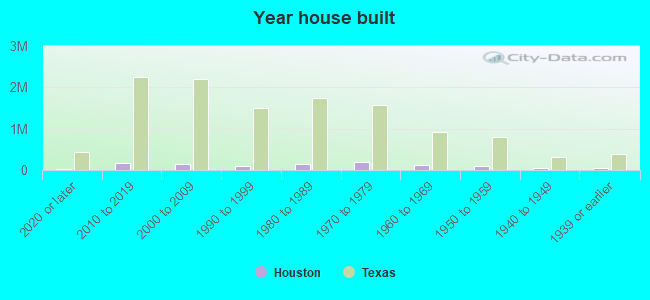
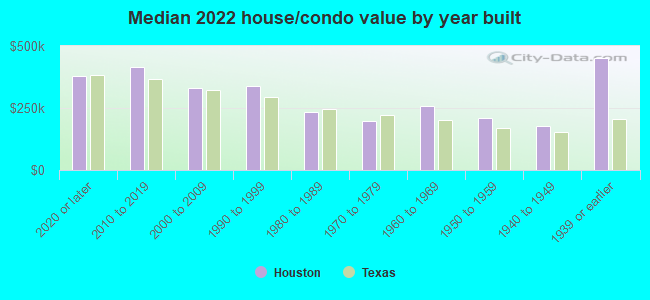
Year house built - Built 2010 or later (%)
Year house built - Built 2000 to 2009 (%)
Year house built - Built 1990 to 1999 (%)
Year house built - Built 1980 to 1989 (%)
Year house built - Built 1970 to 1979 (%)
Year house built - Built 1960 to 1969 (%)
Year house built - Built 1950 to 1959 (%)
Year house built - Built 1940 to 1949 (%)
Year house built - Built 1939 or earlier (%)
Median number of rooms in houses and condos
Median number of rooms in apartments
Median number of bedrooms in owner occupied houses
Mean number of bedrooms in owner occupied houses
Median number of bedrooms in renter occupied houses
Mean number of bedrooms in renter occupied houses
Median number of vehichles in owner occupied houses
Mean number of vehichles in owner occupied houses
Median number of vehichles in renter occupied houses
Mean number of vehichles in renter occupied houses
Rooms in owner-occupied houses - 1 room (%)
Rooms in owner-occupied houses - 2 rooms (%)
Rooms in owner-occupied houses - 3 rooms (%)
Rooms in owner-occupied houses - 4 rooms (%)
Rooms in owner-occupied houses - 5 rooms (%)
Rooms in owner-occupied houses - 6 rooms (%)
Rooms in owner-occupied houses - 7 rooms (%)
Rooms in owner-occupied houses - 8 rooms (%)
Rooms in owner-occupied houses - 9+ rooms (%)
Rooms in renter-occupied houses - 1 room (%)
Rooms in renter-occupied houses - 2 rooms (%)
Rooms in renter-occupied houses - 3 rooms (%)
Rooms in renter-occupied houses - 4 rooms (%)
Rooms in renter-occupied houses - 5 rooms (%)
Rooms in renter-occupied houses - 6 rooms (%)
Rooms in renter-occupied houses - 7 rooms (%)
Rooms in renter-occupied houses - 8 rooms (%)
Rooms in renter-occupied houses - 9+ rooms (%)
Bedrooms in owner-occupied houses - no bedrooms (%)
Bedrooms in owner-occupied houses - 1 bedroom (%)
Bedrooms in owner-occupied houses - 2 bedrooms (%)
Bedrooms in owner-occupied houses - 3 bedrooms (%)
Bedrooms in owner-occupied houses - 4 bedrooms (%)
Bedrooms in owner-occupied houses - 5+ bedrooms (%)
Bedrooms in renter-occupied houses - no bedrooms (%)
Bedrooms in renter-occupied houses - 1 bedroom (%)
Bedrooms in renter-occupied houses - 2 bedrooms (%)
Bedrooms in renter-occupied houses - 3 bedrooms (%)
Bedrooms in renter-occupied houses - 4 bedrooms (%)
Bedrooms in renter-occupied houses - 5+ bedrooms (%)
Vehicles available in owner-occupied houses - no vehicle available (%)
Vehicles available in owner-occupied houses - 1 vehicle available(%)
Vehicles available in owner-occupied houses - 2 Vehicles available (%)
Vehicles available in owner-occupied houses - 3 Vehicles available (%)
Vehicles available in owner-occupied houses - 4 Vehicles available (%)
Vehicles available in owner-occupied houses - 5+ Vehicles available (%)
Vehicles available in renter-occupied houses - no vehicle available (%)
Vehicles available in renter-occupied houses - 1 vehicle available (%)
Vehicles available in renter-occupied houses - 2 Vehicles available (%)
Vehicles available in renter-occupied houses - 3 Vehicles available (%)
Vehicles available in renter-occupied houses - 4 Vehicles available (%)
Vehicles available in renter-occupied houses - 5+ Vehicles available (%)
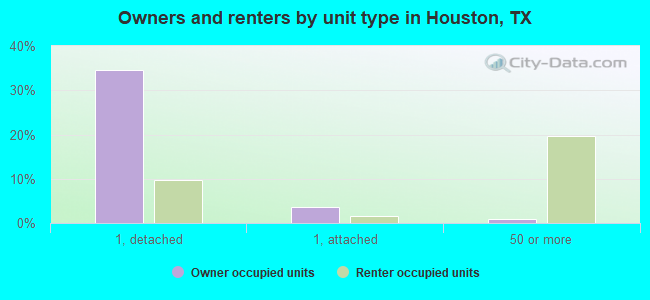
Housing units in structures - 1, detached (%)
Housing units in structures - 1, attached (%)
Housing units in structures - 2 (%)
Housing units in structures - 3 or 4 (%)
Housing units in structures - 5 to 9 (%)
Housing units in structures - 10 to 19 (%)
Housing units in structures - 20 to 49 (%)
Housing units in structures - 50 or more (%)
Housing units in structures - Mobile home (%)
Housing units in structures - Boat, RV, van, etc. (%)
Housing units in structures - Owners - 1, detached (%)
Housing units in structures - Owners - 1, attached (%)
Housing units in structures - Owners - 2 (%)
Housing units in structures - Owners - 3 or 4 (%)
Housing units in structures - Owners - 5 to 9 (%)
Housing units in structures - Owners - 10 to 19 (%)
Housing units in structures - Owners - 20 to 49 (%)
Housing units in structures - Owners - 50 or more (%)
Housing units in structures - Owners - Mobile home (%)
Housing units in structures - Owners - Boat, RV, van, etc. (%)
Housing units in structures - Renters - 1, detached (%)
Housing units in structures - Renters - 1, attached (%)
Housing units in structures - Renters - 2 (%)
Housing units in structures - Renters - 3 or 4 (%)
Housing units in structures - Renters - 5 to 9 (%)
Housing units in structures - Renters - 10 to 19 (%)
Housing units in structures - Renters - 20 to 49 (%)
Housing units in structures - Renters - 50 or more (%)
Housing units in structures - Renters - Mobile home (%)
Housing units in structures - Renters - Boat, RV, van, etc. (%)
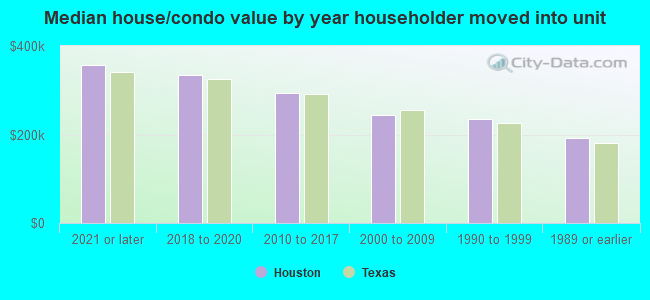
House/condo owner moved in on average (years ago)
Renter moved in on average (years ago)
Year householder moved into unit - Moved in 1999 to March 2000 (%)
Year householder moved into unit - Moved in 1999 to March 2000 (%) - White
Year householder moved into unit - Moved in 1999 to March 2000 (%) - Black or African American
Year householder moved into unit - Moved in 1999 to March 2000 (%) - Asian
Year householder moved into unit - Moved in 1999 to March 2000 (%) - Hispanic or Latino
Year householder moved into unit - Moved in 1999 to March 2000 (%) - American Indian and Alaska Native
Year householder moved into unit - Moved in 1999 to March 2000 (%) - Multirace
Year householder moved into unit - Moved in 1999 to March 2000 (%) - Other Race
Year householder moved into unit - Moved in 1995 to 1998 (%)
Year householder moved into unit - Moved in 1995 to 1998 (%) - White
Year householder moved into unit - Moved in 1995 to 1998 (%) - Black or African American
Year householder moved into unit - Moved in 1995 to 1998 (%) - Asian
Year householder moved into unit - Moved in 1995 to 1998 (%) - Hispanic or Latino
Year householder moved into unit - Moved in 1995 to 1998 (%) - American Indian and Alaska Native
Year householder moved into unit - Moved in 1995 to 1998 (%) - Multirace
Year householder moved into unit - Moved in 1995 to 1998 (%) - Other Race
Year householder moved into unit - Moved in 1990 to 1994 (%)
Year householder moved into unit - Moved in 1990 to 1994 (%) - White
Year householder moved into unit - Moved in 1990 to 1994 (%) - Black or African American
Year householder moved into unit - Moved in 1990 to 1994 (%) - Asian
Year householder moved into unit - Moved in 1990 to 1994 (%) - Hispanic or Latino
Year householder moved into unit - Moved in 1990 to 1994 (%) - American Indian and Alaska Native
Year householder moved into unit - Moved in 1990 to 1994 (%) - Multirace
Year householder moved into unit - Moved in 1990 to 1994 (%) - Other Race
Year householder moved into unit - Moved in 1980 to 1989 (%)
Year householder moved into unit - Moved in 1980 to 1989 (%) - White
Year householder moved into unit - Moved in 1980 to 1989 (%) - Black or African American
Year householder moved into unit - Moved in 1980 to 1989 (%) - Asian
Year householder moved into unit - Moved in 1980 to 1989 (%) - Hispanic or Latino
Year householder moved into unit - Moved in 1980 to 1989 (%) - American Indian and Alaska Native
Year householder moved into unit - Moved in 1980 to 1989 (%) - Multirace
Year householder moved into unit - Moved in 1980 to 1989 (%) - Other Race
Year householder moved into unit - Moved in 1970 to 1979 (%)
Year householder moved into unit - Moved in 1970 to 1979 (%) - White
Year householder moved into unit - Moved in 1970 to 1979 (%) - Black or African American
Year householder moved into unit - Moved in 1970 to 1979 (%) - Asian
Year householder moved into unit - Moved in 1970 to 1979 (%) - Hispanic or Latino
Year householder moved into unit - Moved in 1970 to 1979 (%) - American Indian and Alaska Native
Year householder moved into unit - Moved in 1970 to 1979 (%) - Multirace
Year householder moved into unit - Moved in 1970 to 1979 (%) - Other Race
Year householder moved into unit - Moved in 1969 or earlier (%)
Year householder moved into unit - Moved in 1969 or earlier (%) - White
Year householder moved into unit - Moved in 1969 or earlier (%) - Black or African American
Year householder moved into unit - Moved in 1969 or earlier (%) - Asian
Year householder moved into unit - Moved in 1969 or earlier (%) - Hispanic or Latino
Year householder moved into unit - Moved in 1969 or earlier (%) - American Indian and Alaska Native
Year householder moved into unit - Moved in 1969 or earlier (%) - Multirace
Year householder moved into unit - Moved in 1969 or earlier (%) - Other Race
Housing units lacking complete plumbing facilities (%)
Housing units lacking complete kitchen facilities (%)
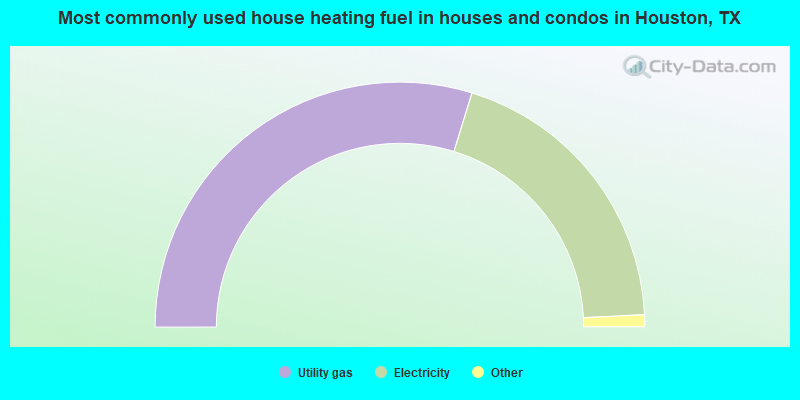
House heating fuel used in houses and condos - Utility gas (%)
House heating fuel used in houses and condos - Bottled, tank, or LP gas (%)
House heating fuel used in houses and condos - Electricity (%)
House heating fuel used in houses and condos - Fuel oil, kerosene, etc. (%)
House heating fuel used in houses and condos - Coal or coke (%)
House heating fuel used in houses and condos - Wood (%)
House heating fuel used in houses and condos - Solar energy (%)
House heating fuel used in houses and condos - Other fuel (%)
House heating fuel used in houses and condos - No fuel used (%)
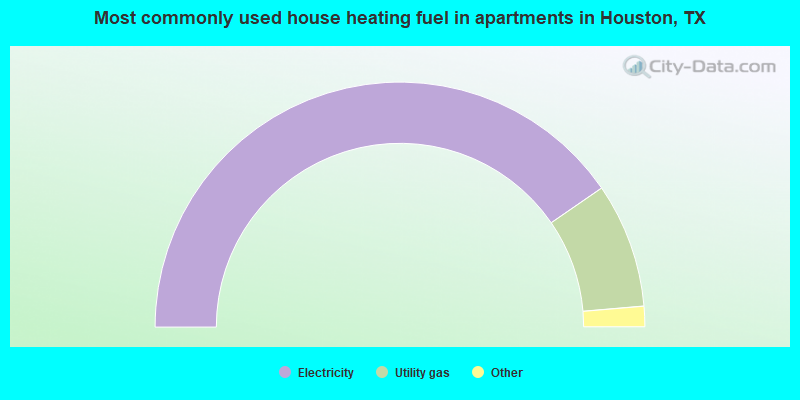
House heating fuel used in apartments - Utility gas (%)
House heating fuel used in apartments - Bottled, tank, or LP gas (%)
House heating fuel used in apartments - Electricity (%)
House heating fuel used in apartments - Fuel oil, kerosene, etc. (%)
House heating fuel used in apartments - Coal or coke (%)
House heating fuel used in apartments - Wood (%)
House heating fuel used in apartments - Solar energy (%)
House heating fuel used in apartments - Other fuel (%)
House heating fuel used in apartments - No fuel used (%)
Latest news about housing in Houston, TX collected exclusively by city-data.com from local newspapers, TV, and radio stations
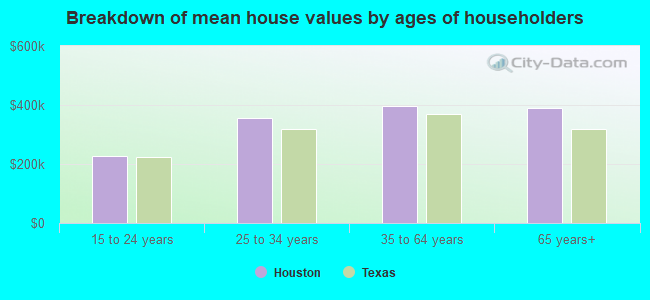
Median year house/condo built: 1977Median year apartment built: 1987Household type by relationship:
Households: 2,304,414
Male householders: 466,968 (159,406 living alone ), Female householders: 480,664 (168,981 living alone )326,734 spouses (321,287 opposite-sex spouses ), 97,278 unmarried partners , (90,716 opposite-sex unmarried partners ), 648,682 children (611,993 natural , 9,416 adopted , 27,273 stepchildren ), 58,838 grandchildren , 42,131 brothers or sisters , 34,164 parents , 1,158 foster children , 50,371 other relatives , 66,004 non-relatives In group quarters: 31,422
Size of family households: 218,274 2-persons , 136,982 3-persons , 100,055 4-persons , 48,577 5-persons , 24,655 6-persons , 14,510 7-or-more-persons .
Size of nonfamily households: 328,387 1-person , 64,486 2-persons , 8,163 3-persons , 2,008 4-persons , 603 5-persons , 441 6-persons , 491 7-or-more-persons .
255,983 married couples with children. single-parent households (43,308 men , 153,451 women ).
51.5% of residents of Houston speak English at home. of residents speak Spanish at home (48% speak English very well , 15% speak English well , 16% speak English not well , 21% don't speak English at all ).of residents speak other Indo-European language at home (76% speak English very well , 14% speak English well , 7% speak English not well , 3% don't speak English at all ).of residents speak Asian or Pacific Island language at home (52% speak English very well , 26% speak English well , 17% speak English not well , 5% don't speak English at all ).of residents speak other language at home (79% speak English very well , 12% speak English well , 6% speak English not well , 3% don't speak English at all ).
Foreign born population: 676,712 (29.4%)of them are naturalized citizens )
Median number of rooms in houses and condos:
Median number of rooms in apartments
Owner-occupied Renter-occupied
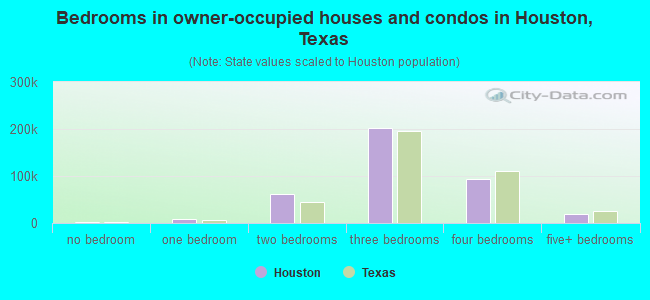
Bedrooms in owner-occupied houses and condos in Houston, Texas
3,131 no bedroom 9,058 1 bedroom 60,757 2 bedrooms 201,217 3 bedrooms 93,001 4 bedrooms 19,212 5+ bedrooms
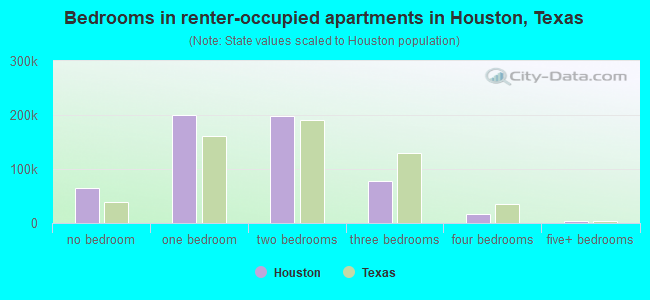
Bedrooms in renter-occupied apartments in Houston, Texas
65,183 no bedroom 200,661 1 bedroom 197,768 2 bedrooms 77,895 3 bedrooms 16,803 4 bedrooms 2,946 5+ bedrooms
Owner-occupied Renter-occupied
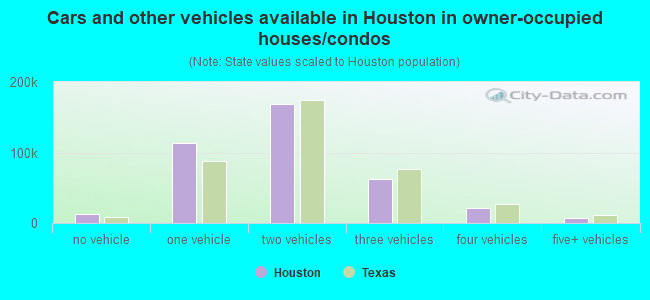
Cars and other vehicles available in Houston in owner-occupied houses/condos
12,823 no vehicle 113,157 1 vehicle 169,428 2 vehicles 62,242 3 vehicles 21,166 4 vehicles 7,560 5+ vehicles
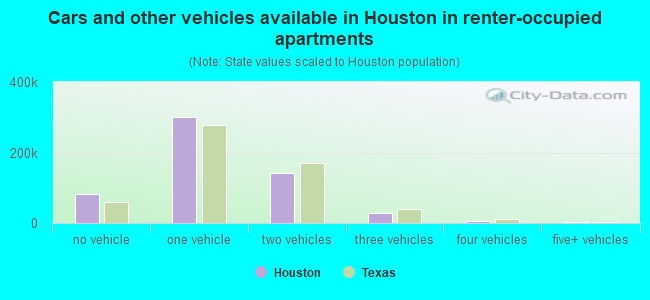
Cars and other vehicles available in Houston in renter-occupied apartments
82,271 no vehicle 299,768 1 vehicle 142,049 2 vehicles 29,256 3 vehicles 6,294 4 vehicles 1,618 5+ vehicles
Owner-occupied Renter-occupied
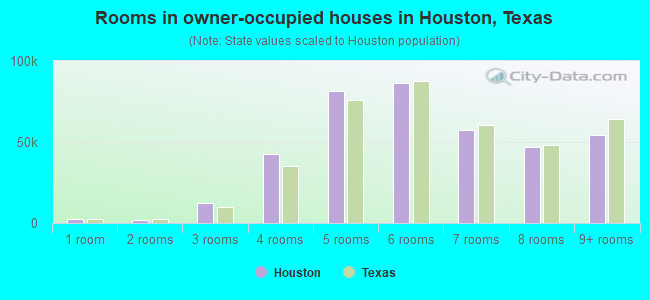
Rooms in owner-occupied houses in Houston, Texas
2,397 1 room 2,154 2 rooms 12,376 3 rooms 42,398 4 rooms 81,774 5 rooms 86,540 6 rooms 57,368 7 rooms 46,905 8 rooms 54,464 9+ rooms
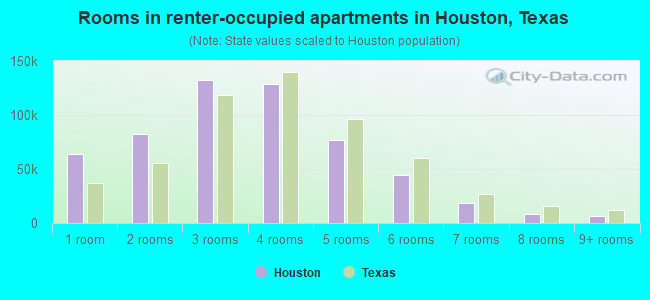
Rooms in renter-occupied apartments in Houston, Texas
63,721 1 room 82,205 2 rooms 132,405 3 rooms 128,496 4 rooms 76,836 5 rooms 44,095 6 rooms 18,564 7 rooms 8,690 8 rooms 6,244 9+ rooms
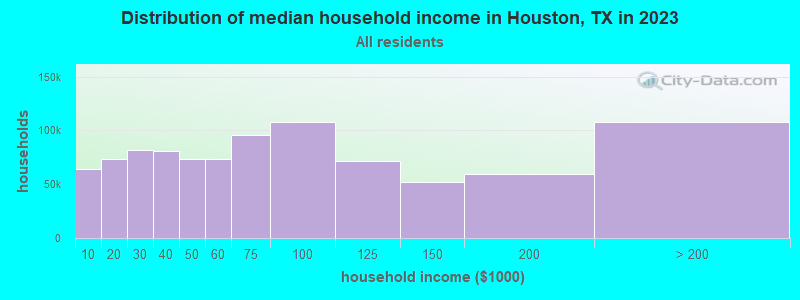
Houston, TX household income distribution 64,558 Less than $10,00075,798 $10,000 to $19,99986,735 $20,000 to $29,99988,618 $30,000 to $39,99977,918 $40,000 to $49,99976,712 $50,000 to $59,999101,255 $60,000 to $74,999106,198 $75,000 to $99,99968,690 $100,000 to $124,99946,868 $125,000 to $149,99960,699 $150,000 to $199,99993,583 $200,000 or more
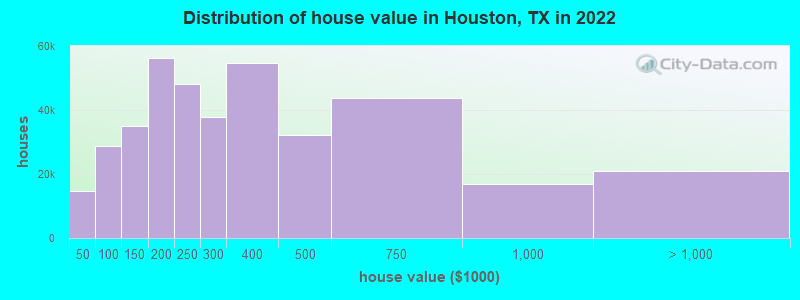
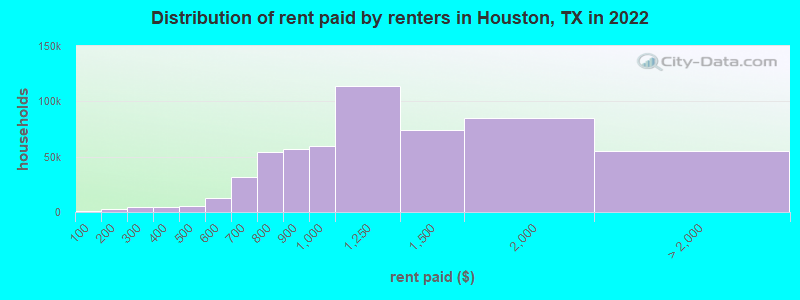
Home value of owner - occupied houses in 2022 in Houston, TX 4,098 Less than $10,000955 $10,000 to $14,9992,522 $15,000 to $19,9991,909 $20,000 to $24,9991,788 $25,000 to $29,999482 $30,000 to $34,999744 $35,000 to $39,9992,102 $40,000 to $49,9993,990 $50,000 to $59,9993,872 $60,000 to $69,9994,393 $70,000 to $79,9998,194 $80,000 to $89,9996,088 $90,000 to $99,99920,808 $100,000 to $124,99914,184 $125,000 to $149,99929,404 $150,000 to $174,99926,763 $175,000 to $199,99948,042 $200,000 to $249,99937,756 $250,000 to $299,99954,693 $300,000 to $399,99932,238 $400,000 to $499,99943,597 $500,000 to $749,99916,745 $750,000 to $999,99910,854 $1,000,000 to $1,499,9994,986 $1,500,000 to $1,999,9995,169 $2,000,000 or moreRent paid by renters in 2022 in Houston, TX 1,252 Less than $100912 $100 to $1491,832 $150 to $1993,221 $200 to $2491,189 $250 to $2992,752 $300 to $3491,625 $350 to $3993,303 $400 to $4491,857 $450 to $4996,264 $500 to $5496,808 $550 to $59912,049 $600 to $64919,529 $650 to $69926,462 $700 to $74927,761 $750 to $79956,770 $800 to $89959,546 $900 to $999113,907 $1,000 to $1,24973,807 $1,250 to $1,49985,369 $1,500 to $1,99922,059 $2,000 to $2,4999,922 $2,500 to $2,9992,576 $3,000 to $3,4996,548 $3,500 or more13,936 No cash rent
Percentage of workers working in this county: 91.3%Number of people working at home: 142,374 (12.5% of all workers )
Travel time to work (commute)
Less than 5 minutes: 16,3955 to 9 minutes: 57,11510 to 14 minutes: 96,52215 to 19 minutes: 149,99420 to 24 minutes: 169,37325 to 29 minutes: 73,08630 to 34 minutes: 212,16135 to 39 minutes: 34,14640 to 44 minutes: 43,16245 to 59 minutes: 77,87860 to 89 minutes: 47,06990 or more minutes: 20,737
Means of transportation to work:
Drove a car alone: 1,397,373 (74.3%)Carpooled: 212,293 (11.3%)Bus : 42,009 (2.2%)Subway or elevated rail : 1,108 (0.1%)Long-distance train or commuter rail : 471 (0.0%)Light rail, streetcar or trolley : 2,005 (0.1%)Ferryboat: 217 (0.0%)Taxi: 56,315 (3.0%)Bicycle: 5,079 (0.3%)Walked: 22,365 (1.2%)Worked at home: 142,374 (7.6%)
Unemployment by race in 2022
Unemployment rate for White non-Hispanic residents 5.1% Males3.6% FemalesUnemployment rate for Black residents 7.7% Males8.6% FemalesUnemployment rate for American Indian and Alaska Native residents 9.6% Males12.2% FemalesUnemployment rate for Asian residents 5.1% Males3.0% FemalesUnemployment rate for other race residents 4.6% Males7.6% FemalesUnemployment rate for two or more race residents 5.1% Males6.5% FemalesUnemployment rate for Hispanic or Latino residents 4.7% Males7.8% Females
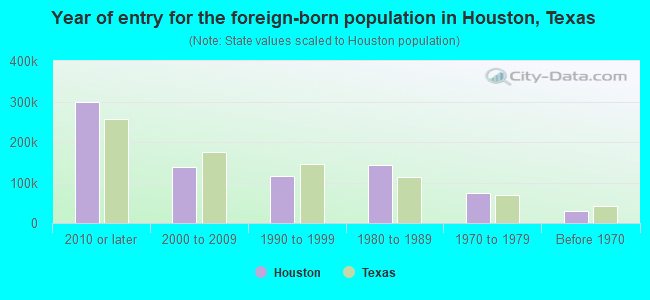
Year of entry for the foreign-born population in Houston, Texas
299,320 2010 or later 138,520 2000 to 2009 116,149 1990 to 1999 144,444 1980 to 1989 73,193 1970 to 1979 29,030 Before 1970
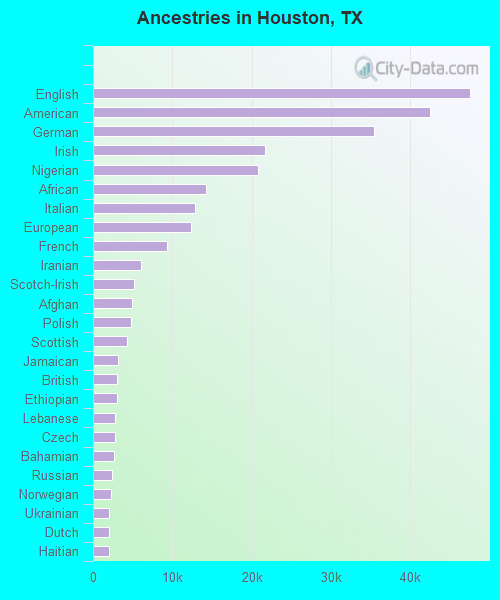
First ancestries reported:
English: 47,572 (3.0%)
American: 42,463 (2.7%)
German: 35,424 (2.2%)
Irish: 21,723 (1.4%)
Nigerian: 20,797 (1.3%)
African: 14,273 (0.9%)
Italian: 12,912 (0.8%)
European: 12,334 (0.8%)
French: 9,325 (0.6%)
Iranian: 6,065 (0.4%)
Scotch-Irish: 5,172 (0.3%)
Afghan: 4,895 (0.3%)
Polish: 4,766 (0.3%)
Scottish: 4,250 (0.3%)
Jamaican: 3,208 (0.2%)
British: 3,071 (0.2%)
Ethiopian: 3,003 (0.2%)
Lebanese: 2,812 (0.2%)
Czech: 2,765 (0.2%)
Bahamian: 2,638 (0.2%)
Russian: 2,354 (0.1%)
Norwegian: 2,314 (0.1%)
Ukrainian: 1,988 (0.1%)
Dutch: 1,967 (0.1%)
Haitian: 1,966 (0.1%)
Eastern European: 1,843 (0.1%)
Jordanian: 1,809 (0.1%)
Greek: 1,663 (0.1%)
Ghanaian: 1,636 (0.1%)
French Canadian: 1,617 (0.1%)
Sudanese: 1,557 (0.10%)
Turkish: 1,469 (0.09%)
Palestinian: 1,390 (0.09%)
Scandinavian: 1,348 (0.08%)
Egyptian: 1,230 (0.08%)
Swedish: 1,176 (0.07%)
Iraqi: 1,086 (0.07%)
Northern European: 1,019 (0.06%)
Moroccan: 1,000 (0.06%)
Arab: 969 (0.06%)
Brazilian: 903 (0.06%)
West Indian: 887 (0.06%)
Israeli: 865 (0.05%)
Hungarian: 853 (0.05%)
Trinidadian and Tobagonian: 778 (0.05%)
Sierra Leonean: 729 (0.05%)
Slovak: 720 (0.04%)
British West Indian: 680 (0.04%)
Welsh: 680 (0.04%)
Macedonian: 625 (0.04%)
Swiss: 585 (0.04%)
Canadian: 570 (0.04%)
Basque: 484 (0.03%)
Australian: 445 (0.03%)
Guyanese: 444 (0.03%)
Syrian: 407 (0.03%)
Romanian: 357 (0.02%)
South African: 356 (0.02%)
Serbian: 347 (0.02%)
Bulgarian: 344 (0.02%)
Danish: 312 (0.02%)
Yugoslavian: 306 (0.02%)
Austrian: 281 (0.02%)
Finnish: 265 (0.02%)
Belgian: 259 (0.02%)
Icelander: 254 (0.02%)
Croatian: 242 (0.02%)
Celtic: 237 (0.01%)
Belizean: 236 (0.01%)
Kenyan: 227 (0.01%)
Slovene: 212 (0.01%)
Lithuanian: 203 (0.01%)
Czechoslovakian: 189 (0.01%)
Slavic: 138 (0.01%)
Cajun: 137 (0.01%)
U.S. Virgin Islander: 131 (0.01%)
Barbadian: 116 (0.01%)
Latvian: 111 (0.01%)
Armenian: 106 (0.01%)
Liberian: 95 (0.01%)
Most common places of birth for foreign-born residents (%): Mexico Houston:
34.0% (230,074)Texas:
46.2% (2,386,805)
El Salvador Houston:
9.6% (65,055)Texas:
4.7% (241,650)
Honduras Houston:
9.5% (64,611)Texas:
3.6% (185,261)
Guatemala Houston:
6.2% (42,012)Texas:
2.0% (102,238)
Vietnam Houston:
3.8% (25,975)Texas:
3.4% (177,147)
China, excluding Hong Kong and Taiwan Houston:
3.1% (20,817)Texas:
2.3% (116,322)
India Houston:
3.0% (20,347)Texas:
6.6% (343,210)
Nigeria Houston:
2.7% (18,300)Texas:
1.8% (94,466)
Venezuela Houston:
2.6% (17,906)Texas:
1.9% (99,836)
Cuba Houston:
2.2% (15,036)Texas:
1.4% (72,993)
Colombia Houston:
1.7% (11,183)Texas:
1.2% (63,908)
Place of birth for U.S.-born residents:
This state: 1,177,368Other state: 408,249Northeast: 56,123Midwest: 95,638South: 177,624West: 78,864 83.7% of Houston residents lived in the same house 1 years ago.
Out of people who lived in different houses, 41.3% lived in this county.
Out of people who lived in different counties, 48.1% lived in Texas.
Houston:
83.7%State average:
85.7%
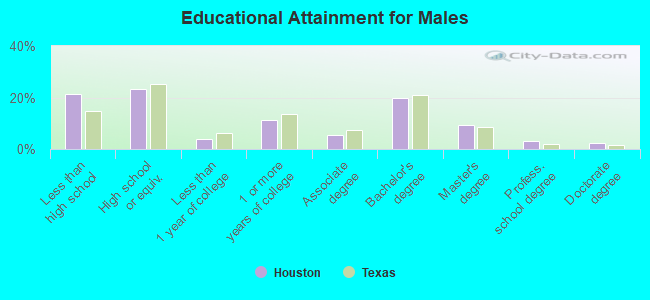
Education attainment for males 25 years and older:
No schooling: 43,055Nursery to 4th grade: 18,3195th and 6th grade: 26,9487th and 8th grade: 14,8449th grade: 17,00110th grade: 10,78011th grade: 10,32112th grade, no diploma: 21,894High school graduate (or equivalency): 177,374Less than 1 year of college: 29,013Some college more than 1 year, no degree: 86,628Associate degree: 40,371Bachelor's degree: 152,428Master's degree: 71,794Professional school degree: 25,058Doctorate degree: 16,912
Education attainment for females 25 years and older:
No schooling: 34,895Nursery to 4th grade: 25,3075th and 6th grade: 23,1377th and 8th grade: 12,7639th grade: 15,28110th grade: 6,87411th grade: 11,18612th grade, no diploma: 19,979High school graduate (or equivalency): 164,998Less than 1 year of college: 36,436Some college more than 1 year, no degree: 98,243Associate degree: 47,653Bachelor's degree: 166,140Master's degree: 79,453Professional school degree: 21,633Doctorate degree: 14,772
Housing units in structures:
One, detached: 450,092One, attached: 51,425Two: 17,4923 or 4: 60,3155 to 9: 76,69610 to 19: 99,36920 to 49: 59,22750 or more: 217,923Mobile homes: 10,224Boats, RVs, vans, etc.: 563Median worth of mobile homes: $23,600
Housing units lacking complete plumbing facilities in 2022: 1.4%Housing units lacking complete kitchen facilities in 2022: 2.4%House/condo owner moved in on average 12 years ago
Renter moved in on average 2 years ago
Private vs. public school enrollment:
Students in private schools in grades 1 to 8 (elementary and middle school): 20,410 Students in private schools in grades 9 to 12 (high school): 9,803 Students in private undergraduate colleges: 21,207