Hyrum, UT (Utah) Houses and Residents
| Hyrum: | $419,512 |
| Utah: | $499,500 |
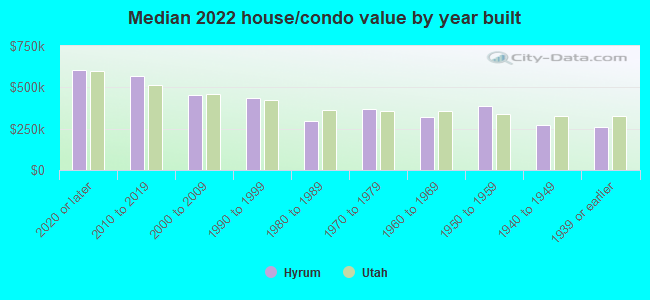
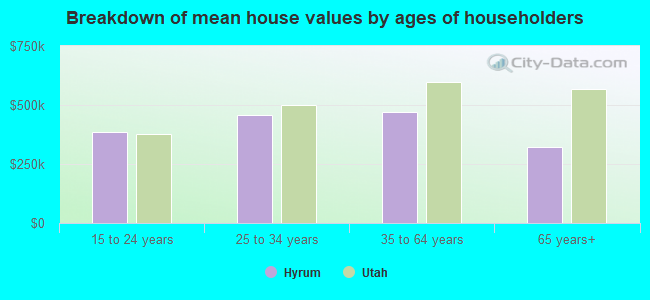
Mean price in 2022:
Detached houses: $364,715
Here: $364,715 State: $607,750 Townhouses or other attached units: $288,118
Here: $288,118 State: $444,505 Mobile homes: $87,742
Here: $87,742 State: $113,475
Total population: 7,818 (Urban population: 6,153, Rural population: 35 (all nonfarm))
Houses: 3,061 (3,016 occupied: 2,607 owner occupied, 473 renter occupied)
| % of renters here: | 15% |
| State: | 29% |
Housing density: 784 houses/condos per square mile
Median price asked for vacant for-sale houses and condos in 2022 in this county: $411,138.
Median contract rent in 2022: $992 (lower quartile is $630, upper quartile is $1,436)
Median gross rent in Hyrum, UT in 2022: $1,106
Housing units in Hyrum with a mortgage: 1,719 (158 second mortgage, 0 home equity loan, 141 both second mortgage and home equity loan)
Houses without a mortgage: 25
Median household income for houses/condos with a mortgage: $105,319
Median household income for apartments without a mortgage: $56,345
Median monthly housing costs: $1,421
Compare current foreclosures near Hyrum, UT:
| Photo | Address | Area | Beds / Baths | Price | Details |
|---|---|---|---|---|---|

|
#1
Rocky Mountain Way
Hyrum, UT 84319
|
- sq. feet
|
1 baths 2 beds |
show details | |

|
#2
W Highway 101
Hyrum, UT 84319
|
- sq. feet
|
- baths - beds |
show details | |

|
#3
N 400 W
Hyrum, UT 84319
|
- sq. feet
|
- baths - beds |
show details | |

|
#4
N 200 E
Hyrum, UT 84319
|
- sq. feet
|
- baths - beds |
show details | |

|
#5
E 400 S
Hyrum, UT 84319
|
- sq. feet
|
- baths - beds |
show details | |

|
#6
Richcrest Drive
Hyrum, UT 84319
|
- sq. feet
|
- baths - beds |
show details | |

|
#7
N 500 W
Hyrum, UT 84319
|
- sq. feet
|
- baths - beds |
show details | |

|
#8
W 100 N
Hyrum, UT 84319
|
- sq. feet
|
- baths - beds |
show details | |

|
#9
Oak Pl
Brigham City, UT 84302
|
- sq. feet
|
2 baths 4 beds |
show details | |

|
#10
N 400 E
Logan, UT 84341
|
- sq. feet
|
- baths - beds |
show details |
| Photo | Address | Area | Beds / Baths | Price | Details |
|---|---|---|---|---|---|

|
#11
E 300 S
Brigham City, UT 84302
|
1,238 sq. feet
|
- baths - beds |
show details | |

|
#12
W 500 N
Brigham City, UT 84302
|
1,107 sq. feet
|
- baths - beds |
show details | |

|
#13
W 7200 N, Unit 2
Honeyville, UT 84314
|
- sq. feet
|
- baths - beds |
show details | |

|
#14
E Forest St
Brigham City, UT 84302
|
- sq. feet
|
- baths - beds |
show details | |

|
#15
E 100 N
Brigham City, UT 84302
|
1,080 sq. feet
|
- baths - beds |
show details | |

|
#16
N 500 W
Brigham City, UT 84302
|
1,025 sq. feet
|
- baths - beds |
show details | |

|
#17
N 300 W
Brigham City, UT 84302
|
- sq. feet
|
- baths - beds |
show details | |

|
#18
N 400 W
Brigham City, UT 84302
|
841 sq. feet
|
- baths - beds |
show details | |

|
#19
S 500 E
Brigham City, UT 84302
|
- sq. feet
|
- baths - beds |
show details | |

|
#20
W 400 N
Brigham City, UT 84302
|
1,340 sq. feet
|
- baths - beds |
show details |
| Photo | Address | Area | Beds / Baths | Price | Details |
|---|---|---|---|---|---|

|
#21
N 150 E
Hyde Park, UT 84318
|
- sq. feet
|
- baths - beds |
show details | |

|
#22
E 300 N
Brigham City, UT 84302
|
2,018 sq. feet
|
- baths - beds |
show details | |

|
#23
N 500 W
Brigham City, UT 84302
|
900 sq. feet
|
- baths - beds |
show details | |

|
#24
S 300 E Apt C
Brigham City, UT 84302
|
- sq. feet
|
- baths - beds |
show details | |

|
#25
E 150 N
Hyde Park, UT 84318
|
- sq. feet
|
- baths - beds |
show details | |

|
#26
E 600 N
Brigham City, UT 84302
|
1,083 sq. feet
|
- baths - beds |
show details | |

|
#27
N Main St, Trlr 41
Brigham City, UT 84302
|
- sq. feet
|
- baths - beds |
show details | |

|
#28
E 700 N
Brigham City, UT 84302
|
925 sq. feet
|
- baths - beds |
show details | |

|
#29
Maple Cir
Logan, UT 84341
|
- sq. feet
|
- baths - beds |
show details | |

|
#30
Aspen Meadow Dr
Logan, UT 84341
|
- sq. feet
|
- baths - beds |
show details |
| Photo | Address | Area | Beds / Baths | Price | Details |
|---|---|---|---|---|---|

|
#31
E 2700 N
Logan, UT 84341
|
- sq. feet
|
- baths - beds |
show details | |

|
#32
Highland Blvd
Brigham City, UT 84302
|
- sq. feet
|
- baths - beds |
show details | |

|
#33
Kingston Pl
Brigham City, UT 84302
|
1,240 sq. feet
|
- baths - beds |
show details | |

|
#34
E 3100 N
Logan, UT 84341
|
- sq. feet
|
- baths - beds |
show details | |

|
#35
N 100 E, Apt 3
Brigham City, UT 84302
|
- sq. feet
|
- baths - beds |
show details | |

|
#36
E 400 N
Brigham City, UT 84302
|
1,104 sq. feet
|
- baths - beds |
show details | |

|
#37
N 3200 W
Smithfield, UT 84335
|
- sq. feet
|
- baths - beds |
show details | |

|
#38
N Main St Apt 12
Brigham City, UT 84302
|
- sq. feet
|
- baths - beds |
show details | |

|
#39
S Main St
Smithfield, UT 84335
|
- sq. feet
|
- baths - beds |
show details | |

|
#40
N 600 W
Brigham City, UT 84302
|
2,435 sq. feet
|
- baths - beds |
show details |
| Photo | Address | Area | Beds / Baths | Price | Details |
|---|---|---|---|---|---|

|
#41
N Highway 38
Honeyville, UT 84314
|
- sq. feet
|
- baths - beds |
show details | |

|
#42
N 600 E
Brigham City, UT 84302
|
1,544 sq. feet
|
- baths - beds |
show details | |

|
#43
N Main St # 7
Brigham City, UT 84302
|
- sq. feet
|
- baths - beds |
show details | |

|
#44
E 630 N
Hyde Park, UT 84318
|
- sq. feet
|
- baths - beds |
show details | |

|
#45
W 700 S
Brigham City, UT 84302
|
1,850 sq. feet
|
- baths - beds |
show details | |

|
#46
W 300 S
Brigham City, UT 84302
|
- sq. feet
|
- baths - beds |
show details | |

|
#47
Cherry Dr
Brigham City, UT 84302
|
- sq. feet
|
- baths - beds |
show details | |

|
#48
E 200 N
Smithfield, UT 84335
|
- sq. feet
|
- baths - beds |
show details | |

|
#49
W 300 N
Smithfield, UT 84335
|
- sq. feet
|
- baths - beds |
show details | |

|
Check over 1 million property listings on Foreclosure.com!
|
browse all offers | |||

Latest news about housing in Hyrum, UT collected exclusively by city-data.com from local newspapers, TV, and radio stations

 | Puzzled about Logan Utah Apartments... (4 replies) |
| Moving to Hyrum?! (2 replies) |
| Logan: How is it? (12 replies) |
| Microclimates in Cache Valley (3 replies) |
| Non-mormon family looking to relocate to Lehi (295 replies) |
| Water skiing in SLC (2 replies) |

Median year apartment built: 1974
Household type by relationship:
Households: 10,093- Male householders: 1,636 (127 living alone), Female householders: 1,335 (192 living alone)
2,298 spouses (2,298 opposite-sex spouses), 81 unmarried partners, (81 opposite-sex unmarried partners), 4,331 children (4,054 natural, 141 adopted, 135 stepchildren), 112 grandchildren, 44 brothers or sisters, 34 parents, 65 foster children, 93 other relatives, 59 non-relatives
Size of family households: 931 2-persons, 433 3-persons, 314 4-persons, 463 5-persons, 194 6-persons, 185 7-or-more-persons.
Size of nonfamily households: 350 1-person, 145 2-persons, 23 3-persons.
3,261 married couples with children.
93 single-parent households (62 men, 31 women).
88.0% of residents of Hyrum speak English at home.
10.0% of residents speak Spanish at home (54% speak English very well, 17% speak English well, 19% speak English not well, 10% don't speak English at all).
0.1% of residents speak other Indo-European language at home (100% speak English very well).
1.5% of residents speak Asian or Pacific Island language at home (74% speak English very well, 22% speak English well, 4% speak English not well).
Foreign born population: 663 (6.6%)
(57.8% of them are naturalized citizens)
| Here: | 7.7 |
| State: | 7.6 |
| Here: | 4.8 |
| State: | 4.3 |
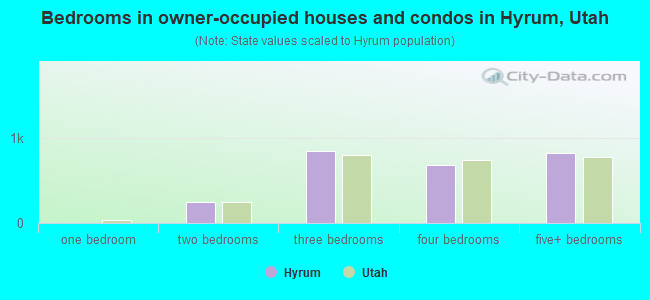
- Bedrooms in owner-occupied houses and condos in Hyrum, Utah
- 0no bedroom
- 31 bedroom
- 2502 bedrooms
- 8483 bedrooms
- 6854 bedrooms
- 8225+ bedrooms
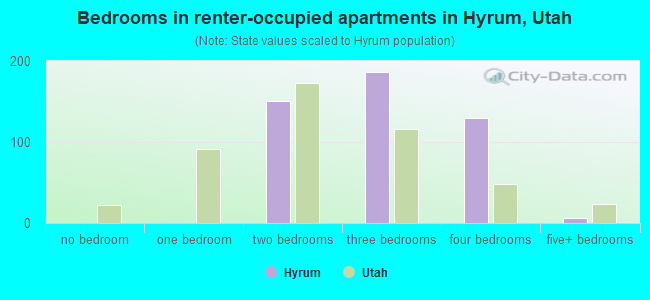
- Bedrooms in renter-occupied apartments in Hyrum, Utah
- 0no bedroom
- 01 bedroom
- 1512 bedrooms
- 1863 bedrooms
- 1304 bedrooms
- 65+ bedrooms
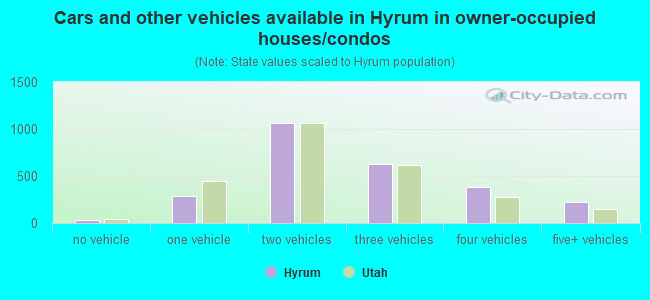
- Cars and other vehicles available in Hyrum in owner-occupied houses/condos
- 34no vehicle
- 2831 vehicle
- 1,0642 vehicles
- 6293 vehicles
- 3784 vehicles
- 2195+ vehicles
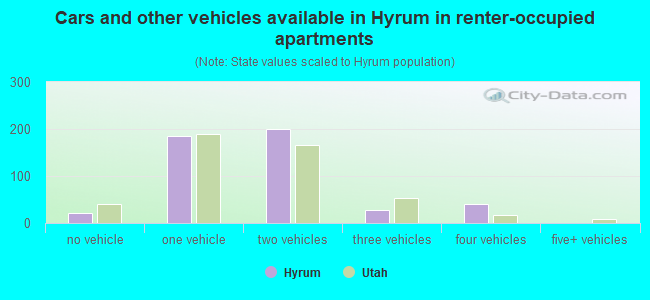
- Cars and other vehicles available in Hyrum in renter-occupied apartments
- 21no vehicle
- 1851 vehicle
- 1992 vehicles
- 283 vehicles
- 414 vehicles
- 05+ vehicles
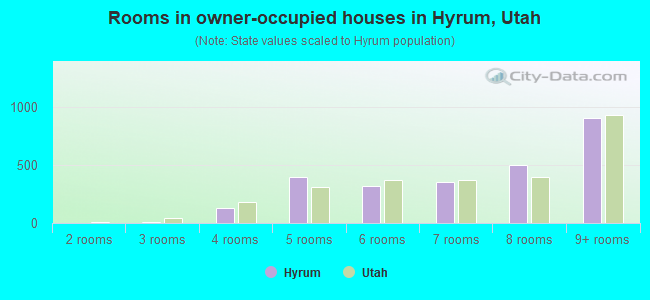
- Rooms in owner-occupied houses in Hyrum, Utah
- 01 room
- 02 rooms
- 123 rooms
- 1294 rooms
- 3955 rooms
- 3186 rooms
- 3517 rooms
- 4998 rooms
- 9049+ rooms
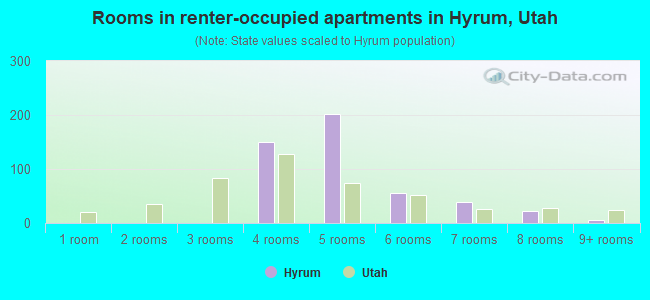
- Rooms in renter-occupied apartments in Hyrum, Utah
- 01 room
- 02 rooms
- 03 rooms
- 1504 rooms
- 2015 rooms
- 566 rooms
- 387 rooms
- 228 rooms
- 69+ rooms
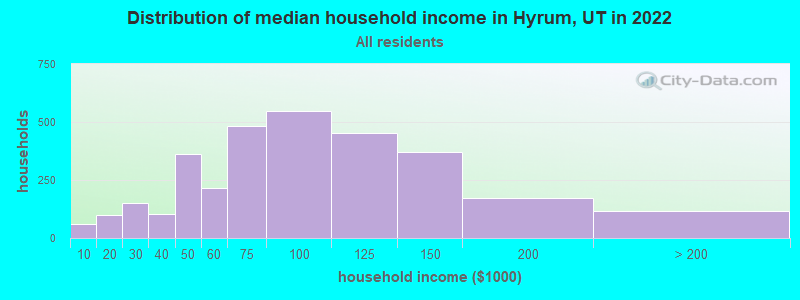
Hyrum, UT household income distribution

- 61Less than $10,000
- 98$10,000 to $19,999
- 149$20,000 to $29,999
- 105$30,000 to $39,999
- 363$40,000 to $49,999
- 214$50,000 to $59,999
- 483$60,000 to $74,999
- 546$75,000 to $99,999
- 454$100,000 to $124,999
- 371$125,000 to $149,999
- 172$150,000 to $199,999
- 115$200,000 or more
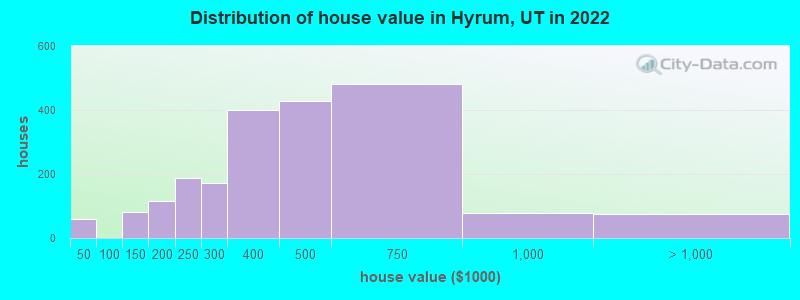
Home value of owner - occupied houses in 2022 in Hyrum, UT
-
- 47Less than $10,000
- 3$10,000 to $14,999
- 7$30,000 to $34,999
- 18$100,000 to $124,999
- 61$125,000 to $149,999
- 40$150,000 to $174,999
- 76$175,000 to $199,999
- 189$200,000 to $249,999
- 171$250,000 to $299,999
- 399$300,000 to $399,999
- 428$400,000 to $499,999
- 481$500,000 to $749,999
- 77$750,000 to $999,999
- 67$1,000,000 to $1,499,999
- 7$2,000,000 or more
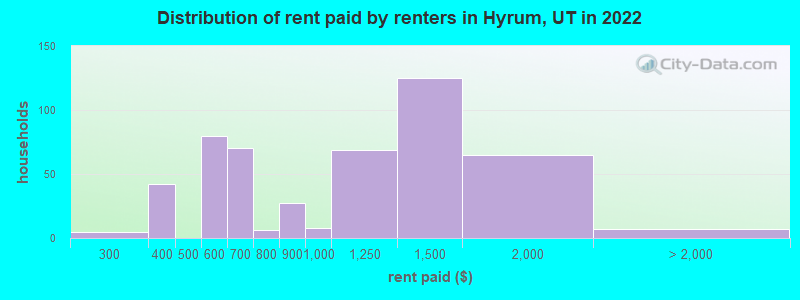
Rent paid by renters in 2022 in Hyrum, UT
-
- 4$250 to $299
- 41$350 to $399
- 9$500 to $549
- 70$550 to $599
- 70$600 to $649
- 5$750 to $799
- 27$800 to $899
- 7$900 to $999
- 68$1,000 to $1,249
- 124$1,250 to $1,499
- 65$1,500 to $1,999
- 7No cash rent
Percentage of workers working in this county: 93.1%
Number of people working at home: 557 (11.7% of all workers)
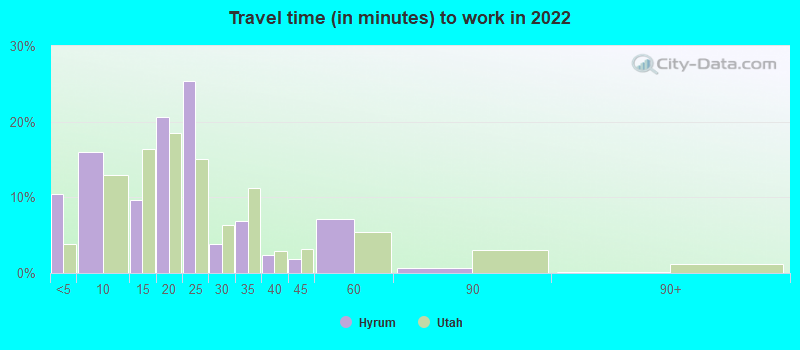
Travel time to work (commute)
- Less than 5 minutes: 405
- 5 to 9 minutes: 728
- 10 to 14 minutes: 379
- 15 to 19 minutes: 914
- 20 to 24 minutes: 903
- 25 to 29 minutes: 284
- 30 to 34 minutes: 339
- 35 to 39 minutes: 56
- 40 to 44 minutes: 35
- 45 to 59 minutes: 226
- 60 to 89 minutes: 45
- 90 or more minutes: 16
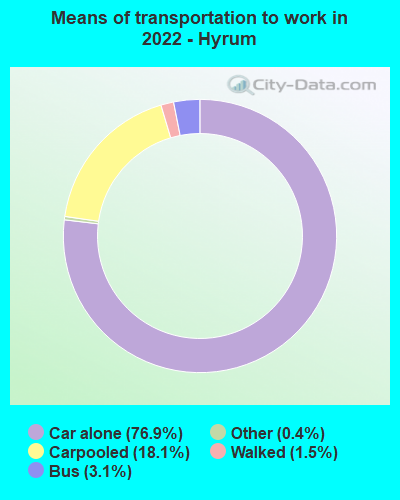
Means of transportation to work:
- Drove a car alone: 2,230 (64.3%)
- Carpooled: 487 (14.0%)
- Bus: 134 (3.9%)
- Taxi: 14 (0.4%)
- Walked: 37 (1.1%)
- Worked at home: 557 (16.1%)
- Unemployment by race in 2022
- Unemployment rate for White non-Hispanic residents
- 2.3%Males
- 4.4%Females
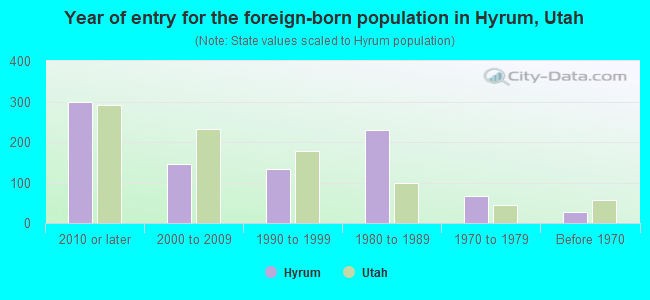
- Year of entry for the foreign-born population in Hyrum, Utah
- 2982010 or later
- 1452000 to 2009
- 1341990 to 1999
- 2291980 to 1989
- 661970 to 1979
- 27Before 1970
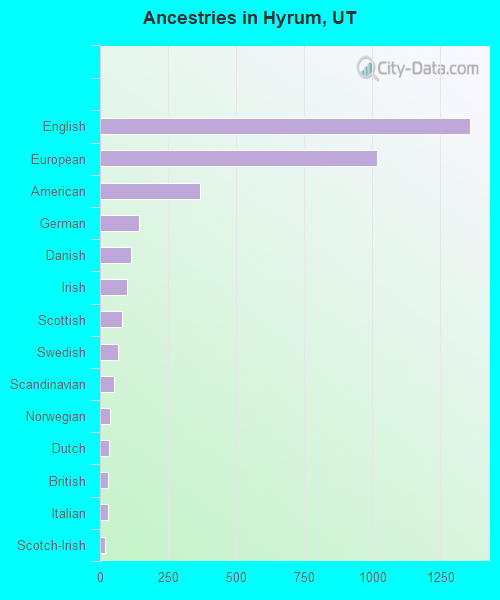
First ancestries reported:
- English: 1,361 (26.7%)
- European: 1,016 (20.0%)
- American: 366 (7.2%)
- German: 143 (2.8%)
- Danish: 113 (2.2%)
- Irish: 99 (1.9%)
- Scottish: 81 (1.6%)
- Swedish: 67 (1.3%)
- Scandinavian: 50 (1.0%)
- Norwegian: 37 (0.7%)
- Dutch: 32 (0.6%)
- British: 30 (0.6%)
- Italian: 29 (0.6%)
- Scotch-Irish: 19 (0.4%)
- Canadian: 9 (0.2%)
- Welsh: 7 (0.1%)
- Polish: 5 (0.10%)
- French: 4 (0.08%)
Most common places of birth for foreign-born residents (%):
| Hyrum: | 44.7% (341) |
| Utah: | 36.1% (99,740) |
| Hyrum: | 19.7% (150) |
| Utah: | 2.9% (7,901) |
| Hyrum: | 13.8% (105) |
| Utah: | 2.7% (7,472) |
| Hyrum: | 5.0% (38) |
| Utah: | 0.6% (1,529) |
| Hyrum: | 3.5% (27) |
| Utah: | 2.6% (7,062) |
| Hyrum: | 1.8% (14) |
| Utah: | 0.6% (1,545) |
Place of birth for U.S.-born residents:
- This state: 7,441
- Other state: 1,851
- Northeast: 64
- Midwest: 261
- South: 150
- West: 1,333
90.0% of Hyrum residents lived in the same house 1 years ago.
Out of people who lived in different houses, 39.8% lived in this county.
Out of people who lived in different counties, 73.4% lived in Utah.
| Hyrum: | 90.0% |
| State average: | 85.7% |
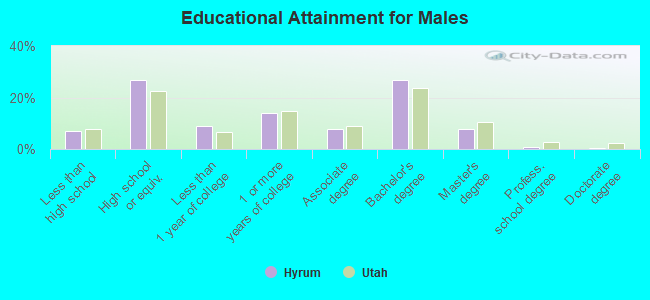
Education attainment for males 25 years and older:
- No schooling: 97
- Nursery to 4th grade: 0
- 5th and 6th grade: 8
- 7th and 8th grade: 6
- 9th grade: 5
- 10th grade: 36
- 11th grade: 8
- 12th grade, no diploma: 36
- High school graduate (or equivalency): 744
- Less than 1 year of college: 254
- Some college more than 1 year, no degree: 394
- Associate degree: 222
- Bachelor's degree: 743
- Master's degree: 213
- Professional school degree: 17
- Doctorate degree: 8
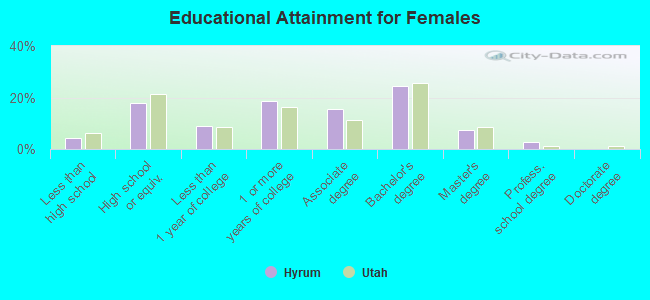
Education attainment for females 25 years and older:
- No schooling: 54
- Nursery to 4th grade: 20
- 5th and 6th grade: 0
- 7th and 8th grade: 2
- 9th grade: 0
- 10th grade: 17
- 11th grade: 0
- 12th grade, no diploma: 30
- High school graduate (or equivalency): 495
- Less than 1 year of college: 251
- Some college more than 1 year, no degree: 522
- Associate degree: 427
- Bachelor's degree: 678
- Master's degree: 207
- Professional school degree: 76
- Doctorate degree: 0


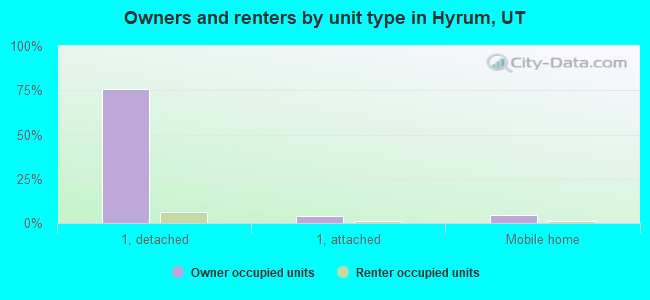
Housing units in structures:
- One, detached: 2,688
- One, attached: 160
- Two: 8
- 3 or 4: 146
- 5 to 9: 10
- Mobile homes: 46
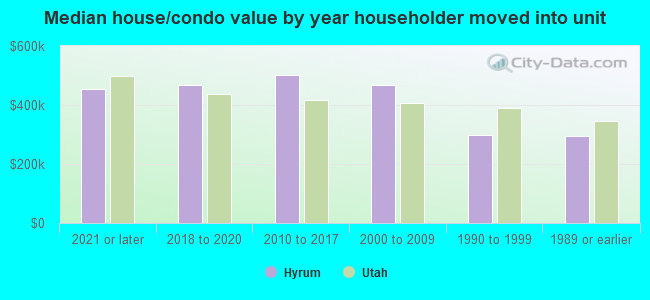
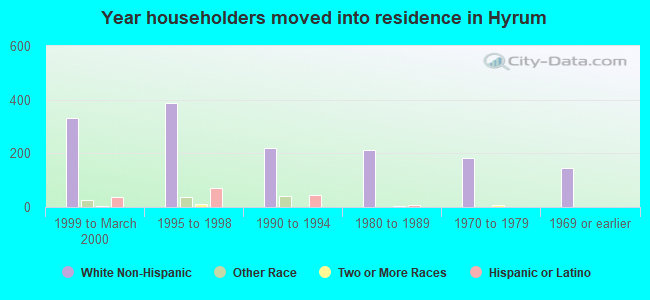
House/condo owner moved in on average 6 years ago
Renter moved in on average 5 years ago
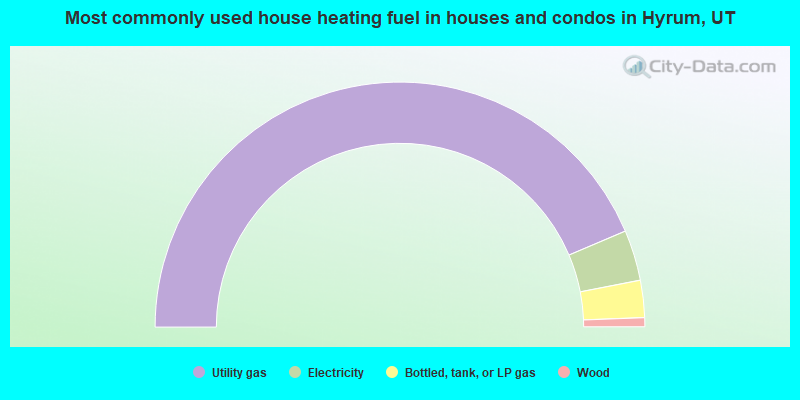
- 87.2%Utility gas
- 6.7%Electricity
- 4.9%Bottled, tank, or LP gas
- 1.2%Wood
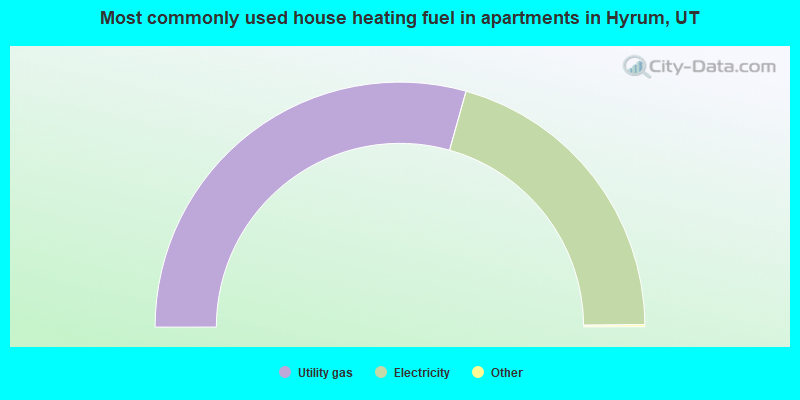
- 58.9%Utility gas
- 41.1%Electricity
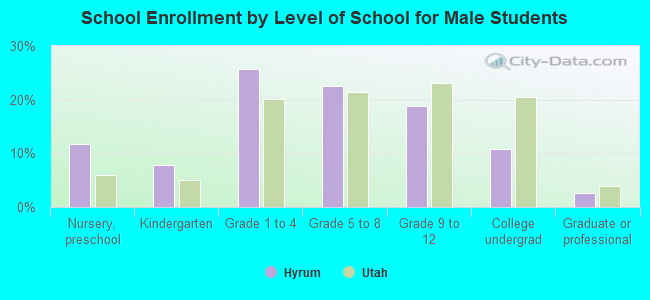
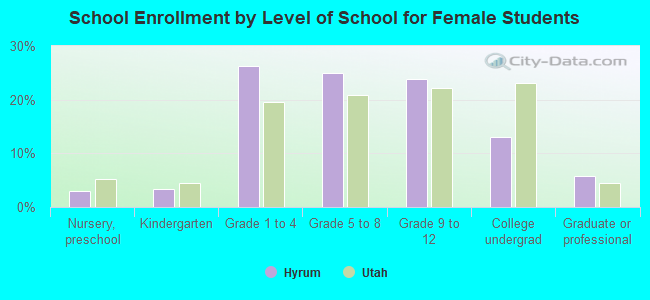
Private vs. public school enrollment:
| Here: | 9.5% |
| Utah: | 7.2% |
| Here: | 0.0% |
| Utah: | 5.3% |
| Here: | 8.0% |
| Utah: | 26.7% |