Independence, MO (Missouri) Houses and Residents
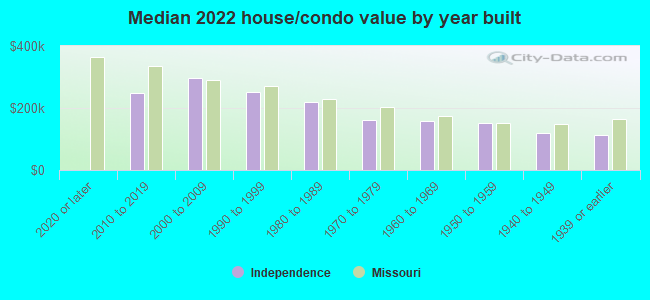
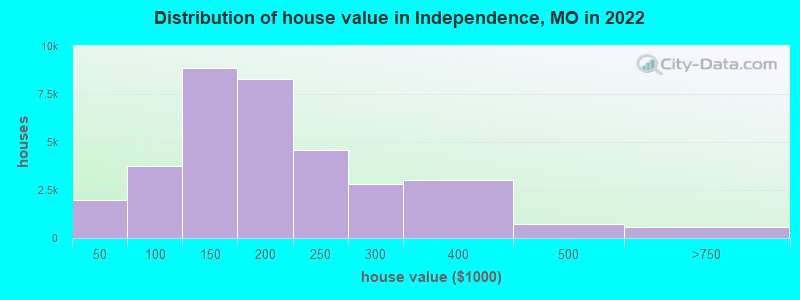
Estimated median house or condo value in 2022: $165,200 (it was $76,000 in 2000 )
Independence:
$165,200Missouri:
$221,200
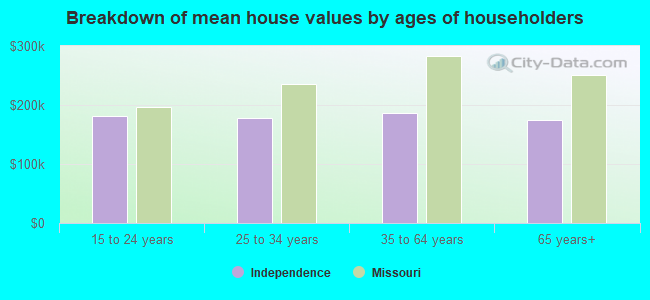
Lower value quartile - upper value quartile: $117,700 - $235,700Mean price in 2022: Detached houses: $185,340 Here:
$185,340State:
$278,068
Townhouses or other attached units: $175,497 Here:
$175,497State:
$260,773
In 2-unit structures: $143,622 Here:
$143,622State:
$172,667
In 5-or-more-unit structures: $164,614 Here:
$164,614State:
$263,082
Mobile homes: $36,231 Here:
$36,231State:
$95,912
Total population: 117,494 (Urban population: 110,228, Rural population: 2,979 (100 farm, 2,879 nonfarm ))
Houses: 57,341 (53,919 occupied: 33,865 owner occupied, 20,054 renter occupied )
% of renters here:
37%State:
32%
Housing density: 732 houses/condos per square mile
Median price asked for vacant for-sale houses and condos in 2022: $125,440.
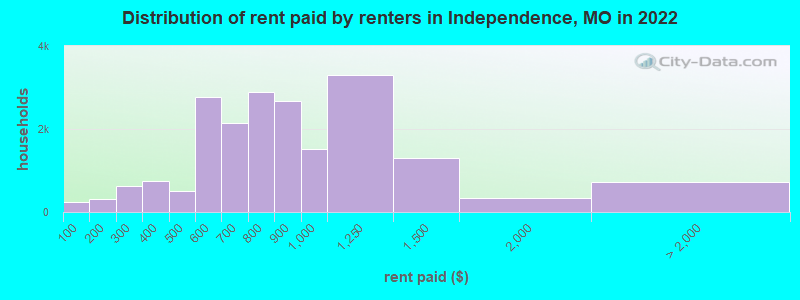
Median contract rent in 2022: $783 (lower quartile is $580, upper quartile is $1,014)
Median rent asked for vacant for-rent units in 2022: $501
Median gross rent in Independence, MO in 2022: $1,036
Housing units in Independence with a mortgage: 20,169 (1,143 second mortgage, 105 home equity loan, 991 both second mortgage and home equity loan )Houses without a mortgage: 147
Median household income for houses/condos with a mortgage: $74,129
Median household income for apartments without a mortgage: $53,255
Median monthly housing costs: $993
Data:
Median house or condo value ($)
Median house or condo value ($ change since 2000)
Median house or condo value ($) - White
Median house or condo value ($) - Black or African American
Median house or condo value ($) - Asian
Median house or condo value ($) - Hispanic or Latino
Median house or condo value ($) - American Indian and Alaska Native
Median house or condo value ($) - Multirace
Median house or condo value ($) - Other Race
Median price asked for mobile homes ($)
Household density (households per square mile)
Mean house or condo value by units in structure - 1, detached ($)
Mean house or condo value by units in structure - 1, attached ($)
Mean house or condo value by units in structure - 2 ($)
Mean house or condo value by units in structure by units in structure - 3 or 4 ($)
Mean house or condo value by units in structure - 5 or more ($)
Mean house or condo value by units in structure - Boat, RV, van, etc. ($)
Mean house or condo value by units in structure - Mobile home ($)
Median contract rent ($)
Median contract rent - Lower quartile ($)
Median contract rent - Upper quartile ($)
Median gross rent ($)
Urban houses (%)
Rural houses (%)
Houses occupied (%)
Houses occupied (% change since 2000)
Houses owner occupied (%)
Houses owner occupied (% change since 2000)
Houses renter occupied (%)
Houses renter occupied (% change since 2000)
Vacant housing units - For rent (%)
Vacant housing units - For rent (% change since 2000)
Vacant housing units - For sale only (%)
Vacant housing units - For sale only (% change since 2000)
Vacant housing units - Rented or sold, not occupied (%)
Vacant housing units - Rented or sold, not occupied (% change since 2000)
Vacant housing units - For seasonal, recreational, or occasional use (%)
Vacant housing units - For seasonal, recreational, or occasional use (% change since 2000)
Vacant housing units - For migrant workers (%)
Vacant housing units - For migrant workers (% change since 2000)
Vacant housing units - Other vacant (%)
Vacant housing units - Other vacant (% change since 2000)
Median monthly housing costs ($)
Median household income for houses/condos with a mortgage ($)
Median household income for houses/condos without a mortgage ($)
Median household income ($)
Median household income ($) - White
Median household income ($) - Black or African American
Median household income ($) - Asian
Median household income ($) - Hispanic or Latino
Median household income ($) - American Indian and Alaska Native
Median household income ($) - Multirace
Median household income ($) - Other Race
Mortgage status - with mortgage (%)
Mortgage status - with second mortgage (%)
Mortgage status - with home equity loan (%)
Mortgage status - with both second mortgage and home equity loan (%)
Mortgage status - without a mortgage (%)
Median year house/condo built
Median year apartment built
Household type by relationship - Male householder living alone (%)
Household type by relationship - Male householder not living alone (%)
Household type by relationship - Female householder living alone (%)
Household type by relationship - Female householder not living alone (%)
Household type by relationship - Opposite-Sex spouse (%)
Household type by relationship - Same-Sex spouse (%)
Household type by relationship - Opposite-Sex unmarried partner (%)
Household type by relationship - Same-Sex unmarried partner (%)
Household type by relationship - In group quarters (%)
Size of family households - 2-person household (%)
Size of family households - 3-person household (%)
Size of family households - 4-person household (%)
Size of family households - 5-person household (%)
Size of family households - 6-person household (%)
Size of family households - 7-or-more-person household (%)
Size of nonfamily households - 1-person household (%)
Size of nonfamily households - 2-person household (%)
Size of nonfamily households - 3-person household (%)
Size of nonfamily households - 4-person household (%)
Size of nonfamily households - 5-person household (%)
Size of nonfamily households - 6-person household (%)
Size of nonfamily households - 7-or-moreperson household (%)
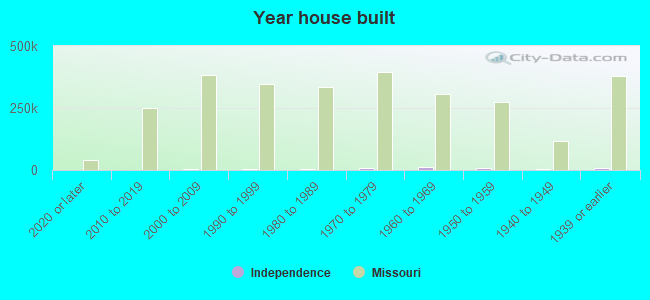
Year house built - Built 2010 or later (%)
Year house built - Built 2000 to 2009 (%)
Year house built - Built 1990 to 1999 (%)
Year house built - Built 1980 to 1989 (%)
Year house built - Built 1970 to 1979 (%)
Year house built - Built 1960 to 1969 (%)
Year house built - Built 1950 to 1959 (%)
Year house built - Built 1940 to 1949 (%)
Year house built - Built 1939 or earlier (%)
Median number of rooms in houses and condos
Median number of rooms in apartments
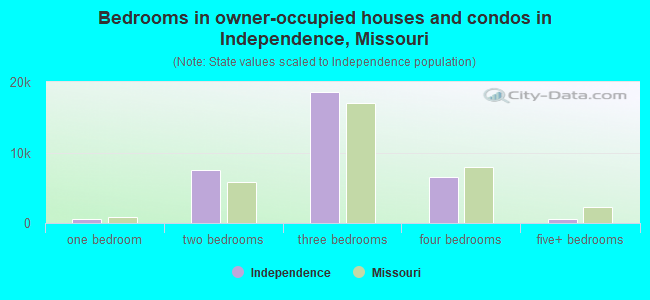
Median number of bedrooms in owner occupied houses
Mean number of bedrooms in owner occupied houses
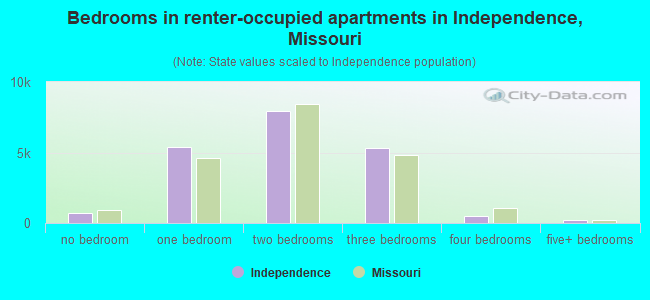
Median number of bedrooms in renter occupied houses
Mean number of bedrooms in renter occupied houses
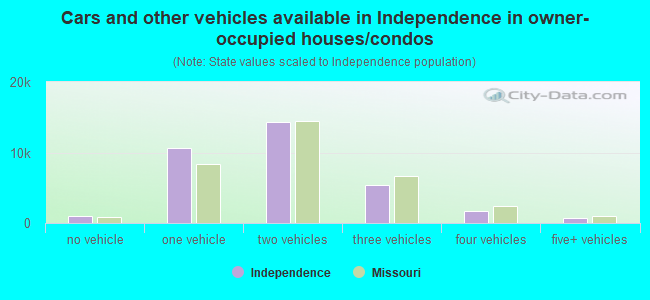
Median number of vehichles in owner occupied houses
Mean number of vehichles in owner occupied houses
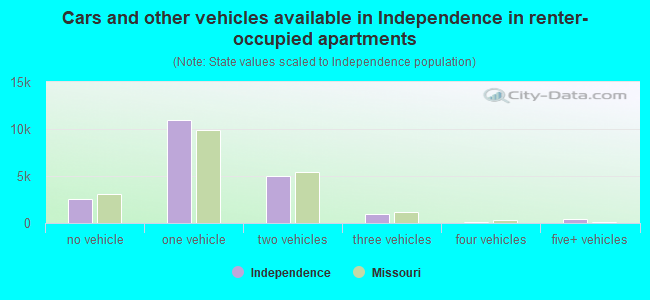
Median number of vehichles in renter occupied houses
Mean number of vehichles in renter occupied houses
Rooms in owner-occupied houses - 1 room (%)
Rooms in owner-occupied houses - 2 rooms (%)
Rooms in owner-occupied houses - 3 rooms (%)
Rooms in owner-occupied houses - 4 rooms (%)
Rooms in owner-occupied houses - 5 rooms (%)
Rooms in owner-occupied houses - 6 rooms (%)
Rooms in owner-occupied houses - 7 rooms (%)
Rooms in owner-occupied houses - 8 rooms (%)
Rooms in owner-occupied houses - 9+ rooms (%)
Rooms in renter-occupied houses - 1 room (%)
Rooms in renter-occupied houses - 2 rooms (%)
Rooms in renter-occupied houses - 3 rooms (%)
Rooms in renter-occupied houses - 4 rooms (%)
Rooms in renter-occupied houses - 5 rooms (%)
Rooms in renter-occupied houses - 6 rooms (%)
Rooms in renter-occupied houses - 7 rooms (%)
Rooms in renter-occupied houses - 8 rooms (%)
Rooms in renter-occupied houses - 9+ rooms (%)
Bedrooms in owner-occupied houses - no bedrooms (%)
Bedrooms in owner-occupied houses - 1 bedroom (%)
Bedrooms in owner-occupied houses - 2 bedrooms (%)
Bedrooms in owner-occupied houses - 3 bedrooms (%)
Bedrooms in owner-occupied houses - 4 bedrooms (%)
Bedrooms in owner-occupied houses - 5+ bedrooms (%)
Bedrooms in renter-occupied houses - no bedrooms (%)
Bedrooms in renter-occupied houses - 1 bedroom (%)
Bedrooms in renter-occupied houses - 2 bedrooms (%)
Bedrooms in renter-occupied houses - 3 bedrooms (%)
Bedrooms in renter-occupied houses - 4 bedrooms (%)
Bedrooms in renter-occupied houses - 5+ bedrooms (%)
Vehicles available in owner-occupied houses - no vehicle available (%)
Vehicles available in owner-occupied houses - 1 vehicle available(%)
Vehicles available in owner-occupied houses - 2 Vehicles available (%)
Vehicles available in owner-occupied houses - 3 Vehicles available (%)
Vehicles available in owner-occupied houses - 4 Vehicles available (%)
Vehicles available in owner-occupied houses - 5+ Vehicles available (%)
Vehicles available in renter-occupied houses - no vehicle available (%)
Vehicles available in renter-occupied houses - 1 vehicle available (%)
Vehicles available in renter-occupied houses - 2 Vehicles available (%)
Vehicles available in renter-occupied houses - 3 Vehicles available (%)
Vehicles available in renter-occupied houses - 4 Vehicles available (%)
Vehicles available in renter-occupied houses - 5+ Vehicles available (%)
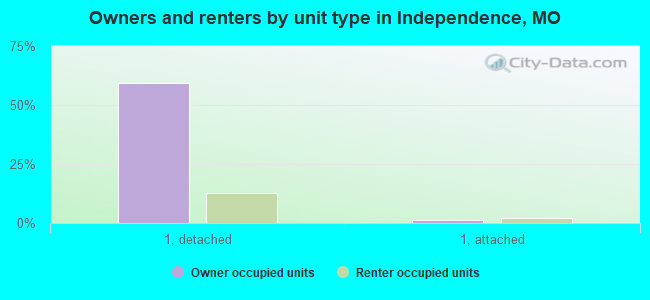
Housing units in structures - 1, detached (%)
Housing units in structures - 1, attached (%)
Housing units in structures - 2 (%)
Housing units in structures - 3 or 4 (%)
Housing units in structures - 5 to 9 (%)
Housing units in structures - 10 to 19 (%)
Housing units in structures - 20 to 49 (%)
Housing units in structures - 50 or more (%)
Housing units in structures - Mobile home (%)
Housing units in structures - Boat, RV, van, etc. (%)
Housing units in structures - Owners - 1, detached (%)
Housing units in structures - Owners - 1, attached (%)
Housing units in structures - Owners - 2 (%)
Housing units in structures - Owners - 3 or 4 (%)
Housing units in structures - Owners - 5 to 9 (%)
Housing units in structures - Owners - 10 to 19 (%)
Housing units in structures - Owners - 20 to 49 (%)
Housing units in structures - Owners - 50 or more (%)
Housing units in structures - Owners - Mobile home (%)
Housing units in structures - Owners - Boat, RV, van, etc. (%)
Housing units in structures - Renters - 1, detached (%)
Housing units in structures - Renters - 1, attached (%)
Housing units in structures - Renters - 2 (%)
Housing units in structures - Renters - 3 or 4 (%)
Housing units in structures - Renters - 5 to 9 (%)
Housing units in structures - Renters - 10 to 19 (%)
Housing units in structures - Renters - 20 to 49 (%)
Housing units in structures - Renters - 50 or more (%)
Housing units in structures - Renters - Mobile home (%)
Housing units in structures - Renters - Boat, RV, van, etc. (%)
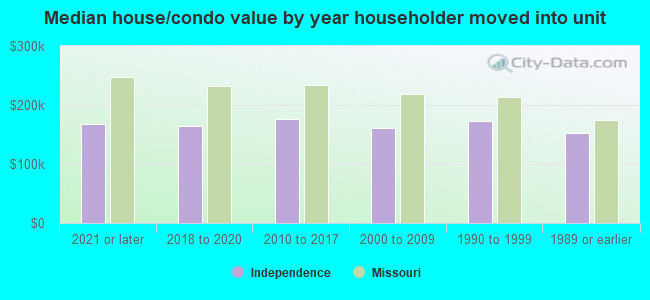
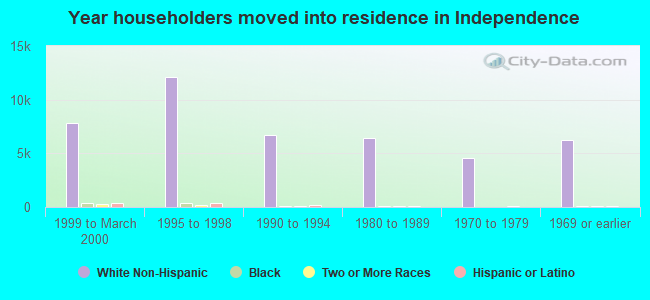
House/condo owner moved in on average (years ago)
Renter moved in on average (years ago)
Year householder moved into unit - Moved in 1999 to March 2000 (%)
Year householder moved into unit - Moved in 1999 to March 2000 (%) - White
Year householder moved into unit - Moved in 1999 to March 2000 (%) - Black or African American
Year householder moved into unit - Moved in 1999 to March 2000 (%) - Asian
Year householder moved into unit - Moved in 1999 to March 2000 (%) - Hispanic or Latino
Year householder moved into unit - Moved in 1999 to March 2000 (%) - American Indian and Alaska Native
Year householder moved into unit - Moved in 1999 to March 2000 (%) - Multirace
Year householder moved into unit - Moved in 1999 to March 2000 (%) - Other Race
Year householder moved into unit - Moved in 1995 to 1998 (%)
Year householder moved into unit - Moved in 1995 to 1998 (%) - White
Year householder moved into unit - Moved in 1995 to 1998 (%) - Black or African American
Year householder moved into unit - Moved in 1995 to 1998 (%) - Asian
Year householder moved into unit - Moved in 1995 to 1998 (%) - Hispanic or Latino
Year householder moved into unit - Moved in 1995 to 1998 (%) - American Indian and Alaska Native
Year householder moved into unit - Moved in 1995 to 1998 (%) - Multirace
Year householder moved into unit - Moved in 1995 to 1998 (%) - Other Race
Year householder moved into unit - Moved in 1990 to 1994 (%)
Year householder moved into unit - Moved in 1990 to 1994 (%) - White
Year householder moved into unit - Moved in 1990 to 1994 (%) - Black or African American
Year householder moved into unit - Moved in 1990 to 1994 (%) - Asian
Year householder moved into unit - Moved in 1990 to 1994 (%) - Hispanic or Latino
Year householder moved into unit - Moved in 1990 to 1994 (%) - American Indian and Alaska Native
Year householder moved into unit - Moved in 1990 to 1994 (%) - Multirace
Year householder moved into unit - Moved in 1990 to 1994 (%) - Other Race
Year householder moved into unit - Moved in 1980 to 1989 (%)
Year householder moved into unit - Moved in 1980 to 1989 (%) - White
Year householder moved into unit - Moved in 1980 to 1989 (%) - Black or African American
Year householder moved into unit - Moved in 1980 to 1989 (%) - Asian
Year householder moved into unit - Moved in 1980 to 1989 (%) - Hispanic or Latino
Year householder moved into unit - Moved in 1980 to 1989 (%) - American Indian and Alaska Native
Year householder moved into unit - Moved in 1980 to 1989 (%) - Multirace
Year householder moved into unit - Moved in 1980 to 1989 (%) - Other Race
Year householder moved into unit - Moved in 1970 to 1979 (%)
Year householder moved into unit - Moved in 1970 to 1979 (%) - White
Year householder moved into unit - Moved in 1970 to 1979 (%) - Black or African American
Year householder moved into unit - Moved in 1970 to 1979 (%) - Asian
Year householder moved into unit - Moved in 1970 to 1979 (%) - Hispanic or Latino
Year householder moved into unit - Moved in 1970 to 1979 (%) - American Indian and Alaska Native
Year householder moved into unit - Moved in 1970 to 1979 (%) - Multirace
Year householder moved into unit - Moved in 1970 to 1979 (%) - Other Race
Year householder moved into unit - Moved in 1969 or earlier (%)
Year householder moved into unit - Moved in 1969 or earlier (%) - White
Year householder moved into unit - Moved in 1969 or earlier (%) - Black or African American
Year householder moved into unit - Moved in 1969 or earlier (%) - Asian
Year householder moved into unit - Moved in 1969 or earlier (%) - Hispanic or Latino
Year householder moved into unit - Moved in 1969 or earlier (%) - American Indian and Alaska Native
Year householder moved into unit - Moved in 1969 or earlier (%) - Multirace
Year householder moved into unit - Moved in 1969 or earlier (%) - Other Race
Housing units lacking complete plumbing facilities (%)
Housing units lacking complete kitchen facilities (%)
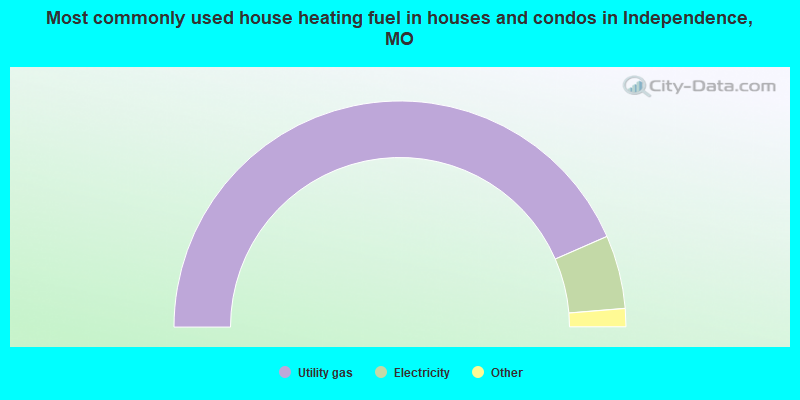
House heating fuel used in houses and condos - Utility gas (%)
House heating fuel used in houses and condos - Bottled, tank, or LP gas (%)
House heating fuel used in houses and condos - Electricity (%)
House heating fuel used in houses and condos - Fuel oil, kerosene, etc. (%)
House heating fuel used in houses and condos - Coal or coke (%)
House heating fuel used in houses and condos - Wood (%)
House heating fuel used in houses and condos - Solar energy (%)
House heating fuel used in houses and condos - Other fuel (%)
House heating fuel used in houses and condos - No fuel used (%)
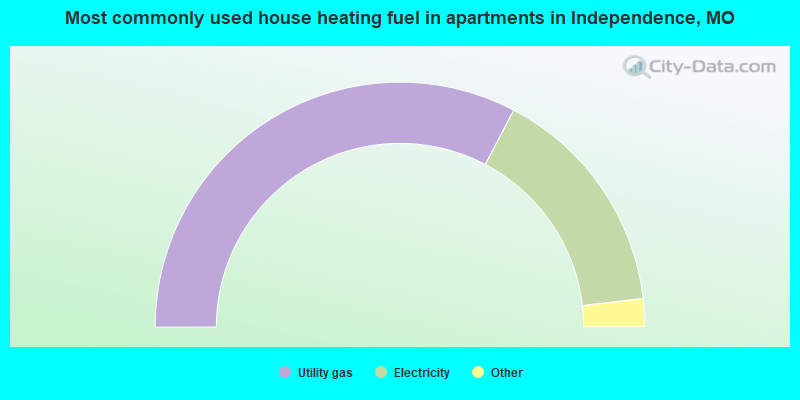
House heating fuel used in apartments - Utility gas (%)
House heating fuel used in apartments - Bottled, tank, or LP gas (%)
House heating fuel used in apartments - Electricity (%)
House heating fuel used in apartments - Fuel oil, kerosene, etc. (%)
House heating fuel used in apartments - Coal or coke (%)
House heating fuel used in apartments - Wood (%)
House heating fuel used in apartments - Solar energy (%)
House heating fuel used in apartments - Other fuel (%)
House heating fuel used in apartments - No fuel used (%)
Latest news about housing in Independence, MO collected exclusively by city-data.com from local newspapers, TV, and radio stations
Median year house/condo built: 1966Median year apartment built: 1975Household type by relationship:
Households: 121,211
Male householders: 26,627 (9,524 living alone ), Female householders: 27,292 (10,612 living alone )18,686 spouses (18,311 opposite-sex spouses ), 5,973 unmarried partners , (5,656 opposite-sex unmarried partners ), 30,700 children (28,278 natural , 454 adopted , 1,968 stepchildren ), 2,544 grandchildren , 1,040 brothers or sisters , 1,027 parents , 0 foster children , 2,876 other relatives , 2,931 non-relatives In group quarters: 1,515
Size of family households: 15,232 2-persons , 6,237 3-persons , 4,345 4-persons , 2,153 5-persons , 1,207 6-persons , 690 7-or-more-persons .
Size of nonfamily households: 20,136 1-person , 3,257 2-persons , 253 3-persons , 409 4-persons .
12,639 married couples with children. single-parent households (4,908 men , 7,123 women ).
93.4% of residents of Independence speak English at home. of residents speak Spanish at home (63% speak English very well , 25% speak English well , 5% speak English not well , 7% don't speak English at all ).of residents speak other Indo-European language at home (71% speak English very well , 20% speak English well , 9% speak English not well ).of residents speak Asian or Pacific Island language at home (69% speak English very well , 10% speak English well , 19% speak English not well , 2% don't speak English at all ).of residents speak other language at home (79% speak English very well , 21% speak English well ).
Foreign born population: 7,445 (6.1%)of them are naturalized citizens )
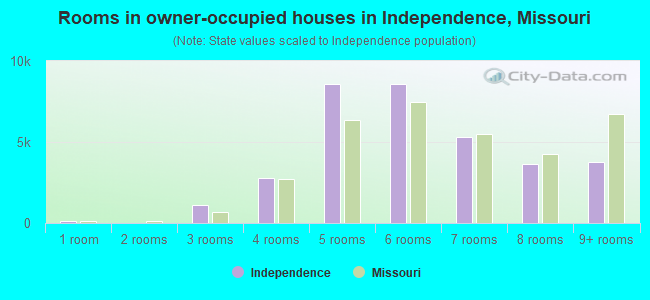
Median number of rooms in houses and condos:
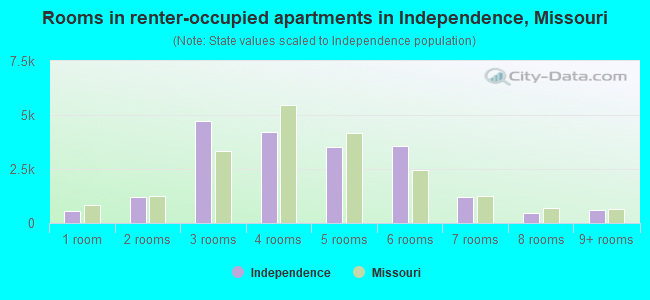
Median number of rooms in apartments
Owner-occupied Renter-occupied
Rooms in owner-occupied houses in Independence, Missouri
126 1 room 0 2 rooms 1,115 3 rooms 2,756 4 rooms 8,594 5 rooms 8,557 6 rooms 5,300 7 rooms 3,670 8 rooms 3,747 9+ rooms
Rooms in renter-occupied apartments in Independence, Missouri
577 1 room 1,197 2 rooms 4,718 3 rooms 4,202 4 rooms 3,528 5 rooms 3,564 6 rooms 1,211 7 rooms 445 8 rooms 612 9+ rooms
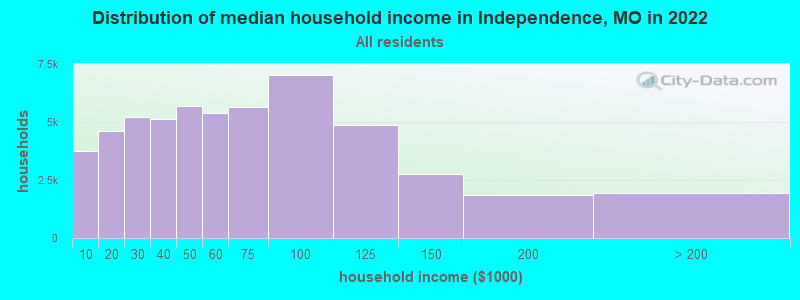
Independence, MO household income distribution 3,759 Less than $10,0004,601 $10,000 to $19,9995,219 $20,000 to $29,9995,147 $30,000 to $39,9995,696 $40,000 to $49,9995,384 $50,000 to $59,9995,644 $60,000 to $74,9997,025 $75,000 to $99,9994,890 $100,000 to $124,9992,774 $125,000 to $149,9991,849 $150,000 to $199,9991,931 $200,000 or more
Home value of owner - occupied houses in 2022 in Independence, MO 310 Less than $10,000117 $10,000 to $14,999154 $15,000 to $19,999119 $20,000 to $24,999117 $25,000 to $29,99968 $30,000 to $34,999389 $35,000 to $39,999689 $40,000 to $49,999329 $50,000 to $59,999368 $60,000 to $69,999432 $70,000 to $79,9991,338 $80,000 to $89,999573 $90,000 to $99,9994,887 $100,000 to $124,9993,960 $125,000 to $149,9995,057 $150,000 to $174,9993,238 $175,000 to $199,9994,562 $200,000 to $249,9992,837 $250,000 to $299,9993,045 $300,000 to $399,999707 $400,000 to $499,999473 $500,000 to $749,99996 $750,000 to $999,999Rent paid by renters in 2022 in Independence, MO 234 Less than $100312 $150 to $199167 $200 to $249454 $250 to $299357 $300 to $349393 $350 to $399503 $400 to $4491,960 $500 to $549810 $550 to $599354 $600 to $6491,790 $650 to $6991,428 $700 to $7491,452 $750 to $7992,664 $800 to $8991,526 $900 to $9993,309 $1,000 to $1,2491,290 $1,250 to $1,499326 $1,500 to $1,999120 $2,000 to $2,499605 No cash rent
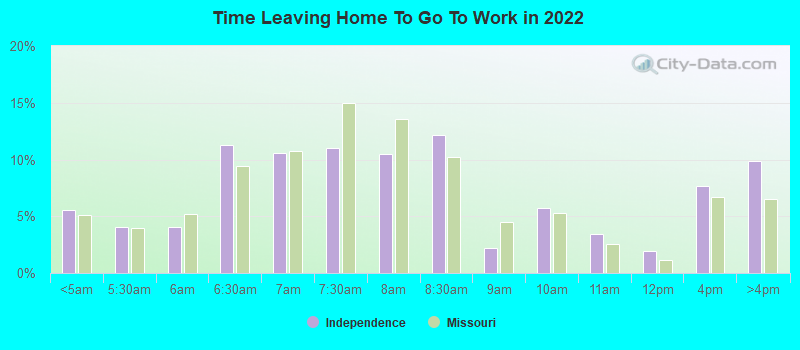
Percentage of workers working in this county: 75.8%Number of people working at home: 6,637 (11.7% of all workers )
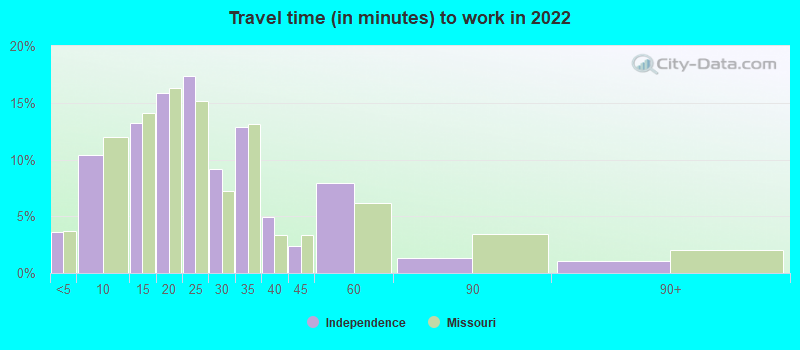
Travel time to work (commute)
Less than 5 minutes: 1,1925 to 9 minutes: 4,36010 to 14 minutes: 4,20915 to 19 minutes: 9,02420 to 24 minutes: 9,18525 to 29 minutes: 5,01130 to 34 minutes: 7,08935 to 39 minutes: 1,45240 to 44 minutes: 2,38445 to 59 minutes: 4,07960 to 89 minutes: 1,08290 or more minutes: 1,252
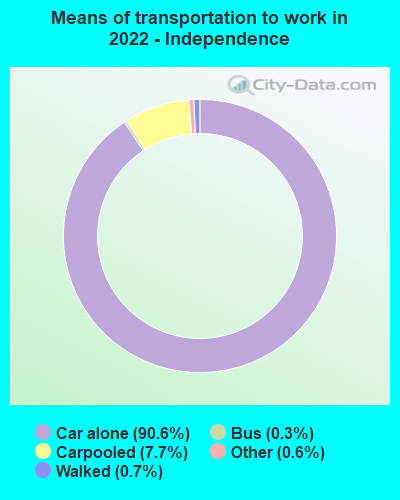
Means of transportation to work:
Drove a car alone: 29,924 (76.3%)Carpooled: 2,509 (6.4%)Bus : 86 (0.2%)Ferryboat: 3 (0.0%)Taxi: 193 (0.5%)Bicycle: 24 (0.1%)Walked: 184 (0.5%)Worked at home: 6,637 (16.9%)
Unemployment by race in 2022
Unemployment rate for White non-Hispanic residents 2.5% Males6.1% FemalesUnemployment rate for Black residents 7.2% Males3.5% FemalesUnemployment rate for Asian residents 5.4% Males2.0% FemalesUnemployment rate for other race residents 2.1% MalesUnemployment rate for two or more race residents 6.0% Males2.8% FemalesUnemployment rate for Hispanic or Latino residents 2.5% Males1.6% Females
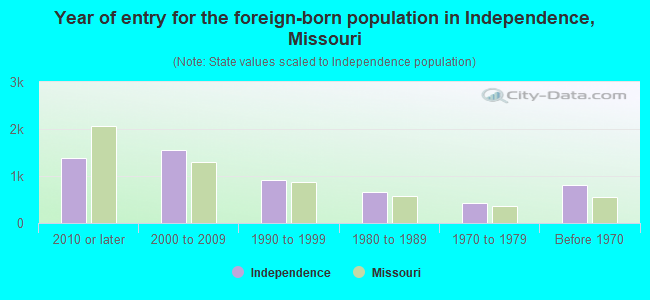
Year of entry for the foreign-born population in Independence, Missouri
1,390 2010 or later 1,558 2000 to 2009 909 1990 to 1999 655 1980 to 1989 436 1970 to 1979 798 Before 1970
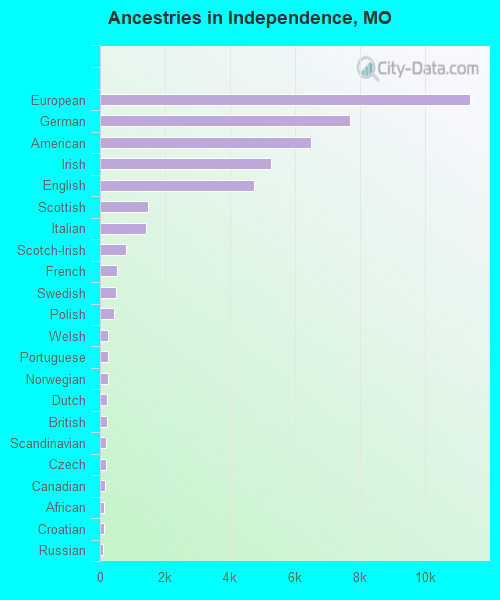
First ancestries reported:
European: 11,406 (17.4%)
German: 7,712 (11.8%)
American: 6,494 (9.9%)
Irish: 5,252 (8.0%)
English: 4,741 (7.2%)
Scottish: 1,468 (2.2%)
Italian: 1,410 (2.2%)
Scotch-Irish: 806 (1.2%)
French: 521 (0.8%)
Swedish: 485 (0.7%)
Polish: 431 (0.7%)
Welsh: 259 (0.4%)
Portuguese: 256 (0.4%)
Norwegian: 245 (0.4%)
Dutch: 228 (0.3%)
British: 204 (0.3%)
Scandinavian: 198 (0.3%)
Czech: 171 (0.3%)
Canadian: 153 (0.2%)
African: 123 (0.2%)
Croatian: 120 (0.2%)
Russian: 104 (0.2%)
French Canadian: 88 (0.1%)
Romanian: 87 (0.1%)
Danish: 82 (0.1%)
Slovak: 75 (0.1%)
Jamaican: 67 (0.1%)
Greek: 61 (0.09%)
Hungarian: 57 (0.09%)
Lebanese: 52 (0.08%)
Northern European: 44 (0.07%)
Swiss: 44 (0.07%)
Syrian: 43 (0.07%)
Iranian: 31 (0.05%)
Haitian: 28 (0.04%)
Zimbabwean: 27 (0.04%)
Latvian: 25 (0.04%)
Nigerian: 24 (0.04%)
Luxembourger: 23 (0.04%)
Czechoslovakian: 20 (0.03%)
Belgian: 19 (0.03%)
Finnish: 17 (0.03%)
Yugoslavian: 15 (0.02%)
Eastern European: 13 (0.02%)
Serbian: 7 (0.01%)
Somali: 7 (0.01%)
Armenian: 6 (0.01%)
Most common places of birth for foreign-born residents (%): Mexico Independence:
34.0% (1,744)Missouri:
14.9% (38,568)
Honduras Independence:
9.5% (488)Missouri:
2.1% (5,346)
Guatemala Independence:
7.4% (381)Missouri:
2.8% (7,146)
El Salvador Independence:
5.2% (264)Missouri:
1.5% (3,926)
Canada Independence:
4.4% (224)Missouri:
1.9% (4,806)
Philippines Independence:
4.2% (215)Missouri:
4.2% (10,873)
India Independence:
4.1% (209)Missouri:
8.9% (22,932)
Germany Independence:
3.6% (182)Missouri:
3.0% (7,803)
Oceania, n.e.c. Independence:
2.8% (142)Missouri:
0.3% (724)
Cuba Independence:
2.7% (139)Missouri:
1.1% (2,867)
Dominican Republic Independence:
2.6% (133)Missouri:
0.3% (832)
Vietnam Independence:
2.3% (116)Missouri:
4.1% (10,700)
Korea Independence:
2.0% (105)Missouri:
2.9% (7,525)
Thailand Independence:
1.7% (86)Missouri:
1.0% (2,597)
Place of birth for U.S.-born residents:
This state: 73,455Other state: 39,098Northeast: 1,689Midwest: 19,823South: 8,281West: 9,305 88.8% of Independence residents lived in the same house 1 years ago.
Out of people who lived in different houses, 41.6% lived in this county.
Out of people who lived in different counties, 49.9% lived in Missouri.
Independence:
88.8%State average:
87.1%
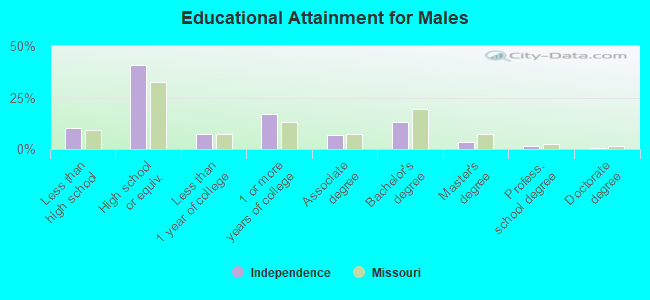
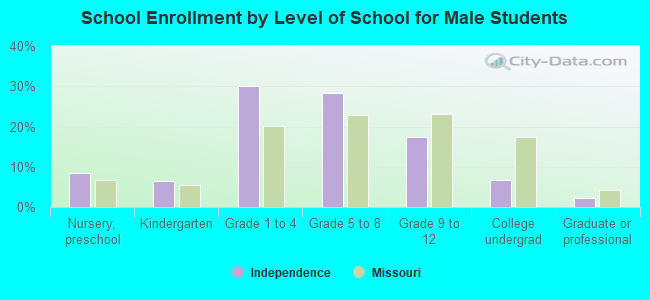
Education attainment for males 25 years and older:
No schooling: 602Nursery to 4th grade: 1155th and 6th grade: 1277th and 8th grade: 5599th grade: 25410th grade: 43911th grade: 88112th grade, no diploma: 1,144High school graduate (or equivalency): 16,502Less than 1 year of college: 2,959Some college more than 1 year, no degree: 6,849Associate degree: 2,801Bachelor's degree: 5,387Master's degree: 1,428Professional school degree: 508Doctorate degree: 107
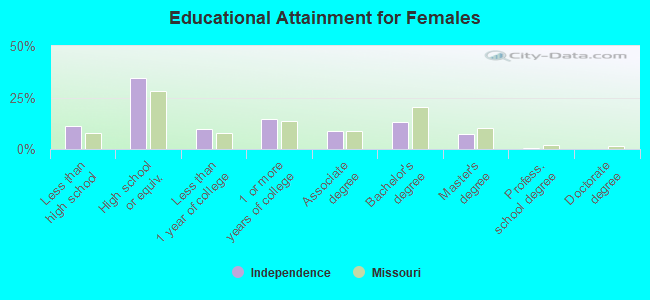
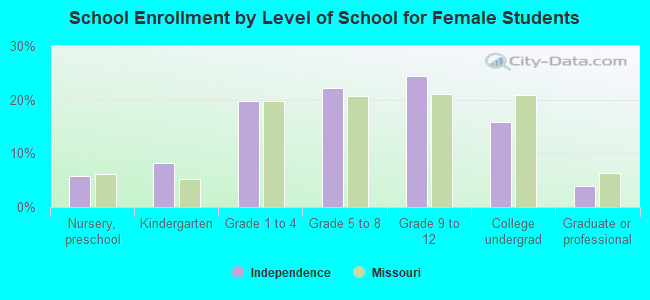
Education attainment for females 25 years and older:
No schooling: 642Nursery to 4th grade: 1665th and 6th grade: 2547th and 8th grade: 8969th grade: 43110th grade: 50411th grade: 1,34312th grade, no diploma: 657High school graduate (or equivalency): 14,761Less than 1 year of college: 4,181Some college more than 1 year, no degree: 6,262Associate degree: 3,664Bachelor's degree: 5,657Master's degree: 3,116Professional school degree: 279Doctorate degree: 103
Housing units in structures:
One, detached: 40,881One, attached: 1,696Two: 2,0143 or 4: 1,9805 to 9: 2,99410 to 19: 3,05720 to 49: 1,35550 or more: 2,266Mobile homes: 1,098Median worth of mobile homes: $29,300
Housing units lacking complete plumbing facilities in 2022: 0.1%Housing units lacking complete kitchen facilities in 2022: 0.2%House/condo owner moved in on average 11 years ago
Renter moved in on average 3 years ago
Private vs. public school enrollment:
Students in private schools in grades 1 to 8 (elementary and middle school): 1,766 Students in private schools in grades 9 to 12 (high school): 473 Students in private undergraduate colleges: 359