Indian Head, MD (Maryland) Houses and Residents
| Indian Head: | $272,595 |
| Maryland: | $398,100 |
Mean price in 2022:
Detached houses: $346,597
Here: $346,597 State: $526,819 Townhouses or other attached units: $275,283
Here: $275,283 State: $328,305
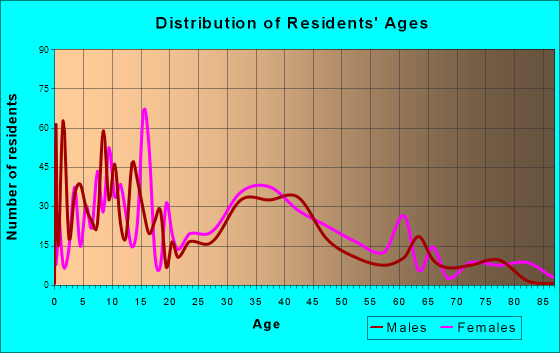
Total population: 3,873 (Urban population: 3,408, Rural population: 0)
Houses: 1,568 (1,532 occupied: 1,083 owner occupied, 504 renter occupied)
| % of renters here: | 32% |
| State: | 32% |
Housing density: 1,280 houses/condos per square mile
Median price asked for vacant for-sale houses and condos in 2022: $803,082.
Median contract rent in 2022: $908
Median rent asked for vacant for-rent units in 2022: $629
Median gross rent in Indian Head, MD in 2022: $1,075
Housing units in Indian Head with a mortgage: 965 (54 second mortgage, 0 home equity loan, 48 both second mortgage and home equity loan)
Houses without a mortgage: 19
Median household income for houses/condos with a mortgage: $86,060
Median household income for apartments without a mortgage: $134,947
Median monthly housing costs: $1,384
Compare current foreclosures near Indian Head, MD:
| Photo | Address | Area | Beds / Baths | Price | Details |
|---|---|---|---|---|---|

|
#1
Greenwood Pl
Indian Head, MD 20640
|
912 sq. feet
|
1 baths 2 beds |
$104,900
|
show details |

|
#2
Oakside Ln
Indian Head, MD 20640
|
1,102 sq. feet
|
1 baths 3 beds |
show details | |

|
#3
Prospect Ave
Indian Head, MD 20640
|
1,040 sq. feet
|
1 baths - beds |
show details | |

|
#4
Ford Dr
Indian Head, MD 20640
|
1,605 sq. feet
|
1 baths - beds |
show details | |

|
#5
First St
Indian Head, MD 20640
|
1,494 sq. feet
|
1 baths - beds |
show details | |

|
#6
Prospect Ave
Indian Head, MD 20640
|
1,912 sq. feet
|
1 baths - beds |
show details | |

|
#7
Glymont Rd
Indian Head, MD 20640
|
1,636 sq. feet
|
1 baths - beds |
show details | |

|
#8
Smallwood Church Rd
Indian Head, MD 20640
|
1,456 sq. feet
|
2 baths - beds |
show details | |

|
#9
Strauss Ave
Indian Head, MD 20640
|
1,302 sq. feet
|
1 baths - beds |
show details | |

|
#10
Dove Tree Ct
Indian Head, MD 20640
|
1,597 sq. feet
|
1 baths - beds |
show details |
| Photo | Address | Area | Beds / Baths | Price | Details |
|---|---|---|---|---|---|

|
#11
Beth Ct
Indian Head, MD 20640
|
1,572 sq. feet
|
2 baths - beds |
show details | |

|
#12
Park Square Dr
Indian Head, MD 20640
|
1,360 sq. feet
|
2 baths - beds |
show details | |

|
#13
Woodland Dr
Indian Head, MD 20640
|
1,918 sq. feet
|
2 baths - beds |
show details | |

|
#14
Leslie Dr
Indian Head, MD 20640
|
- sq. feet
|
- baths - beds |
show details | |

|
#15
Riverside Run Dr
Indian Head, MD 20640
|
- sq. feet
|
- baths - beds |
show details | |

|
#16
Araby Pl
Indian Head, MD 20640
|
- sq. feet
|
- baths - beds |
show details | |

|
#17
Leroy Pl
Indian Head, MD 20640
|
- sq. feet
|
- baths - beds |
show details | |

|
#18
Kenwood Pl
Indian Head, MD 20640
|
- sq. feet
|
- baths - beds |
show details | |

|
#19
Smallwood Church Rd
Indian Head, MD 20640
|
- sq. feet
|
- baths - beds |
show details | |

|
#20
Boyette Ln
Stafford, VA 22554
|
912 sq. feet
|
1 baths 3 beds |
$270,000
|
show details |
| Photo | Address | Area | Beds / Baths | Price | Details |
|---|---|---|---|---|---|

|
#21
Wills Rd
Bel Alton, MD 20611
|
1,444 sq. feet
|
2 baths 3 beds |
$275,000
|
show details |

|
#22
Bannister Cir
Waldorf, MD 20602
|
1,196 sq. feet
|
3 baths 4 beds |
$449,900
|
show details |

|
#23
Old Fort Rd
Fort Washington, MD 20744
|
721 sq. feet
|
1 baths 2 beds |
$179,900
|
show details |

|
#24
Alton Ct
Indian Head, MD 20640
|
- sq. feet
|
- baths - beds |
show details | |

|
#25
Nassau Dr
Woodbridge, VA 22193
|
2,300 sq. feet
|
3 baths 5 beds |
show details | |

|
#26
S Faulkner Rd
Faulkner, MD 20632
|
1,512 sq. feet
|
2 baths 3 beds |
show details | |

|
#27
Poplarwood Ct
Waldorf, MD 20601
|
1,080 sq. feet
|
2 baths 3 beds |
show details | |

|
#28
Gunsmith Ter
Woodbridge, VA 22191
|
969 sq. feet
|
3 baths 2 beds |
show details | |

|
#29
Rolling Spring Ct
Springfield, VA 22152
|
3,365 sq. feet
|
4 baths 4 beds |
show details | |

|
#30
Carolyn Forest Dr
Woodbridge, VA 22192
|
1,593 sq. feet
|
2 baths 2 beds |
show details |
| Photo | Address | Area | Beds / Baths | Price | Details |
|---|---|---|---|---|---|

|
#31
Oriley Ct
Manassas, VA 20112
|
1,728 sq. feet
|
2 baths 3 beds |
show details | |

|
#32
Brazilnut Ct
Woodbridge, VA 22193
|
2,146 sq. feet
|
3 baths 3 beds |
show details | |

|
#33
Summerwood Ln
Accokeek, MD 20607
|
3,774 sq. feet
|
5 baths 4 beds |
show details | |

|
#34
Commonwealth Blvd
Fairfax, VA 22032
|
2,103 sq. feet
|
2 baths 4 beds |
show details | |

|
#35
Chadsey Ln
Brandywine, MD 20613
|
2,480 sq. feet
|
3 baths 4 beds |
show details | |

|
#36
Mckee Way
Manassas, VA 20111
|
2,510 sq. feet
|
3 baths 4 beds |
show details | |

|
#37
Lakewood Dr
Woodbridge, VA 22192
|
2,038 sq. feet
|
2 baths 4 beds |
show details | |

|
#38
Patuxent Ct
La Plata, MD 20646
|
1,104 sq. feet
|
1 baths 2 beds |
show details | |

|
#39
Dubois Ct
Woodbridge, VA 22193
|
1,356 sq. feet
|
2 baths 4 beds |
show details | |

|
#40
Herring Creek Dr
Accokeek, MD 20607
|
2,636 sq. feet
|
3 baths 4 beds |
show details |
| Photo | Address | Area | Beds / Baths | Price | Details |
|---|---|---|---|---|---|

|
#41
Ryon Ct
Waldorf, MD 20601
|
1,244 sq. feet
|
3 baths 3 beds |
show details | |

|
#42
Southgate Ct
Woodbridge, VA 22193
|
1,826 sq. feet
|
2 baths 4 beds |
show details | |

|
#43
Scottsdale Pl
Waldorf, MD 20602
|
2,068 sq. feet
|
3 baths 3 beds |
show details | |

|
#44
Kingswell Dr
Woodbridge, VA 22193
|
1,256 sq. feet
|
2 baths 4 beds |
show details | |

|
#45
Windbreak Dr
Alexandria, VA 22306
|
1,360 sq. feet
|
3 baths 3 beds |
show details | |

|
#46
Culpeper Dr
Woodbridge, VA 22191
|
1,224 sq. feet
|
3 baths 4 beds |
show details | |

|
#47
Catenary Dr
Woodbridge, VA 22191
|
2,012 sq. feet
|
3 baths 4 beds |
show details | |

|
#48
Scotch Heather Pl
Woodbridge, VA 22192
|
2,716 sq. feet
|
2 baths 3 beds |
show details | |

|
#49
Lapene Ct
Woodbridge, VA 22192
|
2,896 sq. feet
|
2 baths 4 beds |
show details | |

|
Check over 1 million property listings on Foreclosure.com!
|
browse all offers | |||


Median year apartment built: 1966
Household type by relationship:
Households: 4,003- Male householders: 622 (207 living alone), Female householders: 904 (320 living alone)
477 spouses (448 opposite-sex spouses), 176 unmarried partners, (176 opposite-sex unmarried partners), 1,357 children (1,267 natural, 5 adopted, 84 stepchildren), 129 grandchildren, 69 brothers or sisters, 91 parents, 0 foster children, 73 other relatives, 101 non-relatives
Size of family households: 230 2-persons, 256 3-persons, 136 4-persons, 56 5-persons, 55 6-persons, 103 7-or-more-persons.
Size of nonfamily households: 619 1-person, 207 2-persons.
556 married couples with children.
364 single-parent households (89 men, 275 women).
91.5% of residents of Indian Head speak English at home.
1.5% of residents speak Spanish at home (86% speak English very well, 14% speak English well).
3.6% of residents speak other Indo-European language at home (84% speak English very well, 7% speak English well, 9% speak English not well).
1.2% of residents speak Asian or Pacific Island language at home (36% speak English very well, 64% speak English well).
0.8% of residents speak other language at home (100% speak English very well).
Foreign born population: 230 (5.7%)
(60.0% of them are naturalized citizens)
| Here: | 6.8 |
| State: | 7.3 |
| Here: | 5.6 |
| State: | 4.2 |

- Bedrooms in owner-occupied houses and condos in Indian Head, Maryland
- 0no bedroom
- 01 bedroom
- 1192 bedrooms
- 4953 bedrooms
- 2754 bedrooms
- 1955+ bedrooms

- Bedrooms in renter-occupied apartments in Indian Head, Maryland
- 0no bedroom
- 01 bedroom
- 1152 bedrooms
- 3463 bedrooms
- 424 bedrooms
- 05+ bedrooms

- Cars and other vehicles available in Indian Head in owner-occupied houses/condos
- 58no vehicle
- 2741 vehicle
- 4712 vehicles
- 2323 vehicles
- 04 vehicles
- 485+ vehicles

- Cars and other vehicles available in Indian Head in renter-occupied apartments
- 0no vehicle
- 3551 vehicle
- 602 vehicles
- 843 vehicles
- 54 vehicles
- 05+ vehicles

- Rooms in owner-occupied houses in Indian Head, Maryland
- 01 room
- 02 rooms
- 223 rooms
- 1024 rooms
- 1655 rooms
- 1566 rooms
- 2507 rooms
- 2008 rooms
- 1899+ rooms

- Rooms in renter-occupied apartments in Indian Head, Maryland
- 01 room
- 02 rooms
- 233 rooms
- 644 rooms
- 955 rooms
- 2156 rooms
- 507 rooms
- 478 rooms
- 119+ rooms


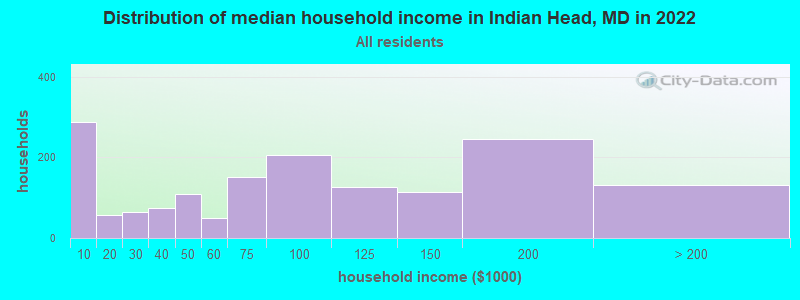
Indian Head, MD household income distribution

- 288Less than $10,000
- 56$10,000 to $19,999
- 65$20,000 to $29,999
- 74$30,000 to $39,999
- 110$40,000 to $49,999
- 49$50,000 to $59,999
- 152$60,000 to $74,999
- 206$75,000 to $99,999
- 126$100,000 to $124,999
- 115$125,000 to $149,999
- 245$150,000 to $199,999
- 132$200,000 or more
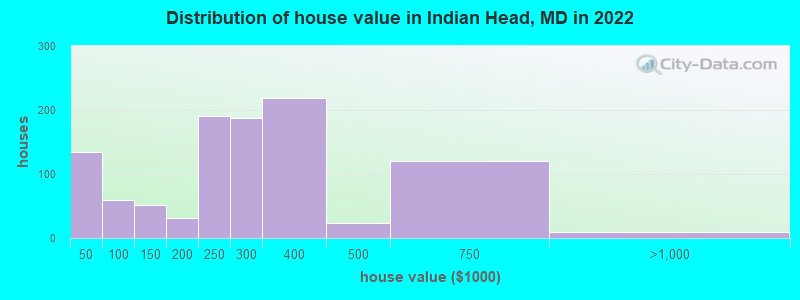
Home value of owner - occupied houses in 2022 in Indian Head, MD
-
- 59Less than $10,000
- 31$10,000 to $14,999
- 29$15,000 to $19,999
- 14$20,000 to $24,999
- 7$50,000 to $59,999
- 50$60,000 to $69,999
- 43$100,000 to $124,999
- 8$125,000 to $149,999
- 17$150,000 to $174,999
- 13$175,000 to $199,999
- 190$200,000 to $249,999
- 187$250,000 to $299,999
- 219$300,000 to $399,999
- 22$400,000 to $499,999
- 119$500,000 to $749,999
- 9$750,000 to $999,999
Rent paid by renters in 2022 in Indian Head, MD
-
- 7$250 to $299
- 142$300 to $349
- 39$550 to $599
- 27$800 to $899
- 54$900 to $999
- 35$1,000 to $1,249
- 35$1,250 to $1,499
- 121$1,500 to $1,999
- 17No cash rent


Percentage of workers working in this county: 52.0%
Number of people working at home: 334 (15.7% of all workers)
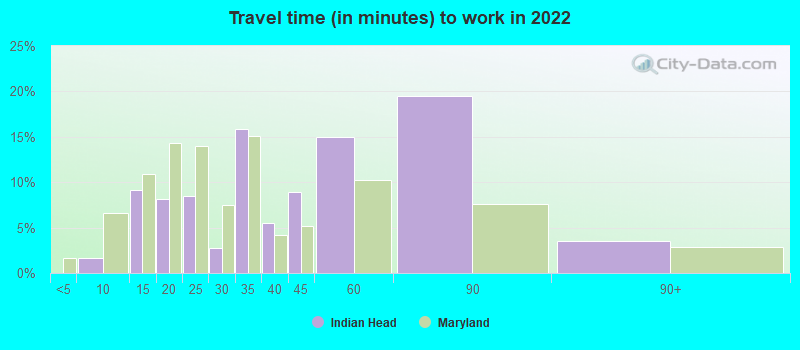
Travel time to work (commute)
- Less than 5 minutes: 0
- 5 to 9 minutes: 28
- 10 to 14 minutes: 57
- 15 to 19 minutes: 29
- 20 to 24 minutes: 192
- 25 to 29 minutes: 152
- 30 to 34 minutes: 117
- 35 to 39 minutes: 171
- 40 to 44 minutes: 211
- 45 to 59 minutes: 330
- 60 to 89 minutes: 509
- 90 or more minutes: 105
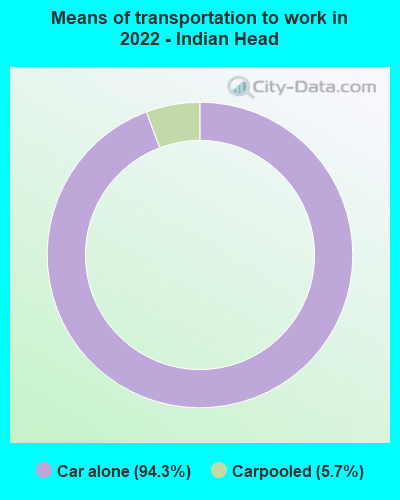
Means of transportation to work:
- Drove a car alone: 757 (68.5%)
- Carpooled: 48 (4.3%)
- Worked at home: 330 (29.9%)

- Unemployment by race in 2022
- Unemployment rate for Black residents
- 5.4%Males
- 0.9%Females
- Unemployment rate for Asian residents
- 17.0%Females

- Year of entry for the foreign-born population in Indian Head, Maryland
- 812010 or later
- 452000 to 2009
- 341990 to 1999
- 81980 to 1989
- 51970 to 1979
- 15Before 1970

First ancestries reported:
- English: 165 (8.3%)
- Irish: 68 (3.4%)
- American: 35 (1.8%)
- Nigerian: 25 (1.3%)
- German: 8 (0.4%)
- Lithuanian: 7 (0.4%)
- European: 6 (0.3%)
- African: 4 (0.2%)
- Dutch: 3 (0.2%)
Most common places of birth for foreign-born residents (%):
| Indian Head: | 15.1% (33) |
| Maryland: | 6.4% (61,725) |
| Indian Head: | 11.9% (26) |
| Maryland: | 0.2% (1,463) |
| Indian Head: | 11.9% (26) |
| Maryland: | 1.9% (18,716) |
| Indian Head: | 10.1% (22) |
| Maryland: | 4.6% (44,825) |
| Indian Head: | 9.2% (20) |
| Maryland: | 0.2% (1,625) |
| Indian Head: | 7.8% (17) |
| Maryland: | 3.8% (36,698) |
| Indian Head: | 7.3% (16) |
| Maryland: | 1.8% (17,037) |
| Indian Head: | 4.1% (9) |
| Maryland: | 1.1% (10,205) |
| Indian Head: | 3.2% (7) |
| Maryland: | 0.0% (228) |
Place of birth for U.S.-born residents:
- This state: 2,112
- Other state: 1,622
- Northeast: 236
- Midwest: 100
- South: 1,198
- West: 85
75.5% of Indian Head residents lived in the same house 1 years ago.
Out of people who lived in different houses, 29.6% lived in this county.
Out of people who lived in different counties, 98.9% lived in Maryland.
| Indian Head: | 75.5% |
| State average: | 88.5% |
Education attainment for males 25 years and older:
- No schooling: 0
- Nursery to 4th grade: 12
- 5th and 6th grade: 0
- 7th and 8th grade: 0
- 9th grade: 5
- 10th grade: 10
- 11th grade: 12
- 12th grade, no diploma: 12
- High school graduate (or equivalency): 692
- Less than 1 year of college: 38
- Some college more than 1 year, no degree: 135
- Associate degree: 63
- Bachelor's degree: 46
- Master's degree: 52
- Professional school degree: 0
- Doctorate degree: 24

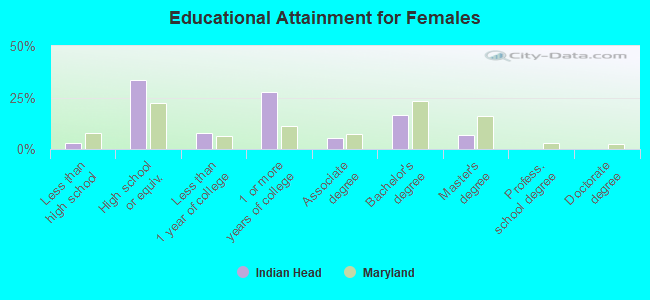
Education attainment for females 25 years and older:
- No schooling: 0
- Nursery to 4th grade: 0
- 5th and 6th grade: 0
- 7th and 8th grade: 3
- 9th grade: 6
- 10th grade: 11
- 11th grade: 9
- 12th grade, no diploma: 11
- High school graduate (or equivalency): 492
- Less than 1 year of college: 115
- Some college more than 1 year, no degree: 406
- Associate degree: 76
- Bachelor's degree: 245
- Master's degree: 102
- Professional school degree: 0
- Doctorate degree: 0
Housing units in structures:
- One, detached: 851
- One, attached: 665
- 10 to 19: 46
- 20 to 49: 5
House/condo owner moved in on average 9 years ago
Renter moved in on average 6 years ago

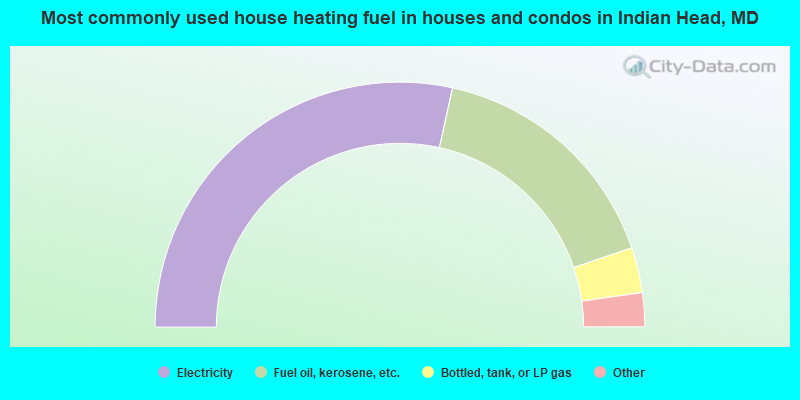
- 57.0%Electricity
- 32.7%Fuel oil, kerosene, etc.
- 6.0%Bottled, tank, or LP gas
- 3.2%Utility gas
- 1.1%No fuel used
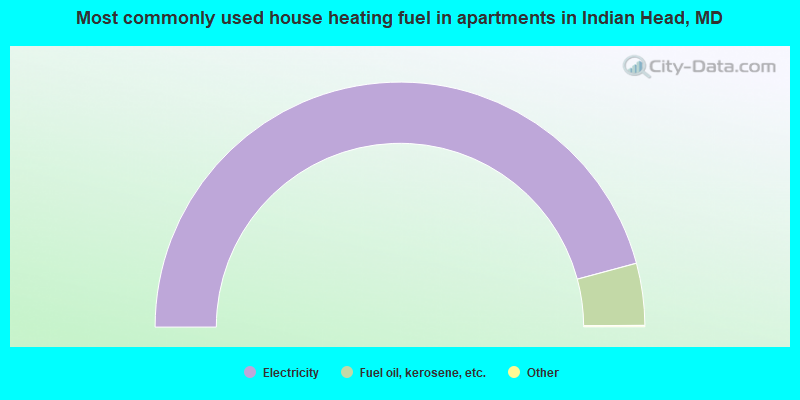
- 91.8%Electricity
- 8.2%Fuel oil, kerosene, etc.
Private vs. public school enrollment:
| Here: | 22.9% |
| Maryland: | 15.2% |
| Here: | 0.0% |
| Maryland: | 14.4% |
| Here: | 0.0% |
| Maryland: | 20.2% |


