Indian Lake, PA (Pennsylvania) Houses and Residents
| Indian Lake: | $383,173 |
| Pennsylvania: | $245,500 |
Mean price in 2022:
Detached houses: $533,554
Here: $533,554 State: $317,202 Townhouses or other attached units: $302,559
Here: $302,559 State: $254,369
Total population: 392 (Urban population: 0, Rural population: 453 (all nonfarm))
Houses: 592 (165 occupied: 150 owner occupied, 17 renter occupied)
| % of renters here: | 10% |
| State: | 31% |
Housing density: 160 houses/condos per square mile
Median price asked for vacant for-sale houses and condos in 2022: $1,245,783.
Median gross rent in Indian Lake, PA in 2022: $-654,356,059
Housing units in Indian Lake with a mortgage: 71 (17 second mortgage, 0 home equity loan, 17 both second mortgage and home equity loan)
Houses without a mortgage: 8
Median household income for houses/condos with a mortgage: $133,213
Median household income for apartments without a mortgage: $93,998
Median monthly housing costs: $1,431
Compare current foreclosures near Indian Lake, PA:
| Photo | Address | Area | Beds / Baths | Price | Details |
|---|---|---|---|---|---|

|
#1
Blacks Hill Rd
Boswell, PA 15531
|
1,168 sq. feet
|
1 baths 2 beds |
$120,750
|
show details |

|
#2
Bunker Hill Rd
Central City, PA 15926
|
1,769 sq. feet
|
1 baths 3 beds |
$17,900
|
show details |

|
#3
Fernwood Pl
Johnstown, PA 15905
|
1,248 sq. feet
|
1 baths 3 beds |
show details | |

|
#4
Village Rd
Friedens, PA 15541
|
1,246 sq. feet
|
1 baths 3 beds |
show details | |

|
#5
8th St
Windber, PA 15963
|
1,644 sq. feet
|
1 baths 3 beds |
show details | |

|
#6
Lincoln Hwy
Schellsburg, PA 15559
|
1,244 sq. feet
|
1 baths 2 beds |
show details | |

|
#7
Big Rock Rd
Berlin, PA 15530
|
1,300 sq. feet
|
1 baths 3 beds |
show details | |

|
#8
Ridge Rd
Somerset, PA 15501
|
1,092 sq. feet
|
1 baths 3 beds |
show details | |

|
#9
Husband Rd
Somerset, PA 15501
|
928 sq. feet
|
1 baths 2 beds |
show details | |

|
#10
Horner St
Windber, PA 15963
|
1,344 sq. feet
|
1 baths 3 beds |
show details |
| Photo | Address | Area | Beds / Baths | Price | Details |
|---|---|---|---|---|---|

|
#11
Stockholm Ave
Windber, PA 15963
|
1,472 sq. feet
|
1 baths 3 beds |
show details | |

|
#12
W Main St
Somerset, PA 15501
|
1,816 sq. feet
|
2 baths 3 beds |
show details | |

|
#13
N Walnut St
Davidsville, PA 15928
|
1,935 sq. feet
|
2 baths 2 beds |
show details | |

|
#14
Hayes St
Windber, PA 15963
|
1,191 sq. feet
|
1 baths 2 beds |
show details | |

|
#15
6th St
Windber, PA 15963
|
1,230 sq. feet
|
1 baths 2 beds |
show details | |

|
#16
Dannys Ln
Fairhope, PA 15538
|
1,352 sq. feet
|
1 baths 3 beds |
show details | |

|
#17
W Bakersville Edie Rd
Somerset, PA 15501
|
2,101 sq. feet
|
1 baths 2 beds |
show details | |

|
#18
Bunker Hill Rd
Central City, PA 15926
|
1,296 sq. feet
|
2 baths 3 beds |
show details | |

|
#19
E Main St
Somerset, PA 15501
|
2,170 sq. feet
|
1 baths 4 beds |
show details | |

|
#20
Brotherton Rd
Berlin, PA 15530
|
1,725 sq. feet
|
1 baths 2 beds |
show details |
| Photo | Address | Area | Beds / Baths | Price | Details |
|---|---|---|---|---|---|

|
#21
Wilbur Rd
Stoystown, PA 15563
|
1,792 sq. feet
|
1 baths 4 beds |
show details | |

|
#22
Whispering Pines Rd
Cairnbrook, PA 15924
|
1,547 sq. feet
|
1 baths 4 beds |
show details | |

|
#23
Village Rd
Friedens, PA 15541
|
1,246 sq. feet
|
1 baths 3 beds |
show details | |

|
#24
Samuels Rd
Somerset, PA 15501
|
1,272 sq. feet
|
2 baths 3 beds |
show details | |

|
#25
Listie Rd
Friedens, PA 15541
|
1,288 sq. feet
|
- baths 3 beds |
show details | |

|
#26
Somerset Ave
Windber, PA 15963
|
2,060 sq. feet
|
- baths 4 beds |
show details | |

|
#27
Railroad St
Windber, PA 15963
|
- sq. feet
|
- baths - beds |
show details | |

|
#28
Wyndemere Dr
Johnstown, PA 15904
|
- sq. feet
|
- baths - beds |
show details | |

|
#29
Claruth Dr
Windber, PA 15963
|
- sq. feet
|
- baths - beds |
show details | |

|
#30
Country Club Rd
Johnstown, PA 15905
|
- sq. feet
|
- baths - beds |
show details |
| Photo | Address | Area | Beds / Baths | Price | Details |
|---|---|---|---|---|---|

|
#31
Mountain Rd
Alum Bank, PA 15521
|
1,064 sq. feet
|
- baths - beds |
show details | |

|
#32
1st St
Windber, PA 15963
|
- sq. feet
|
- baths - beds |
show details | |

|
#33
Theatre Dr
Johnstown, PA 15904
|
- sq. feet
|
- baths - beds |
show details | |

|
#34
Glenwood Ave
Johnstown, PA 15905
|
- sq. feet
|
- baths - beds |
show details | |

|
#35
Penn Ave
Hollsopple, PA 15935
|
- sq. feet
|
- baths - beds |
show details | |

|
#36
Graham Ave
Windber, PA 15963
|
- sq. feet
|
- baths - beds |
show details | |

|
#37
Water Level Rd
Somerset, PA 15501
|
- sq. feet
|
- baths - beds |
show details | |

|
#38
N Center Ave
Somerset, PA 15501
|
- sq. feet
|
- baths - beds |
show details | |

|
#39
Terrapin Dr
Windber, PA 15963
|
- sq. feet
|
- baths - beds |
show details | |

|
#40
Cortland Dr
New Paris, PA 15554
|
- sq. feet
|
- baths - beds |
show details |
| Photo | Address | Area | Beds / Baths | Price | Details |
|---|---|---|---|---|---|

|
#41
Cortland Dr
New Paris, PA 15554
|
1,296 sq. feet
|
- baths - beds |
show details | |

|
#42
Highland Park Dr
Somerset, PA 15501
|
- sq. feet
|
- baths - beds |
show details | |

|
#43
Lynn St
Central City, PA 15926
|
- sq. feet
|
- baths - beds |
show details | |

|
#44
/312 Stonycreek St
Boswell, PA 15531
|
- sq. feet
|
- baths - beds |
show details | |

|
#45
Martha St
Somerset, PA 15501
|
- sq. feet
|
- baths - beds |
show details | |

|
#46
W Fairfield Street
Somerset, PA 15501
|
- sq. feet
|
- baths - beds |
show details | |

|
#47
Slate Hill Rd
Berlin, PA 15530
|
- sq. feet
|
- baths - beds |
show details | |

|
#48
Water St
Jenners, PA 15546
|
- sq. feet
|
- baths - beds |
show details | |

|
#49
Front St
Jenners, PA 15546
|
- sq. feet
|
- baths - beds |
show details | |

|
Check over 1 million property listings on Foreclosure.com!
|
browse all offers | |||


Household type by relationship:
Households: 309- Male householders: 109 (36 living alone), Female householders: 53 (12 living alone)
103 spouses (103 opposite-sex spouses), 1 unmarried partners, (1 opposite-sex unmarried partners), 24 children (24 natural, 0 adopted, 0 stepchildren), 2 grandchildren, 3 brothers or sisters, 0 parents, 1 foster children, 0 other relatives, 7 non-relatives
Size of family households: 79 2-persons, 27 3-persons, 1 4-persons.
Size of nonfamily households: 54 1-person, 5 2-persons.
15 married couples with children.
0 single-parent households (0 men, 0 women).
98.7% of residents of Indian Lake speak English at home.
1.6% of residents speak other Indo-European language at home (100% speak English very well).
Foreign born population: 2 (0.6%)
(50.0% of them are naturalized citizens)
| Here: | 7.3 |
| State: | 6.8 |
| Here: | -653333332.7 |
| State: | 4.3 |

- Bedrooms in owner-occupied houses and condos in Indian Lake, Pennsylvania
- 0no bedroom
- 01 bedroom
- 232 bedrooms
- 683 bedrooms
- 444 bedrooms
- 155+ bedrooms

- Bedrooms in renter-occupied apartments in Indian Lake, Pennsylvania
- 0no bedroom
- 01 bedroom
- 02 bedrooms
- 173 bedrooms
- 04 bedrooms
- 05+ bedrooms

- Cars and other vehicles available in Indian Lake in owner-occupied houses/condos
- 5no vehicle
- 411 vehicle
- 802 vehicles
- 223 vehicles
- 04 vehicles
- 25+ vehicles

- Cars and other vehicles available in Indian Lake in renter-occupied apartments
- 0no vehicle
- 01 vehicle
- 32 vehicles
- 123 vehicles
- 24 vehicles
- 05+ vehicles

- Rooms in owner-occupied houses in Indian Lake, Pennsylvania
- 01 room
- 02 rooms
- 03 rooms
- 204 rooms
- 175 rooms
- 246 rooms
- 177 rooms
- 238 rooms
- 489+ rooms

- Rooms in renter-occupied apartments in Indian Lake, Pennsylvania
- 01 room
- 02 rooms
- 03 rooms
- 04 rooms
- 05 rooms
- 176 rooms
- 07 rooms
- 08 rooms
- 09+ rooms


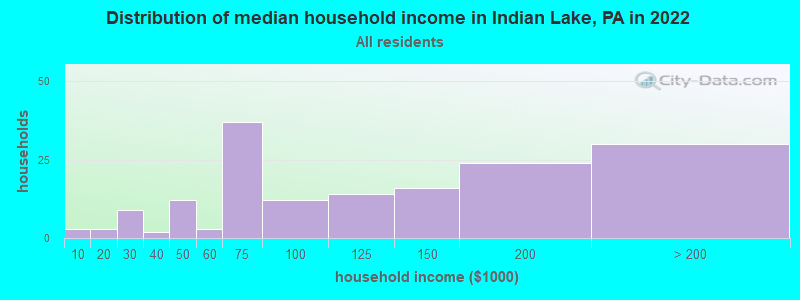
Indian Lake, PA household income distribution

- 3Less than $10,000
- 3$10,000 to $19,999
- 9$20,000 to $29,999
- 2$30,000 to $39,999
- 12$40,000 to $49,999
- 3$50,000 to $59,999
- 37$60,000 to $74,999
- 12$75,000 to $99,999
- 14$100,000 to $124,999
- 16$125,000 to $149,999
- 24$150,000 to $199,999
- 30$200,000 or more
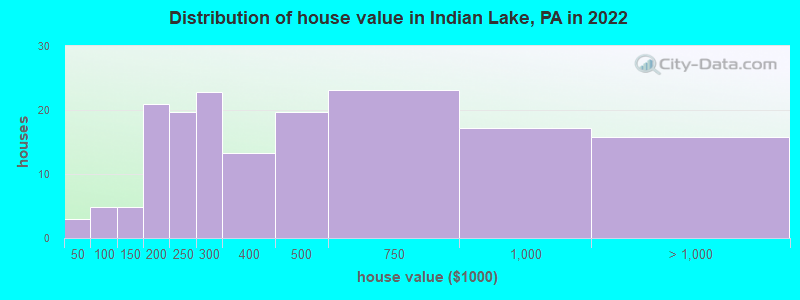
Home value of owner - occupied houses in 2022 in Indian Lake, PA
-
- 2$40,000 to $49,999
- 1$90,000 to $99,999
- 2$100,000 to $124,999
- 2$125,000 to $149,999
- 7$150,000 to $174,999
- 13$175,000 to $199,999
- 19$200,000 to $249,999
- 22$250,000 to $299,999
- 13$300,000 to $399,999
- 19$400,000 to $499,999
- 23$500,000 to $749,999
- 17$750,000 to $999,999
- 15$1,000,000 to $1,499,999
Rent paid by renters in 2022 in Indian Lake, PA
-
- 5$900 to $999
- 16$1,000 to $1,249
- 2No cash rent


Percentage of workers working in this county: 44.0%
Number of people working at home: 35 (19.4% of all workers)
Travel time to work (commute)
- Less than 5 minutes: 3
- 5 to 9 minutes: 5
- 10 to 14 minutes: 5
- 15 to 19 minutes: 14
- 20 to 24 minutes: 4
- 25 to 29 minutes: 4
- 30 to 34 minutes: 24
- 35 to 39 minutes: 27
- 40 to 44 minutes: 0
- 45 to 59 minutes: 19
- 60 to 89 minutes: 20
- 90 or more minutes: 26
Means of transportation to work:
- Drove a car alone: 177 (84.3%)
- Carpooled: 23 (11.0%)
- Walked: 3 (1.4%)
- Worked at home: 7 (3.3%)

- Unemployment by race in 2022
- Unemployment rate for White non-Hispanic residents
- 1.3%Males
- 3.6%Females

- Year of entry for the foreign-born population in Indian Lake, Pennsylvania
- 02010 or later
- 02000 to 2009
- 01990 to 1999
- 21980 to 1989
- 21970 to 1979
- 5Before 1970

First ancestries reported:
- German: 71 (34.9%)
- American: 30 (14.8%)
- Irish: 18 (8.9%)
- Italian: 9 (4.4%)
- Polish: 9 (4.4%)
- English: 8 (3.9%)
- European: 8 (3.9%)
- Scottish: 7 (3.4%)
- Slovak: 6 (3.0%)
- Hungarian: 5 (2.5%)
- Welsh: 5 (2.5%)
- Eastern European: 3 (1.5%)
- Norwegian: 2 (1.0%)
- Slavic: 2 (1.0%)
- Ukrainian: 2 (1.0%)
- Croatian: 1 (0.5%)
- French: 1 (0.5%)
- Pennsylvania German: 1 (0.5%)
- Russian: 1 (0.5%)
- Scotch-Irish: 1 (0.5%)
Most common places of birth for foreign-born residents (%):
| Indian Lake: | 50.0% (2) |
| Pennsylvania: | 1.8% (17,032) |
| Indian Lake: | 25.0% (1) |
| Pennsylvania: | 1.9% (18,065) |
Place of birth for U.S.-born residents:
- This state: 227
- Other state: 69
- Northeast: 11
- Midwest: 25
- South: 31
- West: 3
90.4% of Indian Lake residents lived in the same house 1 years ago.
Out of people who lived in different houses, 37.0% lived in this county.
Out of people who lived in different counties, 38.5% lived in Pennsylvania.
| Indian Lake: | 90.4% |
| State average: | 89.3% |
Education attainment for males 25 years and older:
- No schooling: 0
- Nursery to 4th grade: 0
- 5th and 6th grade: 0
- 7th and 8th grade: 0
- 9th grade: 0
- 10th grade: 0
- 11th grade: 0
- 12th grade, no diploma: 1
- High school graduate (or equivalency): 17
- Less than 1 year of college: 12
- Some college more than 1 year, no degree: 26
- Associate degree: 7
- Bachelor's degree: 44
- Master's degree: 16
- Professional school degree: 6
- Doctorate degree: 3

Education attainment for females 25 years and older:
- No schooling: 0
- Nursery to 4th grade: 0
- 5th and 6th grade: 0
- 7th and 8th grade: 0
- 9th grade: 0
- 10th grade: 0
- 11th grade: 2
- 12th grade, no diploma: 0
- High school graduate (or equivalency): 27
- Less than 1 year of college: 3
- Some college more than 1 year, no degree: 33
- Associate degree: 11
- Bachelor's degree: 34
- Master's degree: 12
- Professional school degree: 2
- Doctorate degree: 0


Housing units in structures:
- One, detached: 551
- One, attached: 21
- 3 or 4: 9
- 5 to 9: 11
House/condo owner moved in on average 17 years ago
Renter moved in on average 5 years ago

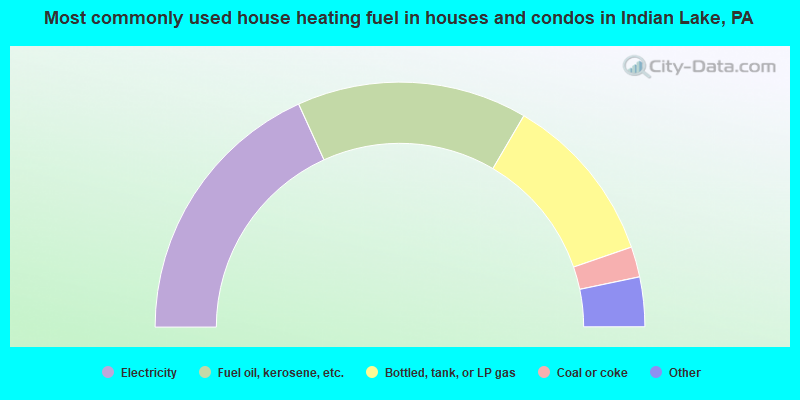
- 37.2%Electricity
- 31.1%Fuel oil, kerosene, etc.
- 23.0%Bottled, tank, or LP gas
- 4.1%Coal or coke
- 3.4%Wood
- 1.4%Other fuel
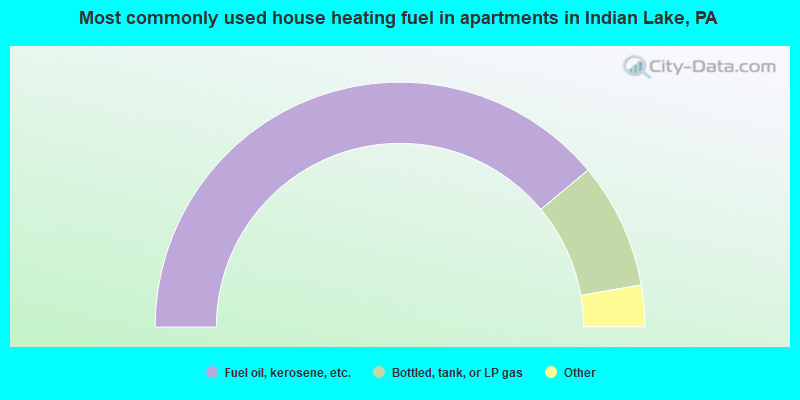
- 82.4%Fuel oil, kerosene, etc.
- 17.6%Bottled, tank, or LP gas
Private vs. public school enrollment:
| Here: | 0.0% |
| Pennsylvania: | 15.7% |
| Here: | 50.0% |
| Pennsylvania: | 13.4% |
| Here: | 0.0% |
| Pennsylvania: | 39.8% |


