Indian, SC (South Carolina) Houses and Residents
| Indian: | $100,667 |
| South Carolina: | $254,600 |
Total population: 1,834 (Urban population: 0, Rural population: 1,869 (20 farm, 1,849 nonfarm))
Houses: 851 (684 occupied: 554 owner occupied, 130 renter occupied)
| % of renters here: | 19% |
| State: | 28% |
Housing density: 13 houses/condos per square mile
Median price asked for vacant for-sale houses and condos in 2022 in this county: $127,601.
Median contract rent in 2022: $596 (lower quartile is $422, upper quartile is $595)
Median rent asked for vacant for-rent units in 2022: $508
Median gross rent in Indian, SC in 2022: $833
Housing units in Indian with a mortgage: 101 (6 second mortgage, 0 home equity loan, 0 both second mortgage and home equity loan)
Houses without a mortgage: 141


Household type by relationship:
Households: 32,947- In family households: 28,323 (4,804 male householders, 4,050 female householders)
5,197 spouses, 9,998 children (9,266 natural, 326 adopted, 406 stepchildren), 2,057 grandchildren, 497 brothers or sisters, 264 parents, foster children, 720 other relatives, 605 non-relatives
- In nonfamily households: 4,624 (1,892 male householders (1,692 living alone)), 2,261 female householders (2,075 living alone)), 471 nonrelatives
- In group quarters: 1,476 (1,411 institutionalized population)
5,127 married couples with children.
3,479 single-parent households (437 men, 3,042 women).
97.1% of residents of Indian speak English at home.
1.7% of residents speak Spanish at home (48% speak English very well, 32% speak English well, 19% speak English not well).
1.1% of residents speak other Indo-European language at home (55% speak English very well, 20% speak English well, 25% speak English not well).
Foreign born population: 10 (0.5%)
(130.0% of them are naturalized citizens)
| Here: | 6.2 |
| State: | 6.4 |
| Here: | 6.1 |
| State: | 4.5 |

- Bedrooms in owner-occupied houses and condos in Indian, South Carolina
- 0no bedroom
- 61 bedroom
- 882 bedrooms
- 3393 bedrooms
- 1084 bedrooms
- 135+ bedrooms

- Bedrooms in renter-occupied apartments in Indian, South Carolina
- 0no bedroom
- 01 bedroom
- 262 bedrooms
- 873 bedrooms
- 174 bedrooms
- 05+ bedrooms

- Cars and other vehicles available in Indian in owner-occupied houses/condos
- 24no vehicle
- 1661 vehicle
- 1942 vehicles
- 1053 vehicles
- 254 vehicles
- 405+ vehicles

- Cars and other vehicles available in Indian in renter-occupied apartments
- 35no vehicle
- 551 vehicle
- 172 vehicles
- 233 vehicles
- 04 vehicles
- 05+ vehicles

- Rooms in owner-occupied houses in Indian, South Carolina
- 01 room
- 02 rooms
- 353 rooms
- 254 rooms
- 1735 rooms
- 1356 rooms
- 977 rooms
- 518 rooms
- 389+ rooms

- Rooms in renter-occupied apartments in Indian, South Carolina
- 01 room
- 02 rooms
- 03 rooms
- 254 rooms
- 455 rooms
- 236 rooms
- 377 rooms
- 08 rooms
- 09+ rooms


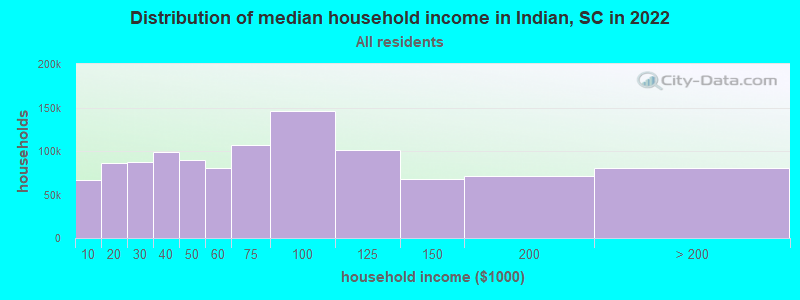
Indian, SC household income distribution

- 46,127Less than $10,000
- 70,562$10,000 to $19,999
- 61,725$20,000 to $29,999
- 68,536$30,000 to $39,999
- 63,263$40,000 to $49,999
- 49,411$50,000 to $59,999
- 65,886$60,000 to $74,999
- 87,326$75,000 to $99,999
- 61,620$100,000 to $124,999
- 38,603$125,000 to $149,999
- 38,401$150,000 to $199,999
- 37,860$200,000 or more
Percentage of workers working in this county: 48.9%
Number of people working at home: 56 (7.3% of all workers)
Travel time to work (commute)
- Less than 5 minutes: 16
- 5 to 9 minutes: 69
- 10 to 14 minutes: 88
- 15 to 19 minutes: 143
- 20 to 24 minutes: 125
- 25 to 29 minutes: 51
- 30 to 34 minutes: 97
- 35 to 39 minutes: 22
- 40 to 44 minutes: 10
- 45 to 59 minutes: 69
- 60 to 89 minutes: 30
- 90 or more minutes: 33
Means of transportation to work:
- Drove a car alone: 530 (70.4%)
- Carpooled: 199 (26.4%)
- Bus or trolley bus: 18 (2.4%)
- Other means: 6 (0.8%)


- Year of entry for the foreign-born population in Indian, South Carolina
- 01995 to March 2000
- 01990 to 1994
- 01985 to 1989
- 01980 to 1984
- 51975 to 1979
- 01970 to 1974
- 01965 to 1969
- 0Before 1965
Most common places of birth for foreign-born residents (%):
| Indian: | 100.0% (5) |
| South Carolina: | 0.8% (947) |
Place of birth for U.S.-born residents:
- This state: 1,736
- Other state: 113
- Northeast: 60
- Midwest: 0
- South: 47
- West: 6
78% of Indian residents lived in the same house 5 years ago.
Out of people who lived in different houses, 58% lived in this county.
Out of people who lived in different counties, 75% lived in South Carolina.
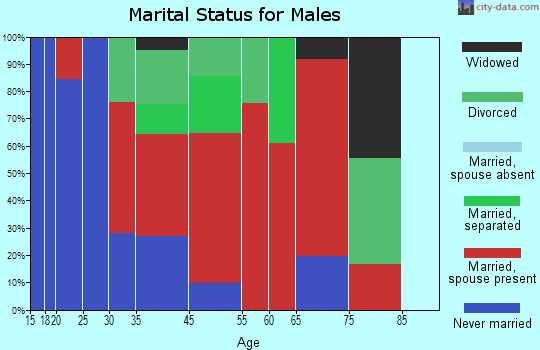
Education attainment for males 25 years and older:
- No schooling: 9
- Nursery to 4th grade: 5
- 5th and 6th grade: 18
- 7th and 8th grade: 23
- 9th grade: 0
- 10th grade: 23
- 11th grade: 29
- 12th grade, no diploma: 56
- High school graduate (or equivalency): 164
- Less than 1 year of college: 41
- Some college more than 1 year, no degree: 40
- Associate degree: 10
- Bachelor's degree: 78
- Master's degree: 0
- Professional school degree: 0
- Doctorate degree: 5

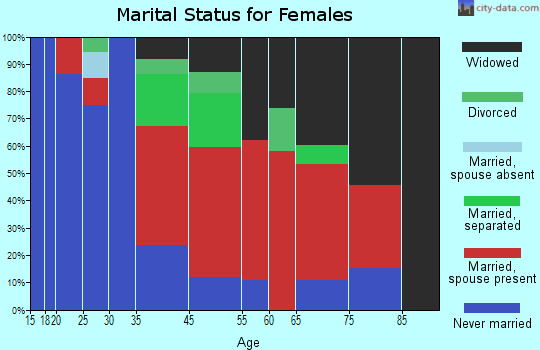
Education attainment for females 25 years and older:
- No schooling: 28
- Nursery to 4th grade: 0
- 5th and 6th grade: 6
- 7th and 8th grade: 5
- 9th grade: 30
- 10th grade: 21
- 11th grade: 44
- 12th grade, no diploma: 29
- High school graduate (or equivalency): 252
- Less than 1 year of college: 28
- Some college more than 1 year, no degree: 28
- Associate degree: 40
- Bachelor's degree: 80
- Master's degree: 58
- Professional school degree: 5
- Doctorate degree: 0

Housing units in structures:
- One, detached: 399
- One, attached: 7
- 3 or 4: 25
- 20 to 49: 5
- Mobile homes: 415
Median worth of mobile homes: $51,858
Housing units lacking complete kitchen facilities: 6.5%

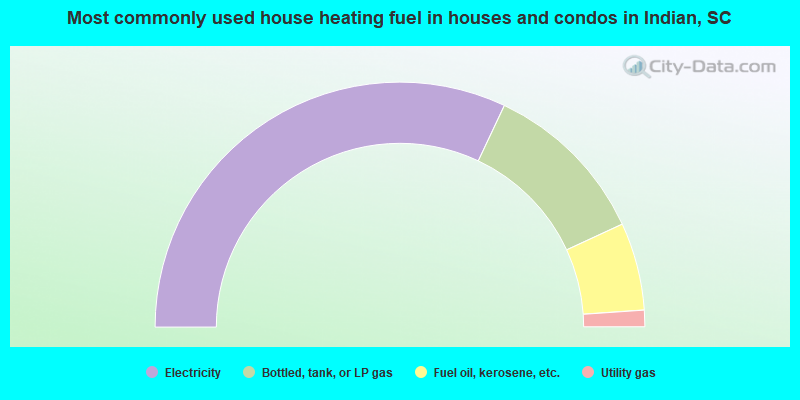
- 64.1%Electricity
- 22.2%Bottled, tank, or LP gas
- 11.6%Fuel oil, kerosene, etc.
- 2.2%Utility gas
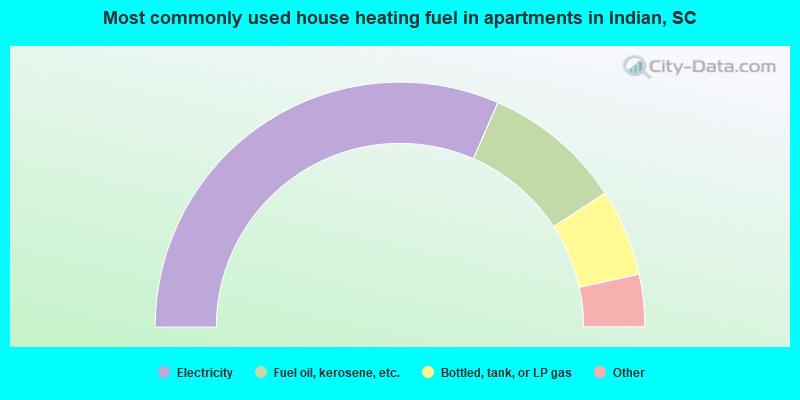
- 63.1%Electricity
- 18.5%Fuel oil, kerosene, etc.
- 11.5%Bottled, tank, or LP gas
- 3.8%Utility gas
- 3.1%Wood
Private vs. public school enrollment:
| Here: | 0.0% |
| South Carolina: | 9.2% |
| Here: | 0.0% |
| South Carolina: | 8.1% |
| Here: | 18.0% |
| South Carolina: | 20.3% |


