Ipswich, MA (Massachusetts) Houses and Residents
| Ipswich: | $610,095 |
| Massachusetts: | $534,700 |
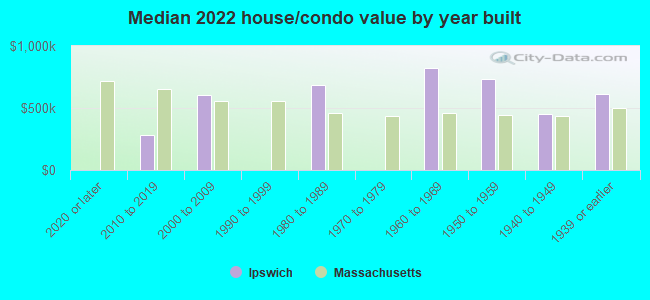
Mean price in 2022:
Detached houses: $731,433
Here: $731,433 State: $651,570 Townhouses or other attached units: $447,867
Here: $447,867 State: $617,749 In 2-unit structures: $479,624
Here: $479,624 State: $594,808 In 3-to-4-unit structures: $411,716
Here: $411,716 State: $601,912 In 5-or-more-unit structures: $684,314
Here: $684,314 State: $555,768
Total population: 4,222 (Urban population: 3,982, Rural population: 0)
Houses: 2,125 (2,125 occupied: 1,196 owner occupied, 935 renter occupied)
| % of renters here: | 44% |
| State: | 38% |
Housing density: 1,281 houses/condos per square mile
Median price asked for vacant for-sale houses and condos in 2022 in this county: $495,592.
Median contract rent in 2022: $1,392 (lower quartile is $1,027, upper quartile is $1,516)
Median rent asked for vacant for-rent units in 2022: $1,514
Median gross rent in Ipswich, MA in 2022: $1,465
Housing units in Ipswich with a mortgage: 914 (125 second mortgage, 0 home equity loan, 127 both second mortgage and home equity loan)
Houses without a mortgage: 44
Median household income for houses/condos with a mortgage: $144,254
Median household income for apartments without a mortgage: $91,984
Median monthly housing costs: $1,722
Compare current foreclosures near Ipswich, MA:
| Photo | Address | Area | Beds / Baths | Price | Details |
|---|---|---|---|---|---|

|
#1
Mile Ln
Ipswich, MA 01938
|
2,240 sq. feet
|
2 baths 3 beds |
show details | |

|
#2
Essex Rd Unit 10
Ipswich, MA 01938
|
1,992 sq. feet
|
2 baths 3 beds |
show details | |

|
#3
Linebrook Rd
Ipswich, MA 01938
|
901 sq. feet
|
1 baths 1 beds |
show details | |

|
#4
Congress St
Ipswich, MA 01938
|
2,388 sq. feet
|
2 baths 3 beds |
show details | |

|
#5
Bunker Hill Rd
Ipswich, MA 01938
|
2,896 sq. feet
|
2 baths 3 beds |
show details | |

|
#6
Rosewood Dr
Ipswich, MA 01938
|
- sq. feet
|
- baths - beds |
show details | |

|
#7
Colonial Dr Apt 115
Ipswich, MA 01938
|
- sq. feet
|
- baths - beds |
show details | |

|
#8
Agawam Vlg Apt B
Ipswich, MA 01938
|
- sq. feet
|
- baths - beds |
show details | |

|
#9
County Rd, Unit 37
Ipswich, MA 01938
|
- sq. feet
|
- baths - beds |
show details | |

|
#10
County Rd
Ipswich, MA 01938
|
- sq. feet
|
- baths - beds |
show details |
| Photo | Address | Area | Beds / Baths | Price | Details |
|---|---|---|---|---|---|

|
#11
Cedar St # A
Haverhill, MA 01830
|
1,134 sq. feet
|
2 baths 2 beds |
$209,300
|
show details |

|
#12
Whale Cove Rd
Rockport, MA 01966
|
- sq. feet
|
3 baths 3 beds |
$1,496,250
|
show details |

|
#13
Portland St
Lynn, MA 01902
|
851 sq. feet
|
2 baths 2 beds |
show details | |

|
#14
Oak Ridge Rd
Plaistow, NH 03865
|
3,089 sq. feet
|
3 baths 5 beds |
show details | |

|
#15
Margin Street
Lynn, MA 01905
|
1,240 sq. feet
|
2 baths 2 beds |
show details | |

|
#16
Byron St
Haverhill, MA 01835
|
2,446 sq. feet
|
2 baths 4 beds |
show details | |

|
#17
Thornton St
Lawrence, MA 01841
|
912 sq. feet
|
1 baths 2 beds |
show details | |

|
#18
Williamine Dr
Newton, NH 03858
|
2,295 sq. feet
|
1 baths 3 beds |
show details | |

|
#19
S Broadway
Lawrence, MA 01843
|
5,706 sq. feet
|
2 baths 6 beds |
show details | |

|
#20
Merrill Ave
Lynn, MA 01902
|
1,136 sq. feet
|
1 baths 3 beds |
show details |
| Photo | Address | Area | Beds / Baths | Price | Details |
|---|---|---|---|---|---|

|
#21
Frances Street Aka 57 Francis Street
Haverhill, MA 01830
|
1,280 sq. feet
|
2 baths 3 beds |
show details | |

|
#22
Essex St
Swampscott, MA 01907
|
2,029 sq. feet
|
2 baths 3 beds |
show details | |

|
#23
Naugus Ave
Marblehead, MA 01945
|
1,544 sq. feet
|
1 baths 3 beds |
show details | |

|
#24
Atlantic Street, Unit A 10 A/k/a Unit 10, Marilyn Condominium
Lynn, MA 01902
|
576 sq. feet
|
1 baths 1 beds |
show details | |

|
#25
Mill River Ln
Rowley, MA 01969
|
2,705 sq. feet
|
2 baths 4 beds |
show details | |

|
#26
Quinn Rd
Lynn, MA 01904
|
1,512 sq. feet
|
1 baths 2 beds |
show details | |

|
#27
The Greenway
Swampscott, MA 01907
|
1,245 sq. feet
|
1 baths 2 beds |
show details | |

|
#28
Beaver Ave
Lynnfield, MA 01940
|
1,344 sq. feet
|
1 baths 3 beds |
show details | |

|
#29
Washington St
Haverhill, MA 01832
|
864 sq. feet
|
1 baths 2 beds |
show details | |

|
#30
Bear Hill Rd
Merrimac, MA 01860
|
1,304 sq. feet
|
1 baths 3 beds |
show details |
| Photo | Address | Area | Beds / Baths | Price | Details |
|---|---|---|---|---|---|

|
#31
Senee Ct
Amesbury, MA 01913
|
1,190 sq. feet
|
1 baths 3 beds |
show details | |

|
#32
Garden St
Haverhill, MA 01830
|
2,510 sq. feet
|
2 baths 4 beds |
show details | |

|
#33
Miller Pl
Lynn, MA 01904
|
1,037 sq. feet
|
1 baths 3 beds |
show details | |

|
#34
Williams Rd
Lynnfield, MA 01940
|
1,368 sq. feet
|
1 baths 1 beds |
show details | |

|
#35
John St
Haverhill, MA 01830
|
994 sq. feet
|
1 baths 2 beds |
show details | |

|
#36
Baldwin St
Haverhill, MA 01832
|
2,504 sq. feet
|
2 baths 6 beds |
show details | |

|
#37
Michael Rd
Lynn, MA 01904
|
1,594 sq. feet
|
3 baths 3 beds |
show details | |

|
#38
Maxwell St
Haverhill, MA 01832
|
1,036 sq. feet
|
1 baths 2 beds |
show details | |

|
#39
Clark St
Lynn, MA 01902
|
1,767 sq. feet
|
1 baths 4 beds |
show details | |

|
#40
Eutaw Ave
Lynn, MA 01902
|
1,185 sq. feet
|
1 baths 3 beds |
show details |
| Photo | Address | Area | Beds / Baths | Price | Details |
|---|---|---|---|---|---|

|
#41
Marengo St # 4
North Andover, MA 01845
|
1,765 sq. feet
|
3 baths 2 beds |
show details | |

|
#42
Rivers Edge Pl
Methuen, MA 01844
|
1,428 sq. feet
|
2 baths 3 beds |
show details | |

|
#43
Warrenton Rd
Haverhill, MA 01832
|
1,200 sq. feet
|
1 baths 3 beds |
show details | |

|
#44
Clovelly St
Lynn, MA 01902
|
1,207 sq. feet
|
1 baths 3 beds |
show details | |

|
#45
Birch St
Lynn, MA 01902
|
1,994 sq. feet
|
2 baths 4 beds |
show details | |

|
#46
Primrose St
Haverhill, MA 01830
|
2,680 sq. feet
|
2 baths 4 beds |
show details | |

|
#47
Elysian Dr
Andover, MA 01810
|
2,078 sq. feet
|
1 baths 4 beds |
show details | |

|
#48
W Whitehall Rd
Amesbury, MA 01913
|
1,593 sq. feet
|
1 baths 3 beds |
show details | |

|
#49
Thorndike Rd
North Andover, MA 01845
|
1,297 sq. feet
|
2 baths 4 beds |
show details | |

|
Check over 1 million property listings on Foreclosure.com!
|
browse all offers | |||

Latest news about housing in Ipswich, MA collected exclusively by city-data.com from local newspapers, TV, and radio stations

 | How Much Massachusetts Households Make Per Year: Census Data (37 replies) |
| Ipswich - Senior Housing/Agawam Village (19 replies) |
| Eastern MA Towns with Historic Homes, Large Lots, & Cute Town Center (22 replies) |
| towns that offer the most jobs per dollar of house (58 replies) |
| Is 700k the new 300k? (236 replies) |
| Affordable places to live for a boring hermit? (88 replies) |
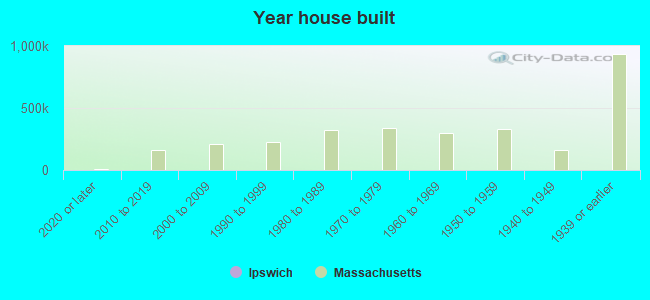
Median year apartment built: 1949
Household type by relationship:
Households: 4,876- Male householders: 1,125 (514 living alone), Female householders: 980 (319 living alone)
957 spouses (957 opposite-sex spouses), 35 unmarried partners, (35 opposite-sex unmarried partners), 1,372 children (1,295 natural, 28 adopted, 49 stepchildren), 108 grandchildren, 31 brothers or sisters, 90 parents, 0 foster children, 25 other relatives, 146 non-relatives
- In group quarters: 4
Size of family households: 496 2-persons, 249 3-persons, 237 4-persons, 166 5-persons, 35 6-persons.
Size of nonfamily households: 898 1-person, 29 2-persons, 9 3-persons, 35 4-persons.
699 married couples with children.
190 single-parent households (11 men, 179 women).
86.1% of residents of Ipswich speak English at home.
2.7% of residents speak Spanish at home (77% speak English very well, 23% speak English well).
5.5% of residents speak other Indo-European language at home (56% speak English very well, 39% speak English well, 5% speak English not well).
3.7% of residents speak Asian or Pacific Island language at home (62% speak English very well, 38% speak English not well).
Foreign born population: 510 (10.5%)
(55.9% of them are naturalized citizens)
| Here: | 6.5 |
| State: | 6.5 |
| Here: | 3.7 |
| State: | 4.0 |
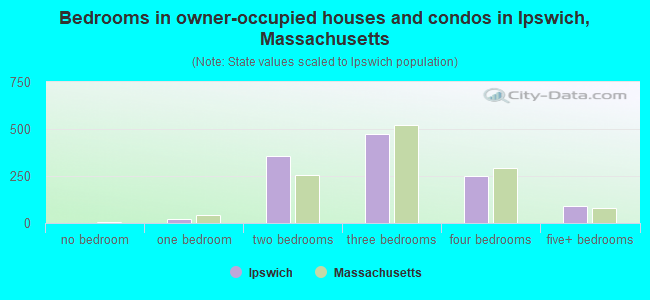
- Bedrooms in owner-occupied houses and condos in Ipswich, Massachusetts
- 0no bedroom
- 201 bedroom
- 3592 bedrooms
- 4753 bedrooms
- 2494 bedrooms
- 935+ bedrooms
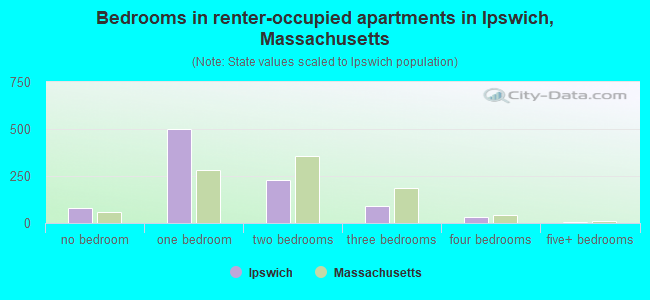
- Bedrooms in renter-occupied apartments in Ipswich, Massachusetts
- 78no bedroom
- 5001 bedroom
- 2282 bedrooms
- 913 bedrooms
- 314 bedrooms
- 75+ bedrooms
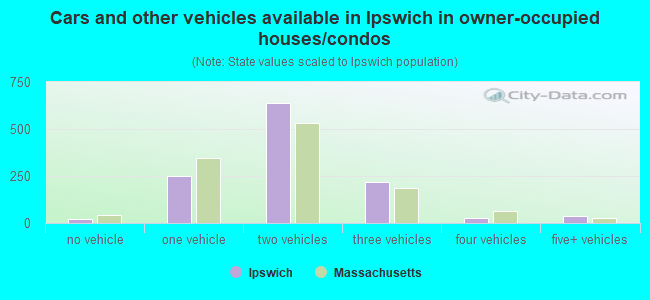
- Cars and other vehicles available in Ipswich in owner-occupied houses/condos
- 23no vehicle
- 2501 vehicle
- 6382 vehicles
- 2193 vehicles
- 284 vehicles
- 375+ vehicles
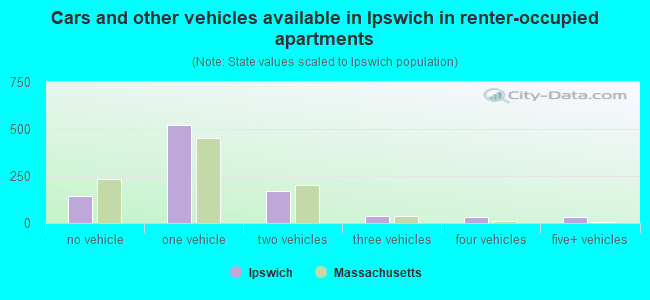
- Cars and other vehicles available in Ipswich in renter-occupied apartments
- 144no vehicle
- 5221 vehicle
- 1682 vehicles
- 383 vehicles
- 314 vehicles
- 325+ vehicles
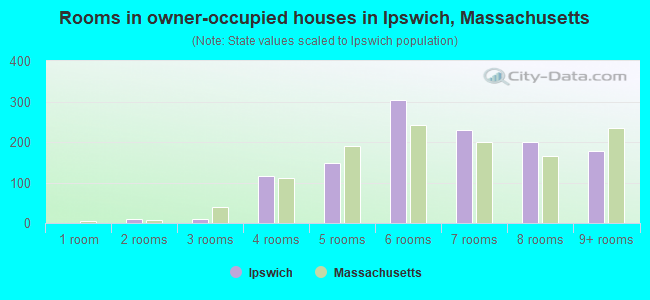
- Rooms in owner-occupied houses in Ipswich, Massachusetts
- 01 room
- 102 rooms
- 103 rooms
- 1164 rooms
- 1485 rooms
- 3046 rooms
- 2297 rooms
- 2008 rooms
- 1799+ rooms
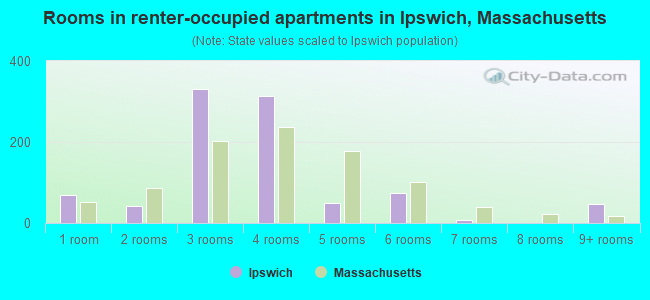
- Rooms in renter-occupied apartments in Ipswich, Massachusetts
- 681 room
- 422 rooms
- 3323 rooms
- 3144 rooms
- 505 rooms
- 756 rooms
- 87 rooms
- 08 rooms
- 489+ rooms
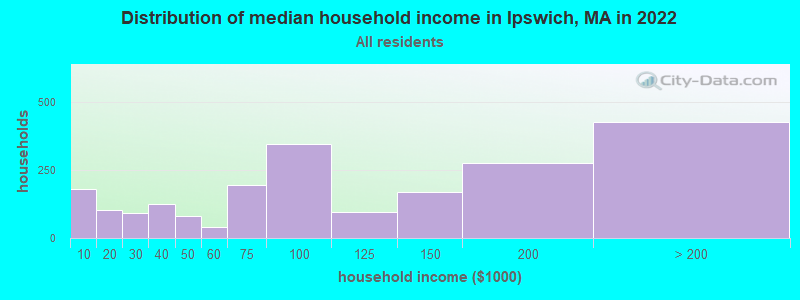
Ipswich, MA household income distribution

- 179Less than $10,000
- 105$10,000 to $19,999
- 92$20,000 to $29,999
- 126$30,000 to $39,999
- 80$40,000 to $49,999
- 40$50,000 to $59,999
- 197$60,000 to $74,999
- 347$75,000 to $99,999
- 96$100,000 to $124,999
- 168$125,000 to $149,999
- 277$150,000 to $199,999
- 428$200,000 or more
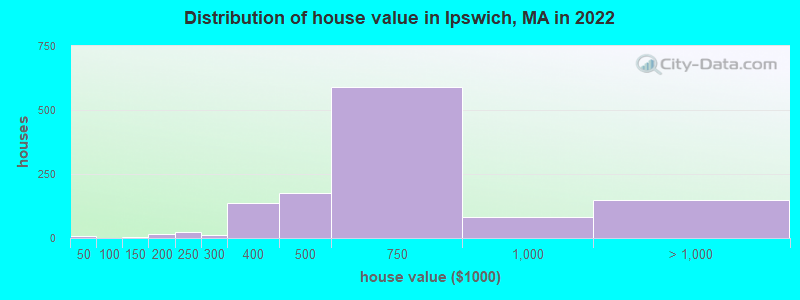
Home value of owner - occupied houses in 2022 in Ipswich, MA
-
- 7$35,000 to $39,999
- 2$125,000 to $149,999
- 6$150,000 to $174,999
- 10$175,000 to $199,999
- 23$200,000 to $249,999
- 13$250,000 to $299,999
- 137$300,000 to $399,999
- 176$400,000 to $499,999
- 590$500,000 to $749,999
- 80$750,000 to $999,999
- 100$1,000,000 to $1,499,999
- 10$1,500,000 to $1,999,999
- 36$2,000,000 or more
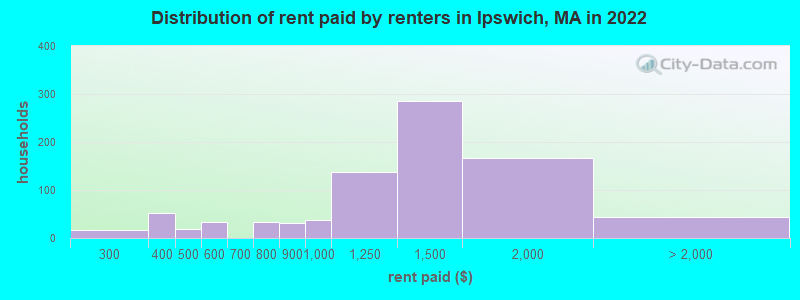
Rent paid by renters in 2022 in Ipswich, MA
-
- 8$200 to $249
- 8$250 to $299
- 24$300 to $349
- 27$350 to $399
- 19$450 to $499
- 30$500 to $549
- 3$550 to $599
- 33$700 to $749
- 31$800 to $899
- 37$900 to $999
- 137$1,000 to $1,249
- 285$1,250 to $1,499
- 165$1,500 to $1,999
- 9$2,000 to $2,499
- 34No cash rent
Percentage of workers working in this county: 76.4%
Number of people working at home: 481 (17.5% of all workers)
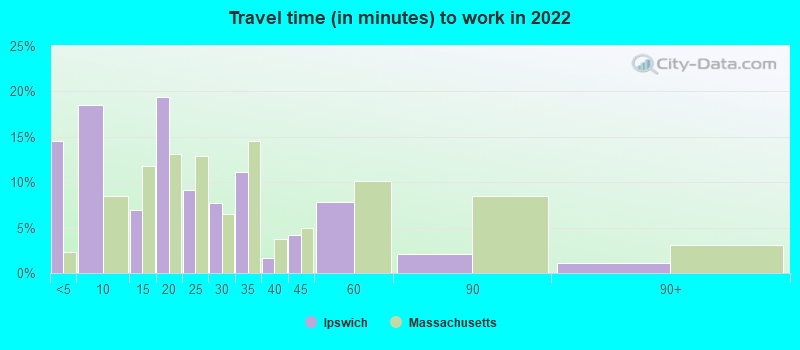
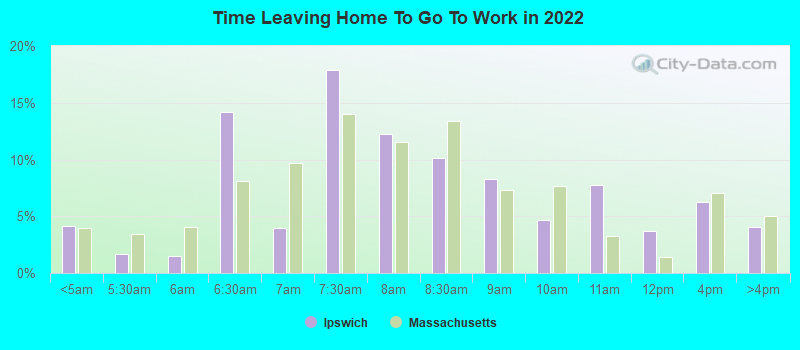
Travel time to work (commute)
- Less than 5 minutes: 226
- 5 to 9 minutes: 488
- 10 to 14 minutes: 154
- 15 to 19 minutes: 109
- 20 to 24 minutes: 376
- 25 to 29 minutes: 203
- 30 to 34 minutes: 139
- 35 to 39 minutes: 137
- 40 to 44 minutes: 86
- 45 to 59 minutes: 169
- 60 to 89 minutes: 161
- 90 or more minutes: 91
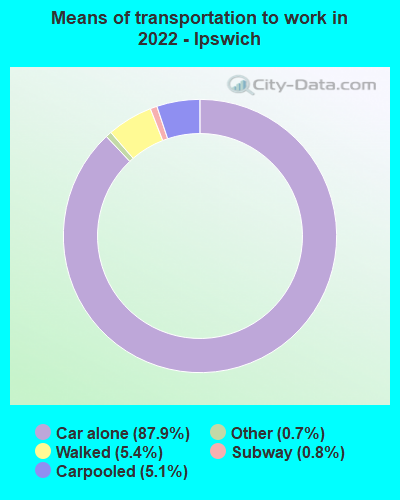
Means of transportation to work:
- Drove a car alone: 2,329 (74.3%)
- Carpooled: 103 (3.3%)
- Long-distance train or commuter rail: 20 (0.6%)
- Taxi: 29 (0.9%)
- Walked: 128 (4.1%)
- Worked at home: 481 (15.3%)
- Unemployment by race in 2022
- Unemployment rate for White non-Hispanic residents
- 0.2%Males
- 1.6%Females
- Unemployment rate for Black residents
- 100.0%Females
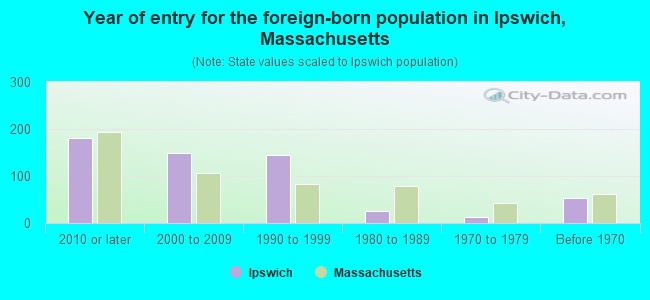
- Year of entry for the foreign-born population in Ipswich, Massachusetts
- 1812010 or later
- 1492000 to 2009
- 1441990 to 1999
- 261980 to 1989
- 121970 to 1979
- 54Before 1970
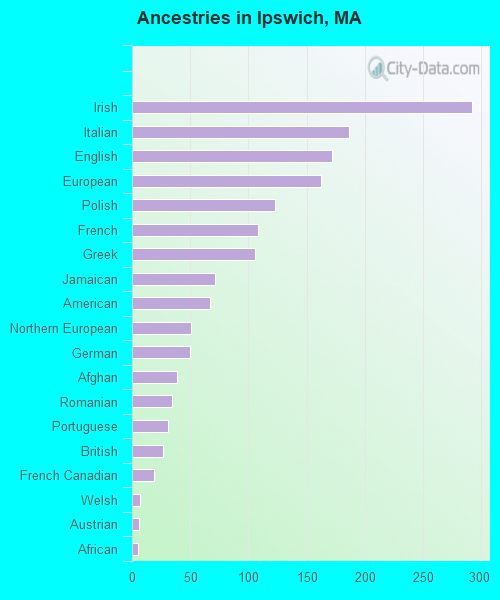
First ancestries reported:
- Irish: 292 (16.0%)
- Italian: 186 (10.2%)
- English: 172 (9.4%)
- European: 162 (8.9%)
- Polish: 123 (6.8%)
- French: 108 (5.9%)
- Greek: 106 (5.8%)
- Jamaican: 71 (3.9%)
- American: 67 (3.7%)
- Northern European: 51 (2.8%)
- German: 50 (2.7%)
- Afghan: 39 (2.1%)
- Romanian: 34 (1.9%)
- Portuguese: 31 (1.7%)
- British: 27 (1.5%)
- French Canadian: 19 (1.0%)
- Welsh: 7 (0.4%)
- Austrian: 6 (0.3%)
- African: 5 (0.3%)
Most common places of birth for foreign-born residents (%):
| Ipswich: | 18.7% (92) |
| Massachusetts: | 1.1% (13,065) |
| Ipswich: | 18.3% (90) |
| Massachusetts: | 8.4% (103,233) |
| Ipswich: | 12.6% (62) |
| Massachusetts: | 1.7% (21,468) |
| Ipswich: | 8.1% (40) |
| Massachusetts: | 1.1% (13,076) |
| Ipswich: | 6.5% (32) |
| Massachusetts: | 2.3% (28,158) |
| Ipswich: | 5.1% (25) |
| Massachusetts: | 0.3% (3,351) |
| Ipswich: | 4.9% (24) |
| Massachusetts: | 0.1% (883) |
| Ipswich: | 4.5% (22) |
| Massachusetts: | 0.9% (10,808) |
| Ipswich: | 3.2% (16) |
| Massachusetts: | 0.6% (7,301) |
| Ipswich: | 2.6% (13) |
| Massachusetts: | 1.1% (13,446) |
| Ipswich: | 2.2% (11) |
| Massachusetts: | 0.1% (851) |
| Ipswich: | 2.2% (11) |
| Massachusetts: | 1.0% (12,529) |
| Ipswich: | 2.0% (10) |
| Massachusetts: | 0.8% (10,043) |
| Ipswich: | 2.0% (10) |
| Massachusetts: | 0.1% (1,454) |
Place of birth for U.S.-born residents:
- This state: 3,014
- Other state: 1,270
- Northeast: 765
- Midwest: 225
- South: 113
- West: 168
93.8% of Ipswich residents lived in the same house 1 years ago.
Out of people who lived in different houses, 42.2% lived in this county.
Out of people who lived in different counties, 95.2% lived in Massachusetts.
| Ipswich: | 93.8% |
| State average: | 87.7% |
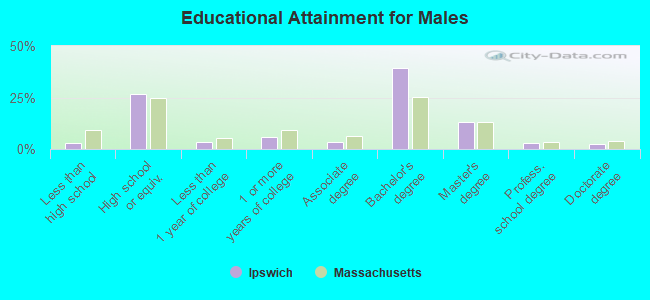
Education attainment for males 25 years and older:
- No schooling: 0
- Nursery to 4th grade: 0
- 5th and 6th grade: 0
- 7th and 8th grade: 6
- 9th grade: 0
- 10th grade: 11
- 11th grade: 0
- 12th grade, no diploma: 31
- High school graduate (or equivalency): 468
- Less than 1 year of college: 61
- Some college more than 1 year, no degree: 103
- Associate degree: 64
- Bachelor's degree: 697
- Master's degree: 227
- Professional school degree: 52
- Doctorate degree: 44
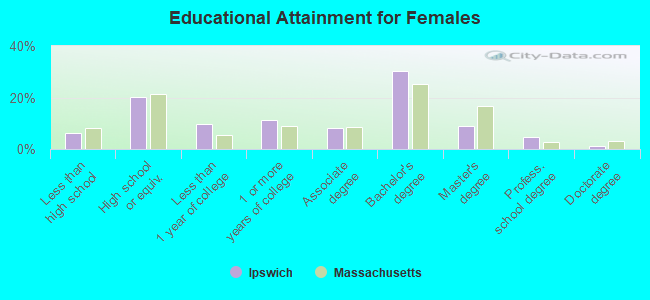
Education attainment for females 25 years and older:
- No schooling: 36
- Nursery to 4th grade: 0
- 5th and 6th grade: 20
- 7th and 8th grade: 0
- 9th grade: 21
- 10th grade: 6
- 11th grade: 0
- 12th grade, no diploma: 28
- High school graduate (or equivalency): 370
- Less than 1 year of college: 176
- Some college more than 1 year, no degree: 204
- Associate degree: 149
- Bachelor's degree: 557
- Master's degree: 165
- Professional school degree: 86
- Doctorate degree: 21
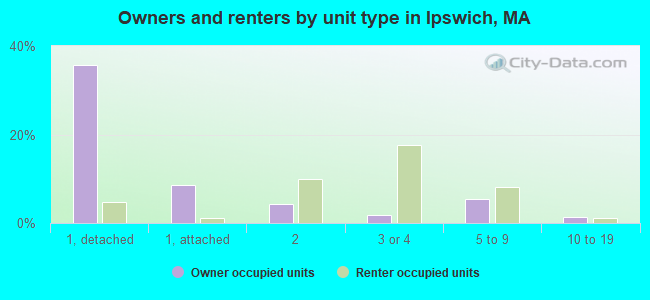
Housing units in structures:
- One, detached: 890
- One, attached: 213
- Two: 287
- 3 or 4: 388
- 5 to 9: 288
- 10 to 19: 48
- 20 to 49: 8
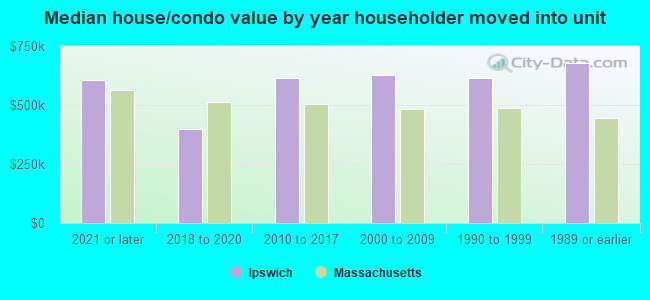
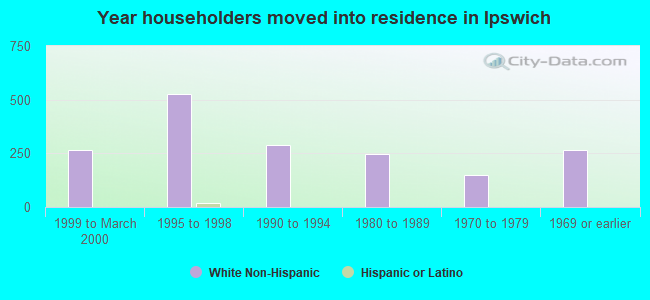
House/condo owner moved in on average 13 years ago
Renter moved in on average 2 years ago
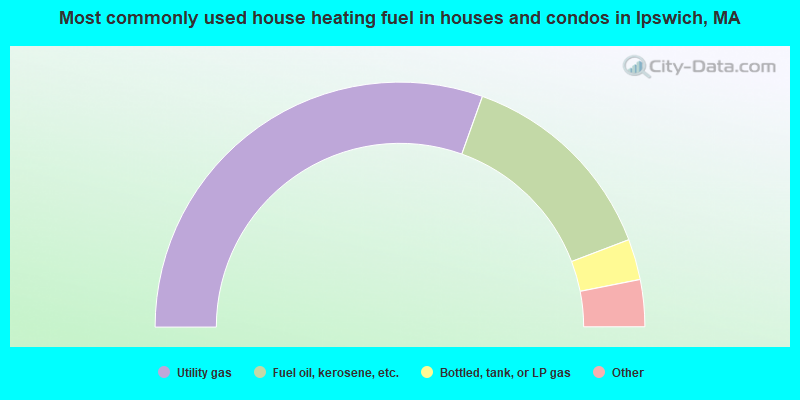
- 61.0%Utility gas
- 27.5%Fuel oil, kerosene, etc.
- 5.4%Bottled, tank, or LP gas
- 2.0%Electricity
- 1.9%Other fuel
- 1.8%Solar energy
- 0.4%Wood
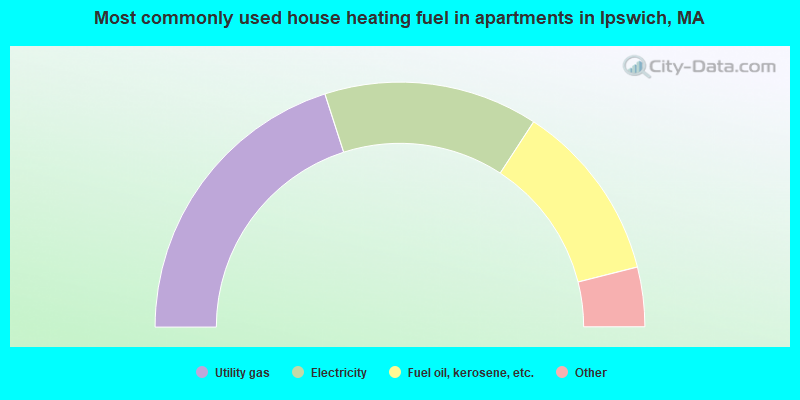
- 40.2%Utility gas
- 28.4%Electricity
- 23.8%Fuel oil, kerosene, etc.
- 3.5%Solar energy
- 2.1%Bottled, tank, or LP gas
- 1.1%Wood
- 1.1%Other fuel
Private vs. public school enrollment:
| Here: | 21.3% |
| Massachusetts: | 10.3% |
| Here: | 3.4% |
| Massachusetts: | 12.3% |
| Here: | 43.4% |
| Massachusetts: | 51.2% |