Jearoldstown, TN (Tennessee) Houses and Residents
| Jearoldstown: | $199,194 |
| Tennessee: | $284,800 |
Total population: 2,946 (Urban population: 0, Rural population: 2,820 (397 farm, 2,423 nonfarm))
Houses: 1,273 (1,135 occupied: 956 owner occupied, 179 renter occupied)
| % of renters here: | 16% |
| State: | 33% |
Housing density: 26 houses/condos per square mile
Median price asked for vacant for-sale houses and condos in 2022 in this county: $235,663.
Median contract rent in 2022: $422 (lower quartile is $300, upper quartile is $479)
Median rent asked for vacant for-rent units in 2022: $365
Median gross rent in Jearoldstown, TN in 2022: $576
Housing units in Jearoldstown with a mortgage: 243 (0 second mortgage, 13 home equity loan, 0 both second mortgage and home equity loan)
Houses without a mortgage: 248


Household type by relationship:
Households: 67,079- In family households: 56,675 (13,844 male householders, 5,378 female householders)
14,525 spouses, 17,250 children (15,402 natural, 628 adopted, 1,220 stepchildren), 1,954 grandchildren, 477 brothers or sisters, 529 parents, foster children, 697 other relatives, 1,564 non-relatives
- In nonfamily households: 10,404 (4,034 male householders (3,301 living alone)), 4,762 female householders (4,214 living alone)), 1,608 nonrelatives
- In group quarters: 1,752 (903 institutionalized population)
9,250 married couples with children.
3,195 single-parent households (797 men, 2,398 women).
96.2% of residents of Jearoldstown speak English at home.
2.1% of residents speak Spanish at home (89% speak English very well, 11% speak English well).
1.2% of residents speak other Indo-European language at home (100% speak English very well).
0.6% of residents speak Asian or Pacific Island language at home (100% speak English very well).
Foreign born population: 56 (1.8%)
(89.3% of them are naturalized citizens)
| Here: | 6.3 |
| State: | 6.5 |
| Here: | 4.6 |
| State: | 4.4 |

- Bedrooms in owner-occupied houses and condos in Jearoldstown, Tennessee
- 0no bedroom
- 121 bedroom
- 2532 bedrooms
- 5693 bedrooms
- 1004 bedrooms
- 225+ bedrooms

- Bedrooms in renter-occupied apartments in Jearoldstown, Tennessee
- 0no bedroom
- 331 bedroom
- 922 bedrooms
- 413 bedrooms
- 134 bedrooms
- 05+ bedrooms

- Cars and other vehicles available in Jearoldstown in owner-occupied houses/condos
- 43no vehicle
- 2021 vehicle
- 3842 vehicles
- 2523 vehicles
- 544 vehicles
- 215+ vehicles

- Cars and other vehicles available in Jearoldstown in renter-occupied apartments
- 14no vehicle
- 401 vehicle
- 722 vehicles
- 393 vehicles
- 144 vehicles
- 05+ vehicles

- Rooms in owner-occupied houses in Jearoldstown, Tennessee
- 01 room
- 02 rooms
- 123 rooms
- 1354 rooms
- 2385 rooms
- 2566 rooms
- 1977 rooms
- 718 rooms
- 479+ rooms

- Rooms in renter-occupied apartments in Jearoldstown, Tennessee
- 01 room
- 72 rooms
- 273 rooms
- 494 rooms
- 345 rooms
- 216 rooms
- 187 rooms
- 238 rooms
- 09+ rooms


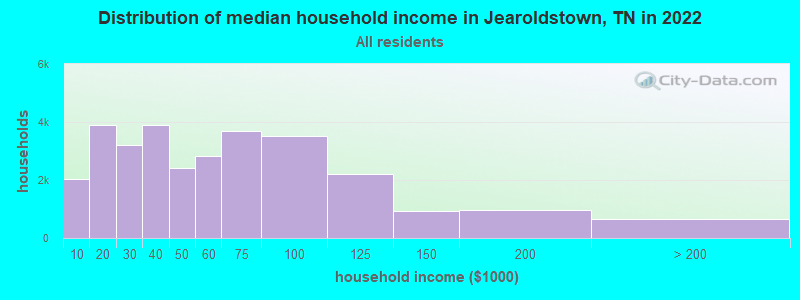
Jearoldstown, TN household income distribution

- 2,020Less than $10,000
- 3,893$10,000 to $19,999
- 3,197$20,000 to $29,999
- 3,901$30,000 to $39,999
- 2,412$40,000 to $49,999
- 2,841$50,000 to $59,999
- 3,675$60,000 to $74,999
- 3,516$75,000 to $99,999
- 2,198$100,000 to $124,999
- 929$125,000 to $149,999
- 982$150,000 to $199,999
- 671$200,000 or more
Percentage of workers working in this county: 50.1%
Number of people working at home: 137 (9.8% of all workers)
Travel time to work (commute)
- Less than 5 minutes: 13
- 5 to 9 minutes: 24
- 10 to 14 minutes: 27
- 15 to 19 minutes: 141
- 20 to 24 minutes: 281
- 25 to 29 minutes: 187
- 30 to 34 minutes: 261
- 35 to 39 minutes: 61
- 40 to 44 minutes: 27
- 45 to 59 minutes: 72
- 60 to 89 minutes: 40
- 90 or more minutes: 37
Means of transportation to work:
- Drove a car alone: 1,057 (84.6%)
- Carpooled: 102 (8.2%)
- Bicycle: 6 (0.5%)
- Other means: 6 (0.5%)
- Worked at home: 79 (6.3%)


- Year of entry for the foreign-born population in Jearoldstown, Tennessee
- 01995 to March 2000
- 01990 to 1994
- 61985 to 1989
- 91980 to 1984
- 01975 to 1979
- 81970 to 1974
- 01965 to 1969
- 17Before 1965
Most common places of birth for foreign-born residents (%):
| Jearoldstown: | 37.5% (15) |
| Tennessee: | 2.6% (4,078) |
| Jearoldstown: | 30.0% (12) |
| Tennessee: | 0.4% (599) |
| Jearoldstown: | 20.0% (8) |
| Tennessee: | 5.2% (8,316) |
| Jearoldstown: | 12.5% (5) |
| Tennessee: | 0.2% (284) |
Place of birth for U.S.-born residents:
- This state: 2,035
- Other state: 733
- Northeast: 146
- Midwest: 153
- South: 418
- West: 16
65% of Jearoldstown residents lived in the same house 5 years ago.
Out of people who lived in different houses, 50% lived in this county.
Out of people who lived in different counties, 55% lived in Tennessee.
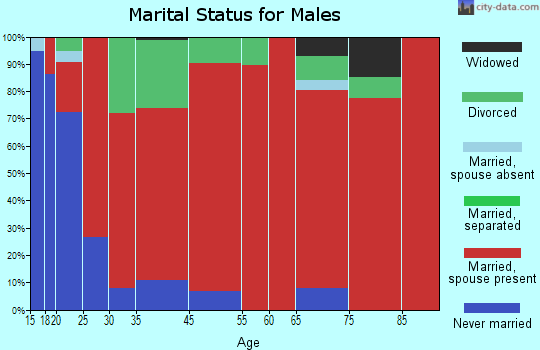
Education attainment for males 25 years and older:
- No schooling: 0
- Nursery to 4th grade: 15
- 5th and 6th grade: 25
- 7th and 8th grade: 90
- 9th grade: 26
- 10th grade: 86
- 11th grade: 65
- 12th grade, no diploma: 13
- High school graduate (or equivalency): 415
- Less than 1 year of college: 33
- Some college more than 1 year, no degree: 75
- Associate degree: 22
- Bachelor's degree: 69
- Master's degree: 31
- Professional school degree: 5
- Doctorate degree: 12

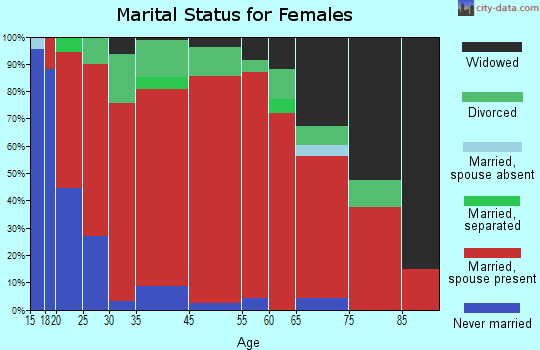
Education attainment for females 25 years and older:
- No schooling: 10
- Nursery to 4th grade: 10
- 5th and 6th grade: 30
- 7th and 8th grade: 83
- 9th grade: 51
- 10th grade: 22
- 11th grade: 44
- 12th grade, no diploma: 47
- High school graduate (or equivalency): 413
- Less than 1 year of college: 15
- Some college more than 1 year, no degree: 104
- Associate degree: 61
- Bachelor's degree: 62
- Master's degree: 47
- Professional school degree: 5
- Doctorate degree: 14

Housing units in structures:
- One, detached: 931
- One, attached: 6
- Mobile homes: 336
Median worth of mobile homes: $146,013
Housing units lacking complete kitchen facilities: 1.6%

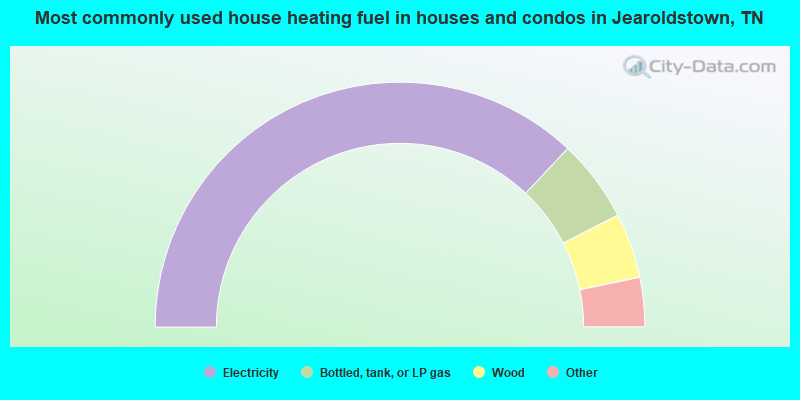
- 74.1%Electricity
- 10.9%Bottled, tank, or LP gas
- 8.6%Wood
- 2.4%Fuel oil, kerosene, etc.
- 1.6%Coal or coke
- 1.2%No fuel used
- 0.7%Other fuel
- 0.6%Utility gas
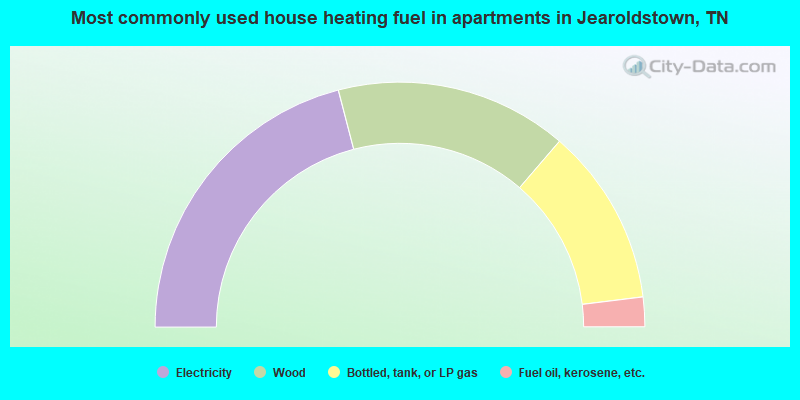
- 41.9%Electricity
- 30.7%Wood
- 23.5%Bottled, tank, or LP gas
- 3.9%Fuel oil, kerosene, etc.
Private vs. public school enrollment:
| Here: | 2.7% |
| Tennessee: | 9.5% |
| Here: | 6.2% |
| Tennessee: | 10.4% |
| Here: | 0.0% |
| Tennessee: | 22.8% |


