Jurupa, CA (California) Houses and Residents
| Jurupa: | $547,995 |
| California: | $715,900 |
Total population: 112,225 (Urban population: 83,043, Rural population: 2,189 (296 farm, 1,893 nonfarm))
Houses: 24,828 (23,695 occupied: 16,891 owner occupied, 6,804 renter occupied)
| % of renters here: | 29% |
| State: | 44% |
Housing density: 409 houses/condos per square mile
Median price asked for vacant for-sale houses and condos in 2022 in this county: $550,307.
Median contract rent in 2022: $1,476 (lower quartile is $1,064, upper quartile is $1,948)
Median rent asked for vacant for-rent units in 2022: $1,495
Median gross rent in Jurupa, CA in 2022: $1,645
Housing units in Jurupa with a mortgage: 12,451 (2,211 second mortgage, 740 home equity loan, 8 both second mortgage and home equity loan)
Houses without a mortgage: 1,818
Compare current foreclosures near Jurupa, CA:
| Photo | Address | Area | Beds / Baths | Price | Details |
|---|---|---|---|---|---|

|
#1
Vellanto Way
Moreno Valley, CA 92553
|
1,316 sq. feet
|
2 baths 3 beds |
$480,000
|
show details |

|
#2
E G St
Ontario, CA 91764
|
1,036 sq. feet
|
1 baths 3 beds |
$577,200
|
show details |

|
#3
View Ln
Corona, CA 92881
|
2,420 sq. feet
|
3 baths 3 beds |
$30,425
|
show details |

|
#4
Apple Court
Upland, CA 91786
|
1,655 sq. feet
|
2 baths 2 beds |
show details | |

|
#5
Celebration St
Chino, CA 91708
|
1,644 sq. feet
|
2 baths 3 beds |
show details | |

|
#6
Carnation Ln Apt C
Moreno Valley, CA 92557
|
1,030 sq. feet
|
1 baths 2 beds |
show details | |

|
#7
Date St
Fontana, CA 92335
|
1,188 sq. feet
|
1 baths 3 beds |
show details | |

|
#8
S J St
San Bernardino, CA 92410
|
837 sq. feet
|
1 baths 2 beds |
show details | |

|
#9
N Allen St
San Bernardino, CA 92408
|
981 sq. feet
|
2 baths 3 beds |
show details | |

|
#10
Ceres Ave
Fontana, CA 92335
|
1,248 sq. feet
|
1 baths 3 beds |
show details |
| Photo | Address | Area | Beds / Baths | Price | Details |
|---|---|---|---|---|---|

|
#11
Tate St
Pomona, CA 91767
|
1,656 sq. feet
|
1 baths 3 beds |
show details | |

|
#12
Split Mountain Ln
San Bernardino, CA 92407
|
2,963 sq. feet
|
2 baths 4 beds |
show details | |

|
#13
Huntsman Pl
Fontana, CA 92336
|
3,216 sq. feet
|
4 baths 5 beds |
show details | |

|
#14
Sugar Gum Rd
Riverside, CA 92508
|
2,028 sq. feet
|
2 baths 4 beds |
show details | |

|
#15
Independence Way
Corona, CA 92882
|
2,040 sq. feet
|
2 baths 4 beds |
show details | |

|
#16
S Arrowhead Ave
Rialto, CA 92376
|
1,986 sq. feet
|
2 baths 4 beds |
show details | |

|
#17
S Buena Vista Ave
Corona, CA 92882
|
3,099 sq. feet
|
2 baths 4 beds |
show details | |

|
#18
14th St
Chino, CA 91710
|
1,526 sq. feet
|
2 baths 3 beds |
show details | |

|
#19
N Eucalyptus Ave
Rialto, CA 92376
|
2,615 sq. feet
|
3 baths 4 beds |
show details | |

|
#20
Amador Ave
Ontario, CA 91764
|
1,154 sq. feet
|
2 baths 4 beds |
show details |
| Photo | Address | Area | Beds / Baths | Price | Details |
|---|---|---|---|---|---|

|
#21
Turning Leaf Pl
Rancho Cucamonga, CA 91701
|
2,252 sq. feet
|
2 baths 3 beds |
show details | |

|
#22
Crestview Dr
Norco, CA 92860
|
3,022 sq. feet
|
2 baths 3 beds |
show details | |

|
#23
Valencia Ave
Fontana, CA 92335
|
984 sq. feet
|
1 baths 3 beds |
show details | |

|
#24
Barbee St
Fontana, CA 92336
|
1,242 sq. feet
|
2 baths 3 beds |
show details | |

|
#25
Linden Ln
Rancho Cucamonga, CA 91701
|
1,325 sq. feet
|
2 baths 3 beds |
show details | |

|
#26
E Spruce St
Ontario, CA 91761
|
1,199 sq. feet
|
2 baths 3 beds |
show details | |

|
#27
Quartz Cir
Corona, CA 92882
|
3,181 sq. feet
|
4 baths 5 beds |
show details | |

|
#28
S Lassen Ave
Ontario, CA 91761
|
1,498 sq. feet
|
2 baths 4 beds |
show details | |

|
#29
W 55th St
San Bernardino, CA 92407
|
1,710 sq. feet
|
2 baths 3 beds |
show details | |

|
#30
S Towne Ave
Pomona, CA 91766
|
1,980 sq. feet
|
3 baths 3 beds |
show details |
| Photo | Address | Area | Beds / Baths | Price | Details |
|---|---|---|---|---|---|

|
#31
Central Ave
Riverside, CA 92504
|
744 sq. feet
|
1 baths 2 beds |
show details | |

|
#32
Belvedere Way
Corona, CA 92882
|
2,113 sq. feet
|
3 baths 4 beds |
show details | |

|
#33
Avalon Ct
Rancho Cucamonga, CA 91701
|
1,362 sq. feet
|
2 baths 4 beds |
show details | |

|
#34
S La Cadena Dr
Colton, CA 92324
|
1,973 sq. feet
|
2 baths 4 beds |
show details | |

|
#35
Dickenson Ct
Upland, CA 91786
|
1,738 sq. feet
|
2 baths 5 beds |
show details | |

|
#36
Lander Cir
Claremont, CA 91711
|
1,469 sq. feet
|
2 baths 3 beds |
show details | |

|
#37
Guthrie St
San Bernardino, CA 92404
|
1,963 sq. feet
|
2 baths 4 beds |
show details | |

|
#38
Fernwood Ave
Rialto, CA 92377
|
1,211 sq. feet
|
2 baths 3 beds |
show details | |

|
#39
N Palm Ave
Upland, CA 91784
|
3,491 sq. feet
|
3 baths 4 beds |
show details | |

|
#40
Lumerina St
Corona, CA 92883
|
3,675 sq. feet
|
3 baths 3 beds |
show details |
| Photo | Address | Area | Beds / Baths | Price | Details |
|---|---|---|---|---|---|

|
#41
S Peak Ct
Riverside, CA 92503
|
4,576 sq. feet
|
3 baths 4 beds |
show details | |

|
#42
Meadow View Dr
Pomona, CA 91766
|
1,538 sq. feet
|
2 baths 4 beds |
show details | |

|
#43
E Merion St
Ontario, CA 91761
|
2,220 sq. feet
|
2 baths 4 beds |
show details | |

|
#44
N Melvin Dr
San Bernardino, CA 92407
|
2,531 sq. feet
|
4 baths 3 beds |
show details | |

|
#45
Terrace Rd
Rialto, CA 92376
|
1,443 sq. feet
|
2 baths 4 beds |
show details | |

|
#46
Lennox St
Pomona, CA 91767
|
1,275 sq. feet
|
2 baths 4 beds |
show details | |

|
#47
N Gordon St
Pomona, CA 91768
|
1,653 sq. feet
|
2 baths 3 beds |
show details | |

|
#48
Sanctuary Dr
Corona, CA 92883
|
4,767 sq. feet
|
3 baths 4 beds |
show details | |

|
#49
Flora St
Montclair, CA 91763
|
1,145 sq. feet
|
2 baths 4 beds |
show details | |

|
Check over 1 million property listings on Foreclosure.com!
|
browse all offers | |||

Household type by relationship:
Households: 2,153,812- In family households: 1,916,707 (357,691 male householders, 152,550 female householders)
376,381 spouses, 728,028 children (675,451 natural, 15,499 adopted, 37,078 stepchildren), 69,455 grandchildren, 34,232 brothers or sisters, 33,896 parents, foster children, 57,727 other relatives, 76,462 non-relatives
- In nonfamily households: 237,105 (84,686 male householders (58,397 living alone)), 91,333 female householders (74,097 living alone)), 61,086 nonrelatives
- In group quarters: 35,829 (20,862 institutionalized population)
308,692 married couples with children.
98,911 single-parent households (26,262 men, 72,649 women).
57.3% of residents of Jurupa speak English at home.
39.2% of residents speak Spanish at home (47% speak English very well, 23% speak English well, 20% speak English not well, 10% don't speak English at all).
1.5% of residents speak other Indo-European language at home (73% speak English very well, 19% speak English well, 8% speak English not well, 1% don't speak English at all).
1.5% of residents speak Asian or Pacific Island language at home (50% speak English very well, 25% speak English well, 22% speak English not well, 3% don't speak English at all).
0.4% of residents speak other language at home (60% speak English very well, 31% speak English well, 9% speak English not well).
Foreign born population: 36,256 (26.6%)
(54.2% of them are naturalized citizens)
| Here: | 6.1 |
| State: | 6.0 |
| Here: | 4.3 |
| State: | 3.9 |

- Bedrooms in owner-occupied houses and condos in Jurupa, California
- 472no bedroom
- 1,4781 bedroom
- 2,8182 bedrooms
- 6,8913 bedrooms
- 4,5474 bedrooms
- 6855+ bedrooms

- Bedrooms in renter-occupied apartments in Jurupa, California
- 824no bedroom
- 1,7641 bedroom
- 2,0802 bedrooms
- 1,3943 bedrooms
- 6614 bedrooms
- 815+ bedrooms

- Cars and other vehicles available in Jurupa in owner-occupied houses/condos
- 562no vehicle
- 3,6771 vehicle
- 6,9912 vehicles
- 3,7033 vehicles
- 1,3694 vehicles
- 5895+ vehicles

- Cars and other vehicles available in Jurupa in renter-occupied apartments
- 1,245no vehicle
- 2,8741 vehicle
- 1,9342 vehicles
- 5203 vehicles
- 1614 vehicles
- 705+ vehicles

- Rooms in owner-occupied houses in Jurupa, California
- 731 room
- 6882 rooms
- 1,6993 rooms
- 1,2364 rooms
- 3,5415 rooms
- 3,8556 rooms
- 3,3607 rooms
- 1,7048 rooms
- 7359+ rooms

- Rooms in renter-occupied apartments in Jurupa, California
- 5911 room
- 9392 rooms
- 1,2503 rooms
- 1,4064 rooms
- 1,0515 rooms
- 8666 rooms
- 4197 rooms
- 1698 rooms
- 1139+ rooms


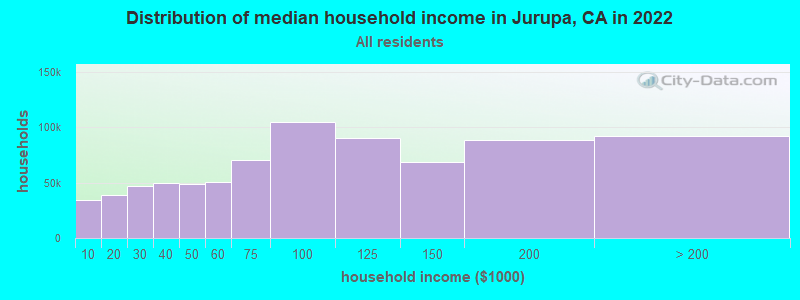
Jurupa, CA household income distribution

- 34,381Less than $10,000
- 38,881$10,000 to $19,999
- 46,927$20,000 to $29,999
- 49,864$30,000 to $39,999
- 49,247$40,000 to $49,999
- 50,645$50,000 to $59,999
- 70,913$60,000 to $74,999
- 104,937$75,000 to $99,999
- 90,307$100,000 to $124,999
- 69,071$125,000 to $149,999
- 88,249$150,000 to $199,999
- 92,345$200,000 or more
Percentage of workers working in this county: 53.7%
Number of people working at home: 7,042 (11.7% of all workers)
Travel time to work (commute)
- Less than 5 minutes: 613
- 5 to 9 minutes: 1,823
- 10 to 14 minutes: 3,422
- 15 to 19 minutes: 5,341
- 20 to 24 minutes: 4,941
- 25 to 29 minutes: 1,722
- 30 to 34 minutes: 3,738
- 35 to 39 minutes: 472
- 40 to 44 minutes: 890
- 45 to 59 minutes: 2,288
- 60 to 89 minutes: 3,385
- 90 or more minutes: 2,224
Means of transportation to work:
- Drove a car alone: 23,020 (72.4%)
- Carpooled: 6,473 (20.4%)
- Bus or trolley bus: 260 (0.8%)
- Railroad: 159 (0.5%)
- Motorcycle: 90 (0.3%)
- Bicycle: 101 (0.3%)
- Walked: 336 (1.1%)
- Other means: 420 (1.3%)
- Worked at home: 933 (2.9%)

- Year of entry for the foreign-born population in Jurupa, California
- 2,8141995 to March 2000
- 2,7581990 to 1994
- 3,8391985 to 1989
- 2,7711980 to 1984
- 2,5271975 to 1979
- 2,1171970 to 1974
- 9701965 to 1969
- 1,787Before 1965
Most common places of birth for foreign-born residents (%):
| Jurupa: | 79.1% (15,499) |
| California: | 44.3% (3,928,701) |
| Jurupa: | 2.1% (409) |
| California: | 4.1% (359,673) |
| Jurupa: | 1.8% (356) |
| California: | 7.5% (664,935) |
| Jurupa: | 1.8% (354) |
| California: | 2.4% (211,458) |
Place of birth for U.S.-born residents:
- This state: 48,560
- Other state: 16,390
- Northeast: 3,014
- Midwest: 6,130
- South: 4,449
- West: 2,797
52% of Jurupa residents lived in the same house 5 years ago.
Out of people who lived in different houses, 54% lived in this county.
Out of people who lived in different counties, 91% lived in California.
Education attainment for males 25 years and older:
- No schooling: 896
- Nursery to 4th grade: 631
- 5th and 6th grade: 1,671
- 7th and 8th grade: 918
- 9th grade: 794
- 10th grade: 1,016
- 11th grade: 1,174
- 12th grade, no diploma: 1,962
- High school graduate (or equivalency): 5,994
- Less than 1 year of college: 1,829
- Some college more than 1 year, no degree: 3,669
- Associate degree: 1,130
- Bachelor's degree: 1,329
- Master's degree: 345
- Professional school degree: 187
- Doctorate degree: 66

Education attainment for females 25 years and older:
- No schooling: 1,096
- Nursery to 4th grade: 458
- 5th and 6th grade: 1,508
- 7th and 8th grade: 876
- 9th grade: 936
- 10th grade: 1,006
- 11th grade: 1,102
- 12th grade, no diploma: 1,468
- High school graduate (or equivalency): 6,713
- Less than 1 year of college: 2,089
- Some college more than 1 year, no degree: 4,100
- Associate degree: 1,393
- Bachelor's degree: 1,084
- Master's degree: 329
- Professional school degree: 137
- Doctorate degree: 42

Housing units in structures:
- One, detached: 18,638
- One, attached: 1,093
- Two: 225
- 3 or 4: 437
- 5 to 9: 363
- 10 to 19: 814
- 20 to 49: 208
- 50 or more: 471
- Mobile homes: 2,416
- Boats, RVs, vans, etc.: 163
Median worth of mobile homes: $54,577
Housing units lacking complete kitchen facilities: 1.1%

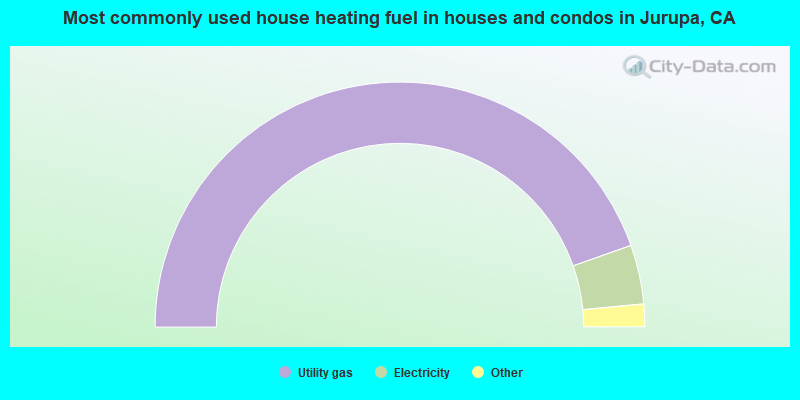
- 89.2%Utility gas
- 7.8%Electricity
- 1.2%Bottled, tank, or LP gas
- 1.0%No fuel used
- 0.7%Wood

- 80.4%Utility gas
- 14.4%Electricity
- 2.1%Bottled, tank, or LP gas
- 2.0%No fuel used
- 1.0%Wood
- 0.1%Other fuel
Private vs. public school enrollment:
| Here: | 5.3% |
| California: | 9.9% |
| Here: | 4.5% |
| California: | 7.8% |
| Here: | 15.6% |
| California: | 15.4% |


