Kabletown district, WV (West Virginia) Houses and Residents
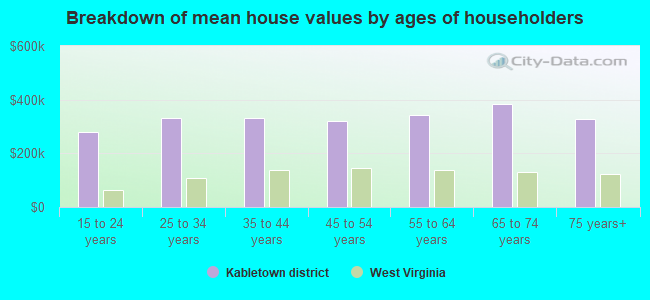
| Kabletown district: | $375,912 |
| West Virginia: | $155,100 |
Total population: 12,110 (Urban population: 1,600 (all inside urban clusters), Rural population: 8,480 (239 farm, 8,241 nonfarm))
Houses: 4,210 (3,813 occupied: 3,237 owner occupied, 576 renter occupied)
| % of renters here: | 15% |
| State: | 26% |
Housing density: 59 houses/condos per square mile
Median price asked for vacant for-sale houses and condos in 2022 in this county: $352,320.
Median contract rent in 2022: $1,029 (lower quartile is $717, upper quartile is $1,319)
Median rent asked for vacant for-rent units in 2022: $1,457
Median gross rent in Kabletown district, WV in 2022: $1,218
Housing units in Kabletown district with a mortgage: 2,221 (256 second mortgage, 282 home equity loan, 0 both second mortgage and home equity loan)
Houses without a mortgage: 613
Compare current foreclosures near Kabletown district, WV:
| Photo | Address | Area | Beds / Baths | Price | Details |
|---|---|---|---|---|---|

|
#1
W Virginia Ave
Martinsburg, WV 25401
|
1,404 sq. feet
|
1 baths 3 beds |
$250,000
|
show details |

|
#2
Chantilly Ln
Inwood, WV 25428
|
2,069 sq. feet
|
2 baths 3 beds |
show details | |

|
#3
Cherokee Dr
Inwood, WV 25428
|
2,176 sq. feet
|
2 baths 3 beds |
show details | |

|
#4
Cemetery Cir
Knoxville, MD 21758
|
1,368 sq. feet
|
1 baths 4 beds |
show details | |

|
#5
Glencoe Ct
Round Hill, VA 20141
|
6,164 sq. feet
|
5 baths 5 beds |
show details | |

|
#6
Pennsylvania Ave
Winchester, VA 22601
|
900 sq. feet
|
1 baths 2 beds |
show details | |

|
#7
Wright Dr
Clear Brook, VA 22624
|
2,354 sq. feet
|
2 baths 3 beds |
show details | |

|
#8
S Mildred St
Charles Town, WV 25414
|
1,822 sq. feet
|
2 baths 3 beds |
show details | |

|
#9
Allen Dr
Winchester, VA 22601
|
1,793 sq. feet
|
2 baths 3 beds |
show details | |

|
#10
Fiesta Dr
Stephenson, VA 22656
|
2,424 sq. feet
|
3 baths 4 beds |
show details |
| Photo | Address | Area | Beds / Baths | Price | Details |
|---|---|---|---|---|---|

|
#11
Orion Pl
Martinsburg, WV 25404
|
1,818 sq. feet
|
2 baths 3 beds |
show details | |

|
#12
Lick Run Xing
Stephenson, VA 22656
|
3,874 sq. feet
|
2 baths 3 beds |
show details | |

|
#13
Sulphur Springs Rd
Inwood, WV 25428
|
1,778 sq. feet
|
2 baths 3 beds |
show details | |

|
#14
Morgan St
Inwood, WV 25428
|
2,276 sq. feet
|
2 baths 3 beds |
show details | |

|
#15
Specks Run Rd
Bunker Hill, WV 25413
|
1,490 sq. feet
|
1 baths 3 beds |
show details | |

|
#16
Country Club Cir
Winchester, VA 22602
|
3,016 sq. feet
|
3 baths 4 beds |
show details | |

|
#17
Hawthorne Ave
Martinsburg, WV 25401
|
1,000 sq. feet
|
1 baths 3 beds |
show details | |

|
#18
Larry Way
Bunker Hill, WV 25413
|
1,232 sq. feet
|
2 baths 3 beds |
show details | |

|
#19
Sly Fox Ct
Bunker Hill, WV 25413
|
1,272 sq. feet
|
2 baths 3 beds |
show details | |

|
#20
Battle Ave
Winchester, VA 22601
|
954 sq. feet
|
1 baths 3 beds |
show details |
| Photo | Address | Area | Beds / Baths | Price | Details |
|---|---|---|---|---|---|

|
#21
Georgetown Sq
Martinsburg, WV 25401
|
1,326 sq. feet
|
2 baths 3 beds |
show details | |

|
#22
Glenridge Dr
Winchester, VA 22602
|
2,240 sq. feet
|
3 baths 3 beds |
show details | |

|
#23
Old Charles Town Rd
Stephenson, VA 22656
|
611 sq. feet
|
1 baths 2 beds |
show details | |

|
#24
Pappy Ct
Bunker Hill, WV 25413
|
3,263 sq. feet
|
2 baths 4 beds |
show details | |

|
#25
Hoover Dr
Inwood, WV 25428
|
1,056 sq. feet
|
2 baths 3 beds |
show details | |

|
#26
Idyllwood Dr
Inwood, WV 25428
|
1,460 sq. feet
|
2 baths 3 beds |
show details | |

|
#27
Old Waterloo Rd
Boyce, VA 22620
|
4,401 sq. feet
|
3 baths 3 beds |
show details | |

|
#28
Rocky Ln
Lovettsville, VA 20180
|
3,520 sq. feet
|
4 baths - beds |
show details | |

|
#29
Marlowe Dr
Inwood, WV 25428
|
1,263 sq. feet
|
2 baths 3 beds |
show details | |

|
#30
Andrew Dr
Bunker Hill, WV 25413
|
1,096 sq. feet
|
2 baths 3 beds |
show details |
| Photo | Address | Area | Beds / Baths | Price | Details |
|---|---|---|---|---|---|

|
#31
Ross St
Winchester, VA 22601
|
960 sq. feet
|
1 baths 2 beds |
show details | |

|
#32
Banbury Ter
Winchester, VA 22601
|
1,200 sq. feet
|
1 baths 3 beds |
show details | |

|
#33
Highview Rd
Stephenson, VA 22656
|
2,577 sq. feet
|
3 baths 3 beds |
show details | |

|
#34
Ford Cir
Inwood, WV 25428
|
1,421 sq. feet
|
2 baths 3 beds |
show details | |

|
#35
Lafayette Ln
Inwood, WV 25428
|
1,786 sq. feet
|
2 baths 3 beds |
show details | |

|
#36
Marlowe Dr
Inwood, WV 25428
|
1,154 sq. feet
|
2 baths 3 beds |
show details | |

|
#37
Snead Dr
Martinsburg, WV 25405
|
2,250 sq. feet
|
2 baths 3 beds |
show details | |

|
#38
Liberty St
Berryville, VA 22611
|
1,832 sq. feet
|
2 baths 3 beds |
show details | |

|
#39
Joline Dr
Clear Brook, VA 22624
|
2,533 sq. feet
|
2 baths 3 beds |
show details | |

|
#40
Riflemen Ln
Winchester, VA 22601
|
2,040 sq. feet
|
3 baths 4 beds |
show details |
| Photo | Address | Area | Beds / Baths | Price | Details |
|---|---|---|---|---|---|

|
#41
Woodys Pl
Winchester, VA 22602
|
2,184 sq. feet
|
2 baths 3 beds |
show details | |

|
#42
Oak Side Ln
Winchester, VA 22603
|
1,554 sq. feet
|
2 baths 3 beds |
show details | |

|
#43
Jewels Ct
Martinsburg, WV 25404
|
1,991 sq. feet
|
3 baths 3 beds |
show details | |

|
#44
Rossum Ln
Winchester, VA 22602
|
796 sq. feet
|
1 baths 2 beds |
show details | |

|
#45
Cherokee Dr
Inwood, WV 25428
|
1,236 sq. feet
|
2 baths 3 beds |
show details | |

|
#46
W John St
Martinsburg, WV 25401
|
1,680 sq. feet
|
1 baths 3 beds |
show details | |

|
#47
Hollida Ln
Martinsburg, WV 25404
|
1,992 sq. feet
|
2 baths 3 beds |
show details | |

|
#48
Ellis St
Martinsburg, WV 25404
|
- sq. feet
|
3 baths 3 beds |
show details | |

|
#49
Primrose Pl
Winchester, VA 22602
|
1,730 sq. feet
|
2 baths 3 beds |
show details | |

|
Check over 1 million property listings on Foreclosure.com!
|
browse all offers | |||

Household type by relationship:
Households: 52,107- In family households: 44,294 (10,128 male householders, 3,843 female householders)
10,948 spouses, 14,881 children (13,491 natural, 466 adopted, 924 stepchildren), 1,256 grandchildren, 391 brothers or sisters, 491 parents, foster children, 567 other relatives, 1,434 non-relatives
- In nonfamily households: 7,813 (3,017 male householders (2,166 living alone)), 2,943 female householders (2,368 living alone)), 1,853 nonrelatives
- In group quarters: 1,391 (218 institutionalized population)
6,914 married couples with children.
2,060 single-parent households (588 men, 1,472 women).
97.2% of residents of Kabletown district speak English at home.
1.2% of residents speak Spanish at home (57% speak English very well, 8% speak English well, 34% speak English not well).
1.2% of residents speak other Indo-European language at home (83% speak English very well, 10% speak English well, 7% speak English not well).
0.4% of residents speak Asian or Pacific Island language at home (76% speak English very well, 24% speak English well).
Foreign born population: 250 (2.5%)
(60.4% of them are naturalized citizens)
| Here: | 7.5 |
| State: | 6.5 |
| Here: | 5.0 |
| State: | 4.7 |
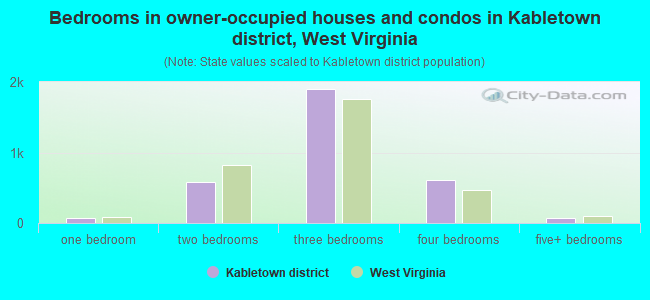
- Bedrooms in owner-occupied houses and condos in Kabletown district, West Virginia
- 0no bedroom
- 761 bedroom
- 5762 bedrooms
- 1,8943 bedrooms
- 6144 bedrooms
- 775+ bedrooms
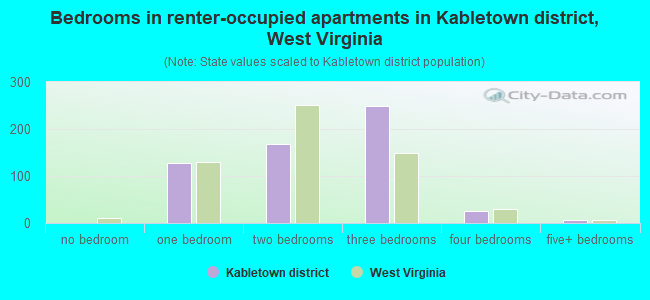
- Bedrooms in renter-occupied apartments in Kabletown district, West Virginia
- 0no bedroom
- 1271 bedroom
- 1682 bedrooms
- 2493 bedrooms
- 264 bedrooms
- 65+ bedrooms
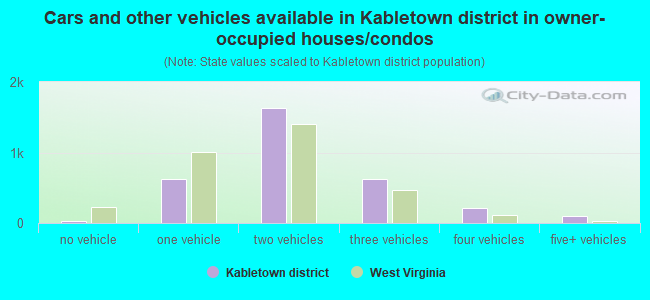
- Cars and other vehicles available in Kabletown district in owner-occupied houses/condos
- 33no vehicle
- 6241 vehicle
- 1,6302 vehicles
- 6313 vehicles
- 2174 vehicles
- 1025+ vehicles
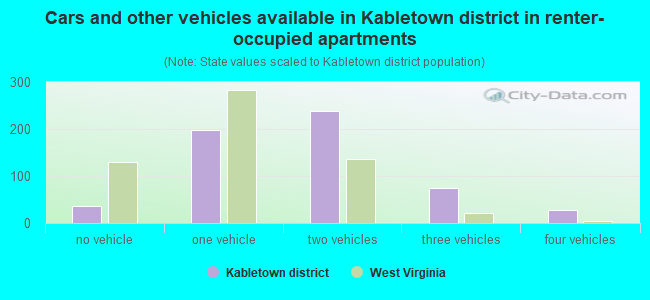
- Cars and other vehicles available in Kabletown district in renter-occupied apartments
- 37no vehicle
- 1981 vehicle
- 2392 vehicles
- 753 vehicles
- 274 vehicles
- 05+ vehicles
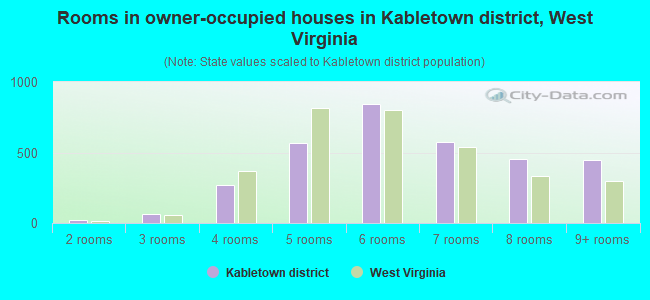
- Rooms in owner-occupied houses in Kabletown district, West Virginia
- 01 room
- 222 rooms
- 613 rooms
- 2724 rooms
- 5675 rooms
- 8446 rooms
- 5747 rooms
- 4518 rooms
- 4469+ rooms
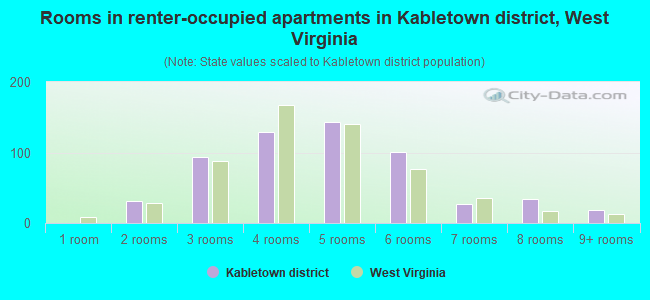
- Rooms in renter-occupied apartments in Kabletown district, West Virginia
- 01 room
- 312 rooms
- 933 rooms
- 1294 rooms
- 1435 rooms
- 1016 rooms
- 277 rooms
- 348 rooms
- 189+ rooms
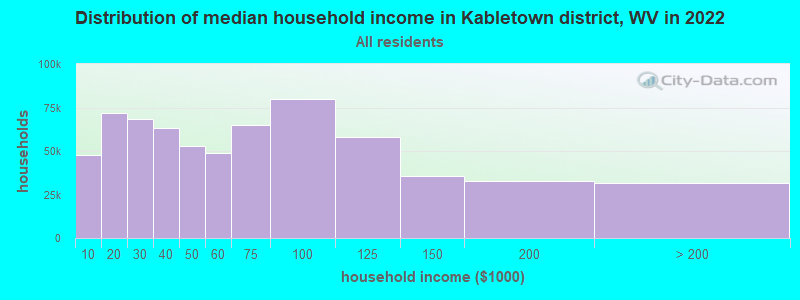
Kabletown district, WV household income distribution

- 44,843Less than $10,000
- 78,381$10,000 to $19,999
- 75,414$20,000 to $29,999
- 67,207$30,000 to $39,999
- 60,012$40,000 to $49,999
- 54,303$50,000 to $59,999
- 67,306$60,000 to $74,999
- 83,925$75,000 to $99,999
- 59,274$100,000 to $124,999
- 36,731$125,000 to $149,999
- 36,063$150,000 to $199,999
- 32,060$200,000 or more
Percentage of workers working in this county: 35.9%
Number of people working at home: 436 (8.3% of all workers)
Travel time to work (commute)
- Less than 5 minutes: 61
- 5 to 9 minutes: 240
- 10 to 14 minutes: 487
- 15 to 19 minutes: 546
- 20 to 24 minutes: 454
- 25 to 29 minutes: 229
- 30 to 34 minutes: 516
- 35 to 39 minutes: 187
- 40 to 44 minutes: 272
- 45 to 59 minutes: 627
- 60 to 89 minutes: 868
- 90 or more minutes: 576
Means of transportation to work:
- Drove a car alone: 4,053 (77.2%)
- Carpooled: 822 (15.7%)
- Bus or trolley bus: 13 (0.2%)
- Streetcar or trolley car: 9 (0.2%)
- Railroad: 90 (1.7%)
- Taxi: 11 (0.2%)
- Bicycle: 5 (0.1%)
- Walked: 60 (1.1%)
- Worked at home: 184 (3.5%)
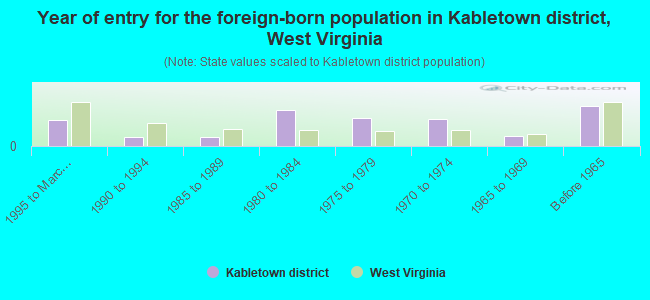
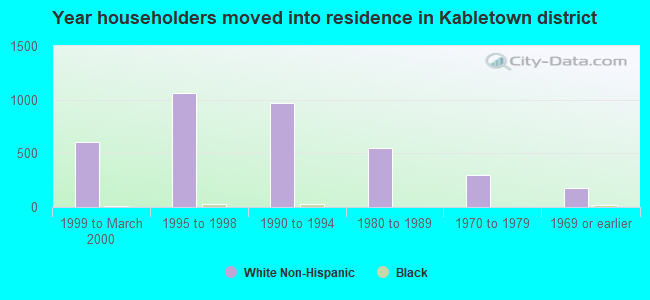
- Year of entry for the foreign-born population in Kabletown district, West Virginia
- 201995 to March 2000
- 71990 to 1994
- 71985 to 1989
- 281980 to 1984
- 221975 to 1979
- 211970 to 1974
- 81965 to 1969
- 31Before 1965
Most common places of birth for foreign-born residents (%):
| Kabletown district: | 22.9% (33) |
| West Virginia: | 6.9% (1,335) |
| Kabletown district: | 13.9% (20) |
| West Virginia: | 0.7% (143) |
| Kabletown district: | 9.7% (14) |
| West Virginia: | 7.9% (1,528) |
| Kabletown district: | 9.0% (13) |
| West Virginia: | 0.5% (94) |
| Kabletown district: | 8.3% (12) |
| West Virginia: | 4.4% (846) |
| Kabletown district: | 7.6% (11) |
| West Virginia: | 8.9% (1,728) |
| Kabletown district: | 6.2% (9) |
| West Virginia: | 1.0% (198) |
| Kabletown district: | 4.9% (7) |
| West Virginia: | 0.5% (105) |
| Kabletown district: | 4.9% (7) |
| West Virginia: | 1.0% (192) |
| Kabletown district: | 4.2% (6) |
| West Virginia: | 0.5% (106) |
| Kabletown district: | 4.2% (6) |
| West Virginia: | 0.9% (167) |
| Kabletown district: | 4.2% (6) |
| West Virginia: | 0.5% (91) |
Place of birth for U.S.-born residents:
- This state: 3,062
- Other state: 6,778
- Northeast: 1,108
- Midwest: 542
- South: 4,695
- West: 433
56% of Kabletown district residents lived in the same house 5 years ago.
Out of people who lived in different houses, 40% lived in this county.
Out of people who lived in different counties, 13% lived in West Virginia.
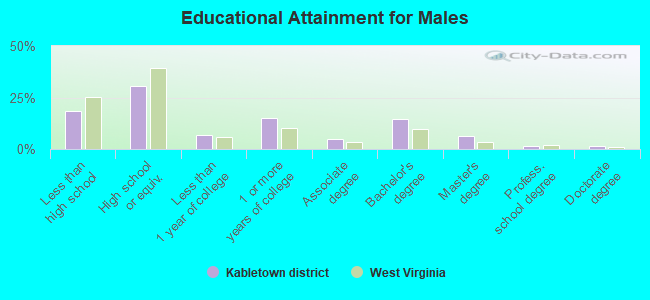
Education attainment for males 25 years and older:
- No schooling: 23
- Nursery to 4th grade: 10
- 5th and 6th grade: 48
- 7th and 8th grade: 92
- 9th grade: 132
- 10th grade: 94
- 11th grade: 85
- 12th grade, no diploma: 166
- High school graduate (or equivalency): 1,081
- Less than 1 year of college: 238
- Some college more than 1 year, no degree: 535
- Associate degree: 180
- Bachelor's degree: 525
- Master's degree: 227
- Professional school degree: 54
- Doctorate degree: 59
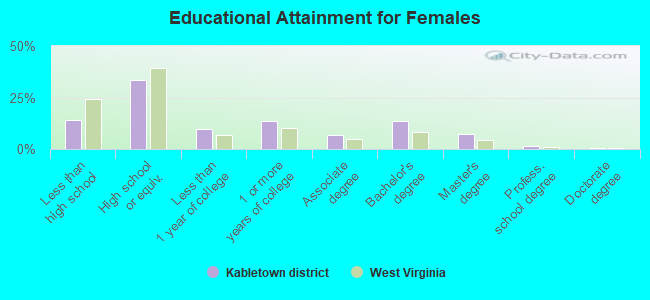
Education attainment for females 25 years and older:
- No schooling: 23
- Nursery to 4th grade: 0
- 5th and 6th grade: 12
- 7th and 8th grade: 100
- 9th grade: 24
- 10th grade: 79
- 11th grade: 76
- 12th grade, no diploma: 143
- High school graduate (or equivalency): 1,095
- Less than 1 year of college: 315
- Some college more than 1 year, no degree: 441
- Associate degree: 224
- Bachelor's degree: 445
- Master's degree: 242
- Professional school degree: 49
- Doctorate degree: 19


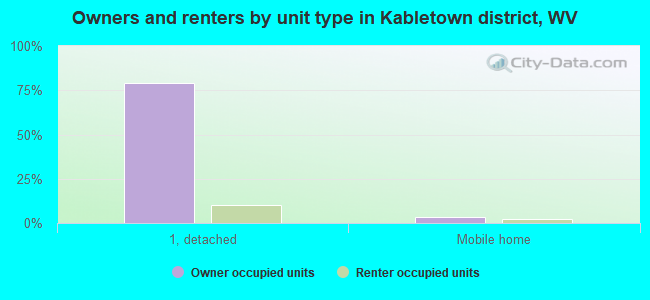
Housing units in structures:
- One, detached: 3,758
- One, attached: 148
- Two: 24
- 3 or 4: 14
- 5 to 9: 31
- 10 to 19: 14
- Mobile homes: 221
Median worth of mobile homes: $76,150
Housing units lacking complete kitchen facilities: 0.6%
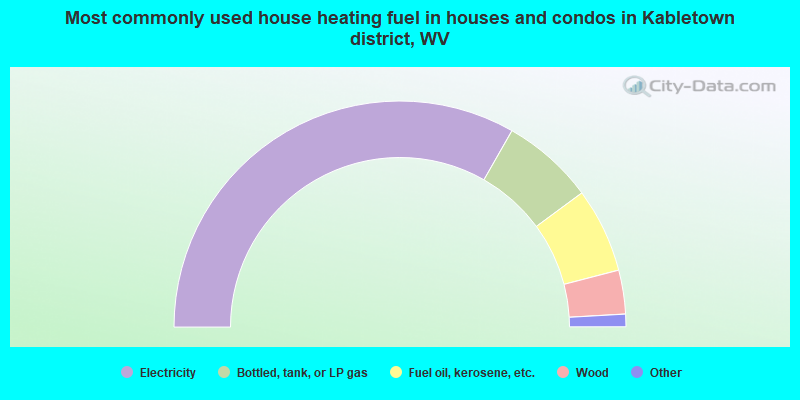
- 66.5%Electricity
- 13.3%Bottled, tank, or LP gas
- 12.1%Fuel oil, kerosene, etc.
- 6.3%Wood
- 0.8%Utility gas
- 0.6%Other fuel
- 0.2%Coal or coke
- 0.2%No fuel used
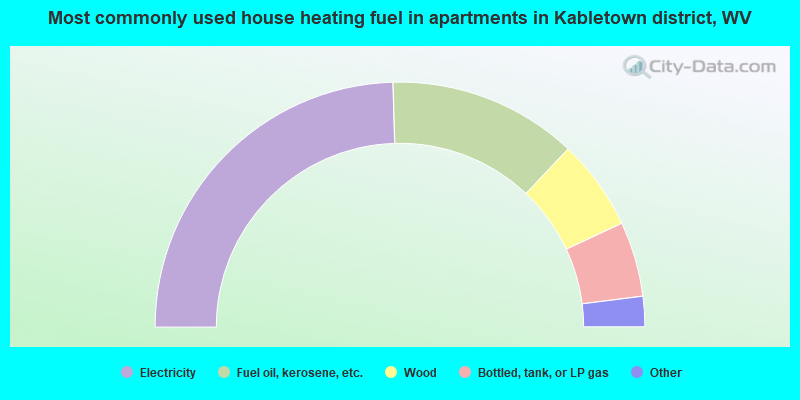
- 49.1%Electricity
- 25.0%Fuel oil, kerosene, etc.
- 12.0%Wood
- 9.9%Bottled, tank, or LP gas
- 3.0%Utility gas
- 1.0%Coal or coke
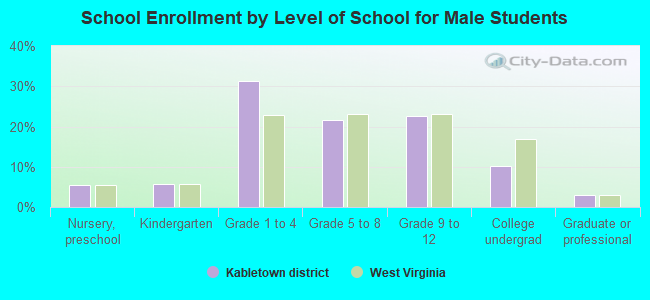
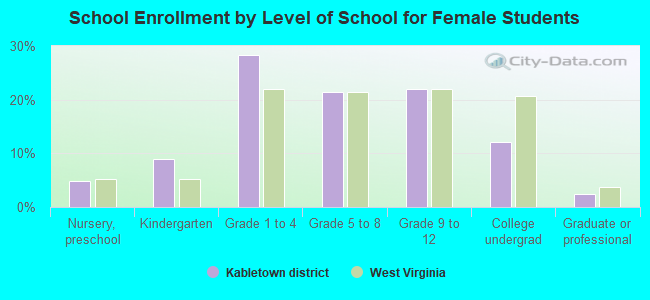
Private vs. public school enrollment:
| Here: | 8.2% |
| West Virginia: | 5.5% |
| Here: | 6.5% |
| West Virginia: | 4.8% |
| Here: | 14.3% |
| West Virginia: | 15.4% |