Killeen, TX (Texas) Houses and Residents
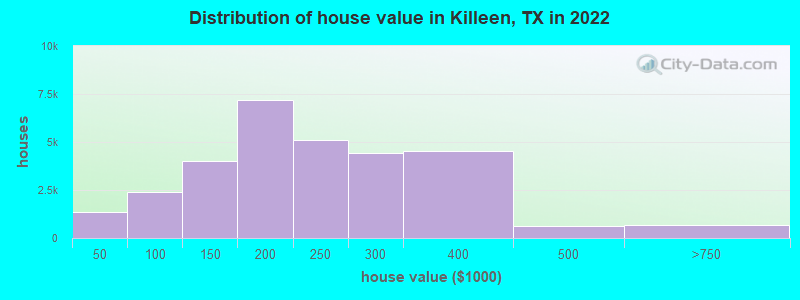
Estimated median house or condo value in 2022: $202,300 (it was $72,500 in 2000 )
Killeen:
$202,300Texas:
$275,400
Lower value quartile - upper value quartile: $147,200 - $280,300Mean price in 2022: Detached houses: $222,306 Here:
$222,306State:
$369,058
Townhouses or other attached units: $191,407 Here:
$191,407State:
$327,631
In 2-unit structures: $350,132 Here:
$350,132State:
$374,947
In 3-to-4-unit structures: $116,647 Here:
$116,647State:
$209,652
Mobile homes: $90,635 Here:
$90,635State:
$124,413
Occupied boats, RVs, vans, etc.: $76,959 Here:
$76,959State:
$73,921
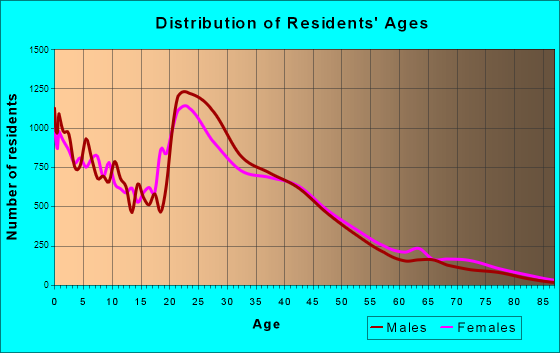
Total population: 138,154 (Urban population: 85,503, Rural population: 1,319 (31 farm, 1,288 nonfarm ))
Houses: 66,468 (60,903 occupied: 30,259 owner occupied, 30,644 renter occupied )
% of renters here:
50%State:
38%
Housing density: 1,880 houses/condos per square mile
Median price asked for vacant for-sale houses and condos in 2022: $138,703.
Median contract rent in 2022: $857 (lower quartile is $706, upper quartile is $1,171)
Median rent asked for vacant for-rent units in 2022: $831
Median gross rent in Killeen, TX in 2022: $1,095
Housing units in Killeen with a mortgage: 19,312 (295 second mortgage, 44 home equity loan, 270 both second mortgage and home equity loan )Houses without a mortgage: 90
Median household income for houses/condos with a mortgage: $83,832
Median household income for apartments without a mortgage: $61,940
Median monthly housing costs: $1,119
Data:
Median house or condo value ($)
Median house or condo value ($ change since 2000)
Median house or condo value ($) - White
Median house or condo value ($) - Black or African American
Median house or condo value ($) - Asian
Median house or condo value ($) - Hispanic or Latino
Median house or condo value ($) - American Indian and Alaska Native
Median house or condo value ($) - Multirace
Median house or condo value ($) - Other Race
Median price asked for mobile homes ($)
Household density (households per square mile)
Mean house or condo value by units in structure - 1, detached ($)
Mean house or condo value by units in structure - 1, attached ($)
Mean house or condo value by units in structure - 2 ($)
Mean house or condo value by units in structure by units in structure - 3 or 4 ($)
Mean house or condo value by units in structure - 5 or more ($)
Mean house or condo value by units in structure - Boat, RV, van, etc. ($)
Mean house or condo value by units in structure - Mobile home ($)
Median contract rent ($)
Median contract rent - Lower quartile ($)
Median contract rent - Upper quartile ($)
Median gross rent ($)
Urban houses (%)
Rural houses (%)
Houses occupied (%)
Houses occupied (% change since 2000)
Houses owner occupied (%)
Houses owner occupied (% change since 2000)
Houses renter occupied (%)
Houses renter occupied (% change since 2000)
Vacant housing units - For rent (%)
Vacant housing units - For rent (% change since 2000)
Vacant housing units - For sale only (%)
Vacant housing units - For sale only (% change since 2000)
Vacant housing units - Rented or sold, not occupied (%)
Vacant housing units - Rented or sold, not occupied (% change since 2000)
Vacant housing units - For seasonal, recreational, or occasional use (%)
Vacant housing units - For seasonal, recreational, or occasional use (% change since 2000)
Vacant housing units - For migrant workers (%)
Vacant housing units - For migrant workers (% change since 2000)
Vacant housing units - Other vacant (%)
Vacant housing units - Other vacant (% change since 2000)
Median monthly housing costs ($)
Median household income for houses/condos with a mortgage ($)
Median household income for houses/condos without a mortgage ($)
Median household income ($)
Median household income ($) - White
Median household income ($) - Black or African American
Median household income ($) - Asian
Median household income ($) - Hispanic or Latino
Median household income ($) - American Indian and Alaska Native
Median household income ($) - Multirace
Median household income ($) - Other Race
Mortgage status - with mortgage (%)
Mortgage status - with second mortgage (%)
Mortgage status - with home equity loan (%)
Mortgage status - with both second mortgage and home equity loan (%)
Mortgage status - without a mortgage (%)
Median year house/condo built
Median year apartment built
Household type by relationship - Male householder living alone (%)
Household type by relationship - Male householder not living alone (%)
Household type by relationship - Female householder living alone (%)
Household type by relationship - Female householder not living alone (%)
Household type by relationship - Opposite-Sex spouse (%)
Household type by relationship - Same-Sex spouse (%)
Household type by relationship - Opposite-Sex unmarried partner (%)
Household type by relationship - Same-Sex unmarried partner (%)
Household type by relationship - In group quarters (%)
Size of family households - 2-person household (%)
Size of family households - 3-person household (%)
Size of family households - 4-person household (%)
Size of family households - 5-person household (%)
Size of family households - 6-person household (%)
Size of family households - 7-or-more-person household (%)
Size of nonfamily households - 1-person household (%)
Size of nonfamily households - 2-person household (%)
Size of nonfamily households - 3-person household (%)
Size of nonfamily households - 4-person household (%)
Size of nonfamily households - 5-person household (%)
Size of nonfamily households - 6-person household (%)
Size of nonfamily households - 7-or-moreperson household (%)
Year house built - Built 2010 or later (%)
Year house built - Built 2000 to 2009 (%)
Year house built - Built 1990 to 1999 (%)
Year house built - Built 1980 to 1989 (%)
Year house built - Built 1970 to 1979 (%)
Year house built - Built 1960 to 1969 (%)
Year house built - Built 1950 to 1959 (%)
Year house built - Built 1940 to 1949 (%)
Year house built - Built 1939 or earlier (%)
Median number of rooms in houses and condos
Median number of rooms in apartments
Median number of bedrooms in owner occupied houses
Mean number of bedrooms in owner occupied houses
Median number of bedrooms in renter occupied houses
Mean number of bedrooms in renter occupied houses
Median number of vehichles in owner occupied houses
Mean number of vehichles in owner occupied houses
Median number of vehichles in renter occupied houses
Mean number of vehichles in renter occupied houses
Rooms in owner-occupied houses - 1 room (%)
Rooms in owner-occupied houses - 2 rooms (%)
Rooms in owner-occupied houses - 3 rooms (%)
Rooms in owner-occupied houses - 4 rooms (%)
Rooms in owner-occupied houses - 5 rooms (%)
Rooms in owner-occupied houses - 6 rooms (%)
Rooms in owner-occupied houses - 7 rooms (%)
Rooms in owner-occupied houses - 8 rooms (%)
Rooms in owner-occupied houses - 9+ rooms (%)
Rooms in renter-occupied houses - 1 room (%)
Rooms in renter-occupied houses - 2 rooms (%)
Rooms in renter-occupied houses - 3 rooms (%)
Rooms in renter-occupied houses - 4 rooms (%)
Rooms in renter-occupied houses - 5 rooms (%)
Rooms in renter-occupied houses - 6 rooms (%)
Rooms in renter-occupied houses - 7 rooms (%)
Rooms in renter-occupied houses - 8 rooms (%)
Rooms in renter-occupied houses - 9+ rooms (%)
Bedrooms in owner-occupied houses - no bedrooms (%)
Bedrooms in owner-occupied houses - 1 bedroom (%)
Bedrooms in owner-occupied houses - 2 bedrooms (%)
Bedrooms in owner-occupied houses - 3 bedrooms (%)
Bedrooms in owner-occupied houses - 4 bedrooms (%)
Bedrooms in owner-occupied houses - 5+ bedrooms (%)
Bedrooms in renter-occupied houses - no bedrooms (%)
Bedrooms in renter-occupied houses - 1 bedroom (%)
Bedrooms in renter-occupied houses - 2 bedrooms (%)
Bedrooms in renter-occupied houses - 3 bedrooms (%)
Bedrooms in renter-occupied houses - 4 bedrooms (%)
Bedrooms in renter-occupied houses - 5+ bedrooms (%)
Vehicles available in owner-occupied houses - no vehicle available (%)
Vehicles available in owner-occupied houses - 1 vehicle available(%)
Vehicles available in owner-occupied houses - 2 Vehicles available (%)
Vehicles available in owner-occupied houses - 3 Vehicles available (%)
Vehicles available in owner-occupied houses - 4 Vehicles available (%)
Vehicles available in owner-occupied houses - 5+ Vehicles available (%)
Vehicles available in renter-occupied houses - no vehicle available (%)
Vehicles available in renter-occupied houses - 1 vehicle available (%)
Vehicles available in renter-occupied houses - 2 Vehicles available (%)
Vehicles available in renter-occupied houses - 3 Vehicles available (%)
Vehicles available in renter-occupied houses - 4 Vehicles available (%)
Vehicles available in renter-occupied houses - 5+ Vehicles available (%)
Housing units in structures - 1, detached (%)
Housing units in structures - 1, attached (%)
Housing units in structures - 2 (%)
Housing units in structures - 3 or 4 (%)
Housing units in structures - 5 to 9 (%)
Housing units in structures - 10 to 19 (%)
Housing units in structures - 20 to 49 (%)
Housing units in structures - 50 or more (%)
Housing units in structures - Mobile home (%)
Housing units in structures - Boat, RV, van, etc. (%)
Housing units in structures - Owners - 1, detached (%)
Housing units in structures - Owners - 1, attached (%)
Housing units in structures - Owners - 2 (%)
Housing units in structures - Owners - 3 or 4 (%)
Housing units in structures - Owners - 5 to 9 (%)
Housing units in structures - Owners - 10 to 19 (%)
Housing units in structures - Owners - 20 to 49 (%)
Housing units in structures - Owners - 50 or more (%)
Housing units in structures - Owners - Mobile home (%)
Housing units in structures - Owners - Boat, RV, van, etc. (%)
Housing units in structures - Renters - 1, detached (%)
Housing units in structures - Renters - 1, attached (%)
Housing units in structures - Renters - 2 (%)
Housing units in structures - Renters - 3 or 4 (%)
Housing units in structures - Renters - 5 to 9 (%)
Housing units in structures - Renters - 10 to 19 (%)
Housing units in structures - Renters - 20 to 49 (%)
Housing units in structures - Renters - 50 or more (%)
Housing units in structures - Renters - Mobile home (%)
Housing units in structures - Renters - Boat, RV, van, etc. (%)
House/condo owner moved in on average (years ago)
Renter moved in on average (years ago)
Year householder moved into unit - Moved in 1999 to March 2000 (%)
Year householder moved into unit - Moved in 1999 to March 2000 (%) - White
Year householder moved into unit - Moved in 1999 to March 2000 (%) - Black or African American
Year householder moved into unit - Moved in 1999 to March 2000 (%) - Asian
Year householder moved into unit - Moved in 1999 to March 2000 (%) - Hispanic or Latino
Year householder moved into unit - Moved in 1999 to March 2000 (%) - American Indian and Alaska Native
Year householder moved into unit - Moved in 1999 to March 2000 (%) - Multirace
Year householder moved into unit - Moved in 1999 to March 2000 (%) - Other Race
Year householder moved into unit - Moved in 1995 to 1998 (%)
Year householder moved into unit - Moved in 1995 to 1998 (%) - White
Year householder moved into unit - Moved in 1995 to 1998 (%) - Black or African American
Year householder moved into unit - Moved in 1995 to 1998 (%) - Asian
Year householder moved into unit - Moved in 1995 to 1998 (%) - Hispanic or Latino
Year householder moved into unit - Moved in 1995 to 1998 (%) - American Indian and Alaska Native
Year householder moved into unit - Moved in 1995 to 1998 (%) - Multirace
Year householder moved into unit - Moved in 1995 to 1998 (%) - Other Race
Year householder moved into unit - Moved in 1990 to 1994 (%)
Year householder moved into unit - Moved in 1990 to 1994 (%) - White
Year householder moved into unit - Moved in 1990 to 1994 (%) - Black or African American
Year householder moved into unit - Moved in 1990 to 1994 (%) - Asian
Year householder moved into unit - Moved in 1990 to 1994 (%) - Hispanic or Latino
Year householder moved into unit - Moved in 1990 to 1994 (%) - American Indian and Alaska Native
Year householder moved into unit - Moved in 1990 to 1994 (%) - Multirace
Year householder moved into unit - Moved in 1990 to 1994 (%) - Other Race
Year householder moved into unit - Moved in 1980 to 1989 (%)
Year householder moved into unit - Moved in 1980 to 1989 (%) - White
Year householder moved into unit - Moved in 1980 to 1989 (%) - Black or African American
Year householder moved into unit - Moved in 1980 to 1989 (%) - Asian
Year householder moved into unit - Moved in 1980 to 1989 (%) - Hispanic or Latino
Year householder moved into unit - Moved in 1980 to 1989 (%) - American Indian and Alaska Native
Year householder moved into unit - Moved in 1980 to 1989 (%) - Multirace
Year householder moved into unit - Moved in 1980 to 1989 (%) - Other Race
Year householder moved into unit - Moved in 1970 to 1979 (%)
Year householder moved into unit - Moved in 1970 to 1979 (%) - White
Year householder moved into unit - Moved in 1970 to 1979 (%) - Black or African American
Year householder moved into unit - Moved in 1970 to 1979 (%) - Asian
Year householder moved into unit - Moved in 1970 to 1979 (%) - Hispanic or Latino
Year householder moved into unit - Moved in 1970 to 1979 (%) - American Indian and Alaska Native
Year householder moved into unit - Moved in 1970 to 1979 (%) - Multirace
Year householder moved into unit - Moved in 1970 to 1979 (%) - Other Race
Year householder moved into unit - Moved in 1969 or earlier (%)
Year householder moved into unit - Moved in 1969 or earlier (%) - White
Year householder moved into unit - Moved in 1969 or earlier (%) - Black or African American
Year householder moved into unit - Moved in 1969 or earlier (%) - Asian
Year householder moved into unit - Moved in 1969 or earlier (%) - Hispanic or Latino
Year householder moved into unit - Moved in 1969 or earlier (%) - American Indian and Alaska Native
Year householder moved into unit - Moved in 1969 or earlier (%) - Multirace
Year householder moved into unit - Moved in 1969 or earlier (%) - Other Race
Housing units lacking complete plumbing facilities (%)
Housing units lacking complete kitchen facilities (%)
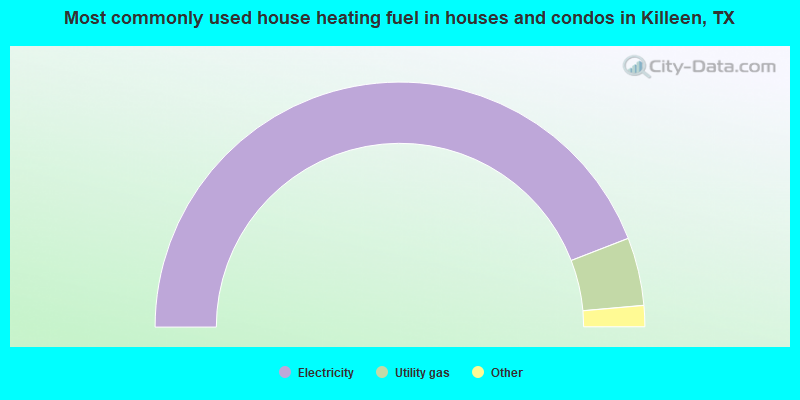
House heating fuel used in houses and condos - Utility gas (%)
House heating fuel used in houses and condos - Bottled, tank, or LP gas (%)
House heating fuel used in houses and condos - Electricity (%)
House heating fuel used in houses and condos - Fuel oil, kerosene, etc. (%)
House heating fuel used in houses and condos - Coal or coke (%)
House heating fuel used in houses and condos - Wood (%)
House heating fuel used in houses and condos - Solar energy (%)
House heating fuel used in houses and condos - Other fuel (%)
House heating fuel used in houses and condos - No fuel used (%)
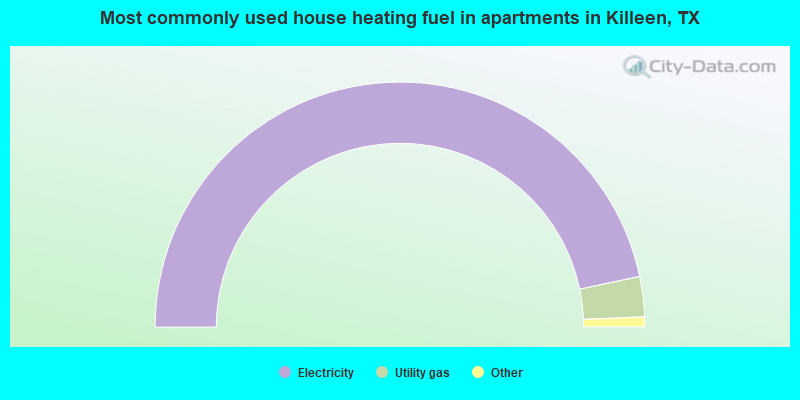
House heating fuel used in apartments - Utility gas (%)
House heating fuel used in apartments - Bottled, tank, or LP gas (%)
House heating fuel used in apartments - Electricity (%)
House heating fuel used in apartments - Fuel oil, kerosene, etc. (%)
House heating fuel used in apartments - Coal or coke (%)
House heating fuel used in apartments - Wood (%)
House heating fuel used in apartments - Solar energy (%)
House heating fuel used in apartments - Other fuel (%)
House heating fuel used in apartments - No fuel used (%)
Latest news about housing in Killeen, TX collected exclusively by city-data.com from local newspapers, TV, and radio stations
Median year house/condo built: 2002Median year apartment built: 1992Household type by relationship:
Households: 159,170
Male householders: 31,138 (10,646 living alone ), Female householders: 29,765 (8,245 living alone )24,188 spouses (23,846 opposite-sex spouses ), 2,211 unmarried partners , (2,118 opposite-sex unmarried partners ), 51,025 children (46,160 natural , 1,482 adopted , 3,383 stepchildren ), 7,517 grandchildren , 1,778 brothers or sisters , 1,881 parents , 0 foster children , 4,835 other relatives , 4,674 non-relatives In group quarters: 158
Size of family households: 14,483 2-persons , 10,799 3-persons , 7,650 4-persons , 3,889 5-persons , 1,373 6-persons , 606 7-or-more-persons .
Size of nonfamily households: 18,891 1-person , 2,745 2-persons , 309 3-persons , 98 4-persons , 60 6-persons .
23,610 married couples with children. single-parent households (1,798 men , 11,569 women ).
73.0% of residents of Killeen speak English at home. of residents speak Spanish at home (77% speak English very well , 16% speak English well , 6% speak English not well , 2% don't speak English at all ).of residents speak other Indo-European language at home (78% speak English very well , 15% speak English well , 7% speak English not well ).of residents speak Asian or Pacific Island language at home (68% speak English very well , 23% speak English well , 8% speak English not well , 1% don't speak English at all ).of residents speak other language at home (68% speak English very well , 29% speak English well , 3% speak English not well ).
Foreign born population: 14,879 (9.3%)of them are naturalized citizens )
Median number of rooms in houses and condos:
Median number of rooms in apartments
Owner-occupied Renter-occupied
Bedrooms in owner-occupied houses and condos in Killeen, Texas
130 no bedroom 201 1 bedroom 1,390 2 bedrooms 15,415 3 bedrooms 11,310 4 bedrooms 1,813 5+ bedrooms
Bedrooms in renter-occupied apartments in Killeen, Texas
442 no bedroom 3,646 1 bedroom 12,762 2 bedrooms 11,162 3 bedrooms 2,437 4 bedrooms 195 5+ bedrooms
Owner-occupied Renter-occupied
Rooms in owner-occupied houses in Killeen, Texas
130 1 room 201 2 rooms 270 3 rooms 3,987 4 rooms 8,062 5 rooms 7,080 6 rooms 3,954 7 rooms 3,567 8 rooms 3,008 9+ rooms
Rooms in renter-occupied apartments in Killeen, Texas
442 1 room 2,278 2 rooms 9,363 3 rooms 7,956 4 rooms 5,132 5 rooms 3,510 6 rooms 417 7 rooms 900 8 rooms 646 9+ rooms
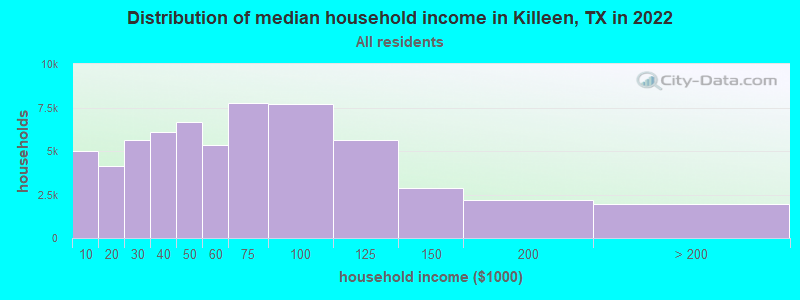
Killeen, TX household income distribution 5,012 Less than $10,0004,110 $10,000 to $19,9995,605 $20,000 to $29,9996,087 $30,000 to $39,9996,641 $40,000 to $49,9995,324 $50,000 to $59,9997,768 $60,000 to $74,9997,717 $75,000 to $99,9995,607 $100,000 to $124,9992,866 $125,000 to $149,9992,207 $150,000 to $199,9991,959 $200,000 or more
Home value of owner - occupied houses in 2022 in Killeen, TX 312 Less than $10,000223 $10,000 to $14,999271 $15,000 to $19,999328 $20,000 to $24,99981 $25,000 to $29,99940 $30,000 to $34,99979 $35,000 to $39,999217 $50,000 to $59,999609 $60,000 to $69,999254 $70,000 to $79,999643 $80,000 to $89,999667 $90,000 to $99,9992,539 $100,000 to $124,9991,465 $125,000 to $149,9993,540 $150,000 to $174,9993,626 $175,000 to $199,9995,125 $200,000 to $249,9994,418 $250,000 to $299,9994,521 $300,000 to $399,999640 $400,000 to $499,999661 $500,000 to $749,999Rent paid by renters in 2022 in Killeen, TX 98 $100 to $14970 $200 to $249135 $300 to $34967 $350 to $399466 $400 to $449611 $450 to $4991,381 $500 to $549991 $550 to $5991,872 $600 to $6491,471 $650 to $6992,781 $700 to $7492,461 $750 to $7994,500 $800 to $8992,163 $900 to $9994,936 $1,000 to $1,2493,374 $1,250 to $1,4992,387 $1,500 to $1,999166 $2,000 to $2,499714 No cash rent
Percentage of workers working in this county: 82.1%Number of people working at home: 6,590 (8.9% of all workers )
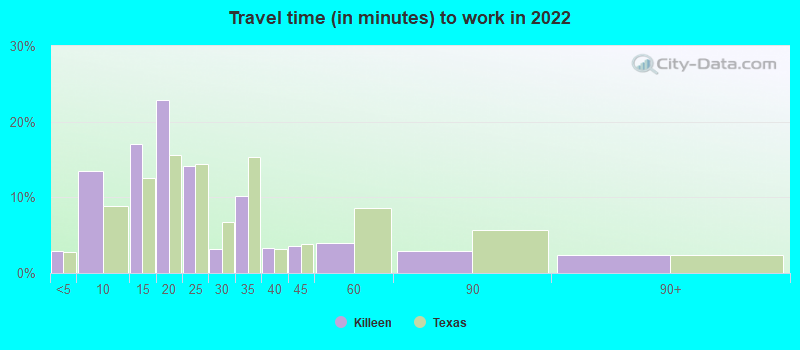
Travel time to work (commute)
Less than 5 minutes: 1,8405 to 9 minutes: 8,09210 to 14 minutes: 10,49215 to 19 minutes: 13,77520 to 24 minutes: 9,23425 to 29 minutes: 4,78330 to 34 minutes: 6,74635 to 39 minutes: 60740 to 44 minutes: 1,69745 to 59 minutes: 4,27560 to 89 minutes: 5,19290 or more minutes: 1,901
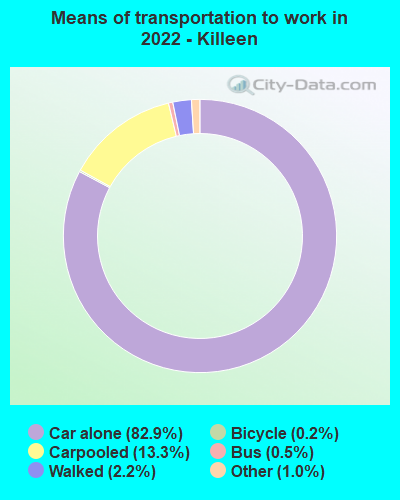
Means of transportation to work:
Drove a car alone: 32,595 (72.0%)Carpooled: 5,176 (11.4%)Bus : 97 (0.2%)Taxi: 568 (1.3%)Bicycle: 58 (0.1%)Walked: 692 (1.5%)Worked at home: 6,590 (14.6%)
Unemployment by race in 2022
Unemployment rate for White non-Hispanic residents 8.6% Males8.5% FemalesUnemployment rate for Black residents 9.9% Males8.4% FemalesUnemployment rate for American Indian and Alaska Native residents 14.8% Males1.5% FemalesUnemployment rate for Asian residents 10.8% Males4.4% FemalesUnemployment rate for other race residents 4.3% Males6.3% FemalesUnemployment rate for two or more race residents 4.3% Males6.6% FemalesUnemployment rate for Hispanic or Latino residents 12.2% Males4.0% Females
Year of entry for the foreign-born population in Killeen, Texas
5,046 2010 or later 4,788 2000 to 2009 1,784 1990 to 1999 2,196 1980 to 1989 1,983 1970 to 1979 1,607 Before 1970
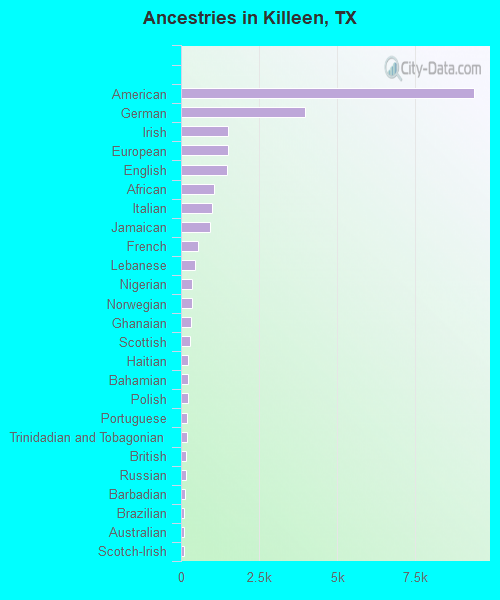
First ancestries reported:
American: 9,382 (9.6%)
German: 3,974 (4.1%)
Irish: 1,498 (1.5%)
European: 1,489 (1.5%)
English: 1,479 (1.5%)
African: 1,069 (1.1%)
Italian: 999 (1.0%)
Jamaican: 936 (1.0%)
French: 542 (0.6%)
Lebanese: 434 (0.4%)
Nigerian: 363 (0.4%)
Norwegian: 336 (0.3%)
Ghanaian: 332 (0.3%)
Scottish: 283 (0.3%)
Haitian: 236 (0.2%)
Bahamian: 228 (0.2%)
Polish: 217 (0.2%)
Portuguese: 198 (0.2%)
Trinidadian and Tobagonian: 190 (0.2%)
British: 165 (0.2%)
Russian: 152 (0.2%)
Barbadian: 122 (0.1%)
Brazilian: 106 (0.1%)
Australian: 102 (0.1%)
Scotch-Irish: 91 (0.09%)
Arab: 90 (0.09%)
British West Indian: 88 (0.09%)
French Canadian: 83 (0.09%)
Dutch: 69 (0.07%)
Belizean: 59 (0.06%)
Czech: 57 (0.06%)
Scandinavian: 56 (0.06%)
Swedish: 53 (0.05%)
Turkish: 52 (0.05%)
Welsh: 50 (0.05%)
Austrian: 38 (0.04%)
West Indian: 38 (0.04%)
Danish: 37 (0.04%)
Jordanian: 37 (0.04%)
Slovak: 33 (0.03%)
Swiss: 33 (0.03%)
Canadian: 30 (0.03%)
U.S. Virgin Islander: 28 (0.03%)
Armenian: 27 (0.03%)
Yugoslavian: 24 (0.02%)
Sierra Leonean: 19 (0.02%)
Czechoslovakian: 15 (0.02%)
Croatian: 15 (0.02%)
Romanian: 14 (0.01%)
Iraqi: 14 (0.01%)
Finnish: 13 (0.01%)
Eastern European: 10 (0.01%)
Liberian: 10 (0.01%)
Lithuanian: 10 (0.01%)
Kenyan: 8 (0.01%)
Northern European: 8 (0.01%)
Cajun: 7 (0.01%)
Most common places of birth for foreign-born residents (%): Mexico Killeen:
26.1% (3,907)Texas:
48.4% (2,411,723)
Korea Killeen:
9.3% (1,394)Texas:
1.2% (60,172)
Germany Killeen:
8.2% (1,223)Texas:
0.8% (37,989)
Philippines Killeen:
6.1% (916)Texas:
2.1% (103,148)
Vietnam Killeen:
4.8% (725)Texas:
3.7% (184,770)
Nepal Killeen:
4.5% (668)Texas:
0.6% (27,480)
Panama Killeen:
3.9% (578)Texas:
0.2% (9,838)
Dominican Republic Killeen:
2.6% (387)Texas:
0.3% (13,763)
Jamaica Killeen:
2.3% (346)Texas:
0.4% (17,748)
El Salvador Killeen:
2.3% (341)Texas:
4.5% (224,455)
Ghana Killeen:
1.7% (261)Texas:
0.3% (12,580)
Place of birth for U.S.-born residents:
This state: 61,663Other state: 65,319Northeast: 8,807Midwest: 10,723South: 30,411West: 15,378 75.0% of Killeen residents lived in the same house 1 years ago.
Out of people who lived in different houses, 33.7% lived in this county.
Out of people who lived in different counties, 41.1% lived in Texas.
Killeen:
75.0%State average:
85.7%
Education attainment for males 25 years and older:
No schooling: 355Nursery to 4th grade: 05th and 6th grade: 1357th and 8th grade: 09th grade: 98510th grade: 25111th grade: 50912th grade, no diploma: 908High school graduate (or equivalency): 12,551Less than 1 year of college: 4,444Some college more than 1 year, no degree: 10,707Associate degree: 5,054Bachelor's degree: 7,773Master's degree: 2,057Professional school degree: 123Doctorate degree: 246
Education attainment for females 25 years and older:
No schooling: 518Nursery to 4th grade: 1065th and 6th grade: 2667th and 8th grade: 1219th grade: 41610th grade: 41311th grade: 88812th grade, no diploma: 1,171High school graduate (or equivalency): 11,794Less than 1 year of college: 6,327Some college more than 1 year, no degree: 11,429Associate degree: 3,970Bachelor's degree: 8,596Master's degree: 3,567Professional school degree: 298Doctorate degree: 172
Housing units in structures:
One, detached: 40,915One, attached: 3,599Two: 3,7633 or 4: 6,0115 to 9: 2,30610 to 19: 5,11220 to 49: 1,08050 or more: 1,712Mobile homes: 1,734Boats, RVs, vans, etc.: 236Median worth of mobile homes: $16,359
Housing units lacking complete plumbing facilities in 2022: 0.9%Housing units lacking complete kitchen facilities in 2022: 2.0%House/condo owner moved in on average 6 years ago
Renter moved in on average 1 years ago
Private vs. public school enrollment:
Students in private schools in grades 1 to 8 (elementary and middle school): 1,443 Students in private schools in grades 9 to 12 (high school): 198 Students in private undergraduate colleges: 822