Housing density: 2,228 houses/condos per square mile
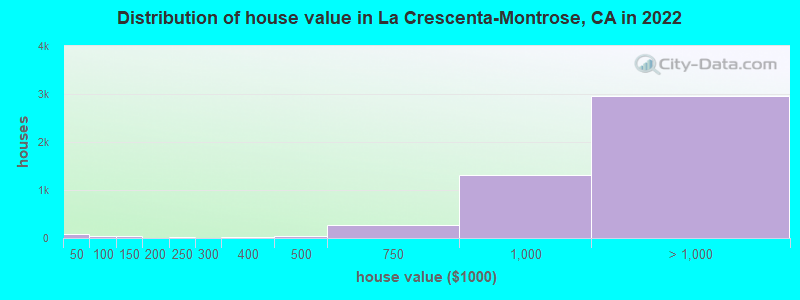
Median price asked for vacant for-sale houses and condos in 2022: $3,457,379.
Median contract rent in 2022: $1,961 (lower quartile is $1,402, upper quartile is over $2,000)
Median rent asked for vacant for-rent units in 2022: $30,198
Median gross rent in La Crescenta-Montrose, CA in 2022: over $2,000
Housing units in La Crescenta-Montrose with a mortgage: 2,953 (290 second mortgage, 81 home equity loan, 184 both second mortgage and home equity loan) Houses without a mortgage: 0
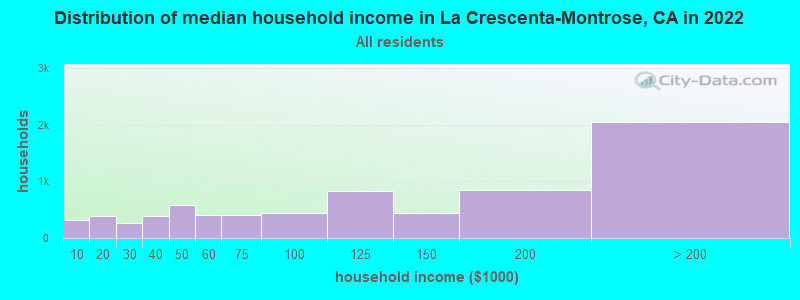
Median household income for houses/condos with a mortgage: $182,352
Median household income for apartments without a mortgage: $104,803
Median monthly housing costs: $2,329
Compare current foreclosures near La Crescenta-Montrose, CA:
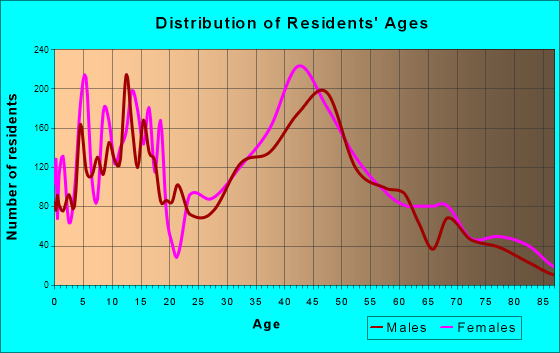
Size of family households: 1,686 2-persons, 1,206 3-persons, 1,431 4-persons, 310 5-persons, 234 6-persons, 90 7-or-more-persons.
Size of nonfamily households: 2,145 1-person, 237 2-persons, 17 3-persons.
3,790 married couples with children.
511 single-parent households (163 men, 348 women).
58.0% of residents of La Crescenta-Montrose speak English at home.
10.7% of residents speak Spanish at home (78% speak English very well, 18% speak English well, 3% speak English not well, 1% don't speak English at all).
11.1% of residents speak other Indo-European language at home (82% speak English very well, 10% speak English well, 7% speak English not well, 2% don't speak English at all).
19.8% of residents speak Asian or Pacific Island language at home (54% speak English very well, 25% speak English well, 19% speak English not well, 1% don't speak English at all).
0.8% of residents speak other language at home (69% speak English very well, 31% speak English well).
Foreign born population: 5,670 (28.8%)
(79.3% of them are naturalized citizens)
Percentage of workers working in this county: 96.7% Number of people working at home: 1,850 (19.9% of all workers)
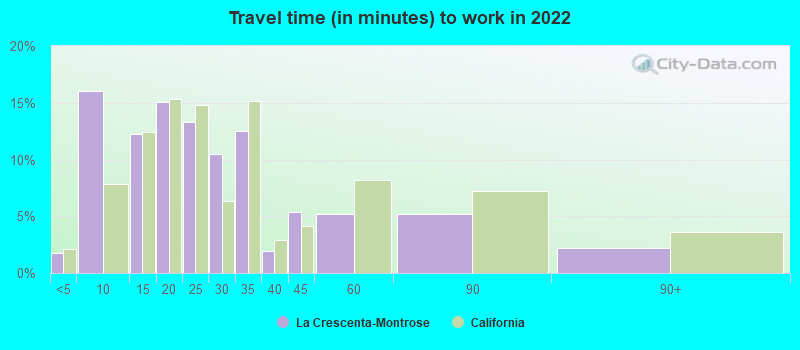
Travel time to work (commute)
Less than 5 minutes: 81
5 to 9 minutes: 476
10 to 14 minutes: 733
15 to 19 minutes: 660
20 to 24 minutes: 1,132
25 to 29 minutes: 400
30 to 34 minutes: 1,482
35 to 39 minutes: 190
40 to 44 minutes: 461
45 to 59 minutes: 946
60 to 89 minutes: 688
90 or more minutes: 253
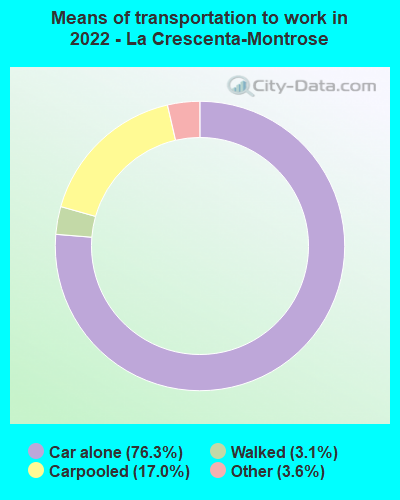
Means of transportation to work:
Drove a car alone: 2,103 (48.5%)
Carpooled: 518 (11.9%)
Taxi: 108 (2.5%)
Walked: 91 (2.1%)
Worked at home: 1,850 (42.6%)
Unemployment by race in 2022
Unemployment rate for White non-Hispanic residents
7.8%Males
5.9%Females
Unemployment rate for Black residents
100.0%Males
Unemployment rate for American Indian and Alaska Native residents
46.4%Males
Unemployment rate for Asian residents
9.9%Males
2.2%Females
Unemployment rate for other race residents
14.0%Males
11.9%Females
Unemployment rate for two or more race residents
1.2%Males
4.0%Females
Unemployment rate for Hispanic or Latino residents
6.3%Males
2.9%Females
Year of entry for the foreign-born population in La Crescenta-Montrose, California
8212010 or later
9582000 to 2009
1,4621990 to 1999
1,9251980 to 1989
1,1141970 to 1979
520Before 1970
First ancestries reported:
Armenian: 1,270 (12.5%)
English: 515 (5.1%)
Irish: 481 (4.7%)
German: 388 (3.8%)
Iranian: 215 (2.1%)
American: 207 (2.0%)
Romanian: 181 (1.8%)
Italian: 164 (1.6%)
Scottish: 113 (1.1%)
European: 83 (0.8%)
British: 79 (0.8%)
Egyptian: 69 (0.7%)
Swedish: 56 (0.6%)
Lebanese: 47 (0.5%)
Palestinian: 47 (0.5%)
Bulgarian: 40 (0.4%)
Brazilian: 30 (0.3%)
Canadian: 27 (0.3%)
Norwegian: 26 (0.3%)
Dutch: 20 (0.2%)
Northern European: 20 (0.2%)
Portuguese: 15 (0.1%)
Basque: 14 (0.1%)
Russian: 11 (0.1%)
African: 11 (0.1%)
Eastern European: 7 (0.07%)
Polish: 7 (0.07%)
Scandinavian: 7 (0.07%)
Kenyan: 7 (0.07%)
Most common places of birth for foreign-born residents (%):
Korea
La Crescenta-Montrose:
35.4% (2,010)
California:
3.0% (315,248)
Mexico
La Crescenta-Montrose:
9.4% (534)
California:
37.2% (3,881,193)
Iran
La Crescenta-Montrose:
8.7% (496)
California:
2.0% (206,004)
Philippines
La Crescenta-Montrose:
5.6% (318)
California:
7.8% (818,297)
Armenia
La Crescenta-Montrose:
4.6% (262)
California:
0.8% (78,847)
Bangladesh
La Crescenta-Montrose:
3.0% (172)
California:
0.2% (18,366)
United Kingdom, excluding England and Scotland
La Crescenta-Montrose:
2.8% (157)
California:
0.6% (60,582)
Lebanon
La Crescenta-Montrose:
2.7% (152)
California:
0.3% (31,757)
Japan
La Crescenta-Montrose:
2.4% (137)
California:
1.0% (103,575)
China, excluding Hong Kong and Taiwan
La Crescenta-Montrose:
2.3% (128)
California:
6.6% (684,672)
Canada
La Crescenta-Montrose:
2.0% (115)
California:
1.2% (127,477)
Vietnam
La Crescenta-Montrose:
1.9% (108)
California:
4.9% (512,335)
India
La Crescenta-Montrose:
1.8% (103)
California:
5.2% (539,184)
Australia
La Crescenta-Montrose:
1.8% (100)
California:
0.2% (23,338)
Romania
La Crescenta-Montrose:
1.7% (96)
California:
0.2% (23,058)
Egypt
La Crescenta-Montrose:
1.6% (92)
California:
0.4% (42,718)
Place of birth for U.S.-born residents:
This state: 10,960
Other state: 2,665
Northeast: 874
Midwest: 884
South: 494
West: 404
90.4% of La Crescenta-Montrose residents lived in the same house 1 years ago. Out of people who lived in different houses, 44.7% lived in this county. Out of people who lived in different counties, 19.8% lived in California.
La Crescenta-Montrose:
90.4%
State average:
88.9%
Education attainment for males 25 years and older:
No schooling: 159
Nursery to 4th grade: 18
5th and 6th grade: 0
7th and 8th grade: 16
9th grade: 7
10th grade: 36
11th grade: 41
12th grade, no diploma: 127
High school graduate (or equivalency): 1,004
Less than 1 year of college: 207
Some college more than 1 year, no degree: 855
Associate degree: 334
Bachelor's degree: 2,104
Master's degree: 764
Professional school degree: 285
Doctorate degree: 295
Education attainment for females 25 years and older:
No schooling: 53
Nursery to 4th grade: 34
5th and 6th grade: 42
7th and 8th grade: 6
9th grade: 31
10th grade: 22
11th grade: 75
12th grade, no diploma: 81
High school graduate (or equivalency): 1,369
Less than 1 year of college: 339
Some college more than 1 year, no degree: 793
Associate degree: 763
Bachelor's degree: 2,195
Master's degree: 1,285
Professional school degree: 473
Doctorate degree: 174
Housing units in structures:
One, detached: 5,496
One, attached: 508
Two: 97
3 or 4: 376
5 to 9: 219
10 to 19: 406
20 to 49: 279
50 or more: 160
Mobile homes: 91
Housing units lacking complete plumbing facilities in 2022: 0.6%
Housing units lacking complete kitchen facilities in 2022: 2.9%
House/condo owner moved in on average 17 years ago