Lake Bridgeport, TX (Texas) Houses and Residents
| Lake Bridgeport: | $274,184 |
| Texas: | $275,400 |
Mean price in 2022:
Detached houses: $357,966
Here: $357,966 State: $369,058 Mobile homes: $56,409
Here: $56,409 State: $124,413
Total population: 354 (Urban population: 0, Rural population: 360 (all nonfarm))
Houses: 210 (146 occupied: 93 owner occupied, 57 renter occupied)
| % of renters here: | 38% |
| State: | 38% |
Housing density: 443 houses/condos per square mile
Median price asked for vacant for-sale houses and condos in 2022: $508,028.
Median contract rent in 2022: $1,053 (lower quartile is $691, upper quartile is $1,070)
Median rent asked for vacant for-rent units in 2022: $1,466
Median gross rent in Lake Bridgeport, TX in 2022: $1,326
Housing units in Lake Bridgeport with a mortgage: 42 (0 second mortgage, 0 home equity loan, 0 both second mortgage and home equity loan)
Houses without a mortgage: 1
Median household income for houses/condos with a mortgage: $153,264
Median household income for apartments without a mortgage: $59,083
Median monthly housing costs: $1,208
Compare current foreclosures near Lake Bridgeport, TX:
| Photo | Address | Area | Beds / Baths | Price | Details |
|---|---|---|---|---|---|

|
#1
N Colorado St
Decatur, TX 76234
|
1,168 sq. feet
|
1 baths 3 beds |
show details | |

|
#2
Oakridge Trl
Bridgeport, TX 76426
|
3,116 sq. feet
|
2 baths 3 beds |
show details | |

|
#3
N Trappier St
Alvord, TX 76225
|
- sq. feet
|
1 baths 2 beds |
show details | |

|
#4
West Hwy 199
Springtown, TX 76082
|
- sq. feet
|
3 baths 3 beds |
show details | |

|
#5
Us Highway 287 Access Rd N
Sunset, TX 76270
|
- sq. feet
|
- baths - beds |
show details | |

|
#6
W Fm 455
Decatur, TX 76234
|
- sq. feet
|
- baths - beds |
show details | |

|
#7
Private Road 1176
Alvord, TX 76225
|
- sq. feet
|
- baths - beds |
show details | |

|
#8
Deer Creek Dr
Alvord, TX 76225
|
1,849 sq. feet
|
- baths - beds |
show details | |

|
#9
Fortenberry Rd
Decatur, TX 76234
|
2,304 sq. feet
|
- baths - beds |
show details | |

|
#10
Decatur St
Alvord, TX 76225
|
1,360 sq. feet
|
- baths - beds |
show details |
| Photo | Address | Area | Beds / Baths | Price | Details |
|---|---|---|---|---|---|

|
#11
Allison Rd
Springtown, TX 76082
|
1,400 sq. feet
|
- baths - beds |
show details | |

|
#12
Ridge View Ct
Decatur, TX 76234
|
1,424 sq. feet
|
- baths - beds |
show details | |

|
#13
Old Decatur Rd
Decatur, TX 76234
|
- sq. feet
|
- baths - beds |
show details | |

|
#14
Agnes N
Springtown, TX 76082
|
2,010 sq. feet
|
- baths - beds |
show details | |

|
#15
County Road 4223
Decatur, TX 76234
|
- sq. feet
|
- baths - beds |
show details | |

|
#16
S Hill St
Decatur, TX 76234
|
1,522 sq. feet
|
- baths - beds |
show details | |

|
#17
Meadow Pond Ct
Bridgeport, TX 76426
|
1,726 sq. feet
|
- baths - beds |
show details | |

|
#18
County Road 3597
Boyd, TX 76023
|
- sq. feet
|
- baths - beds |
show details | |

|
#19
County Road 3699
Springtown, TX 76082
|
1,770 sq. feet
|
- baths - beds |
show details | |

|
#20
Silver Lakes Dr
Sunset, TX 76270
|
- sq. feet
|
- baths - beds |
show details |
| Photo | Address | Area | Beds / Baths | Price | Details |
|---|---|---|---|---|---|

|
#21
Agnes N
Springtown, TX 76082
|
1,120 sq. feet
|
- baths - beds |
show details | |

|
#22
Jordan Rd
Poolville, TX 76487
|
- sq. feet
|
- baths - beds |
show details | |

|
#23
Mccrae Ln
Boyd, TX 76023
|
- sq. feet
|
- baths - beds |
show details | |

|
#24
Foxtrot Ct
Alvord, TX 76225
|
- sq. feet
|
- baths - beds |
show details | |

|
#25
N Main St
Bridgeport, TX 76426
|
- sq. feet
|
- baths - beds |
show details | |

|
#26
County Road 3657
Springtown, TX 76082
|
- sq. feet
|
- baths - beds |
show details | |

|
#27
County Road 1180
Decatur, TX 76234
|
- sq. feet
|
- baths - beds |
show details | |

|
#28
Gordon Cir
Bridgeport, TX 76426
|
- sq. feet
|
- baths - beds |
show details | |

|
#29
Cobb St
Bridgeport, TX 76426
|
- sq. feet
|
- baths - beds |
show details | |

|
#30
Private Road 3337
Bridgeport, TX 76426
|
672 sq. feet
|
- baths - beds |
show details |
| Photo | Address | Area | Beds / Baths | Price | Details |
|---|---|---|---|---|---|

|
#31
Hovey St
Bridgeport, TX 76426
|
1,579 sq. feet
|
- baths - beds |
show details | |

|
#32
Cates St
Bridgeport, TX 76426
|
- sq. feet
|
- baths - beds |
show details | |

|
#33
County Road 3336
Bridgeport, TX 76426
|
- sq. feet
|
- baths - beds |
show details | |

|
#34
County Road 1635
Chico, TX 76431
|
- sq. feet
|
- baths - beds |
show details | |

|
#35
Alvord St Apt 102
Chico, TX 76431
|
- sq. feet
|
- baths - beds |
show details | |

|
#36
Hunter Trl
Bridgeport, TX 76426
|
- sq. feet
|
- baths - beds |
show details | |

|
#37
Private Road 1322
Bridgeport, TX 76426
|
- sq. feet
|
- baths - beds |
show details | |

|
#38
County Road 1557
Chico, TX 76431
|
2,192 sq. feet
|
- baths - beds |
show details | |

|
#39
County Road 3341
Paradise, TX 76073
|
1,836 sq. feet
|
- baths - beds |
show details | |

|
#40
County Road 1348
Chico, TX 76431
|
2,101 sq. feet
|
- baths - beds |
show details |
| Photo | Address | Area | Beds / Baths | Price | Details |
|---|---|---|---|---|---|

|
#41
W Highway 114
Paradise, TX 76073
|
2,424 sq. feet
|
- baths - beds |
show details | |

|
#42
County Road 3655
Paradise, TX 76073
|
1,444 sq. feet
|
- baths - beds |
show details | |

|
#43
County Road 1667
Chico, TX 76431
|
- sq. feet
|
- baths - beds |
show details | |

|
#44
County Road 3470
Paradise, TX 76073
|
1,898 sq. feet
|
- baths - beds |
show details | |

|
#45
County Road 3673
Paradise, TX 76073
|
1,929 sq. feet
|
- baths - beds |
show details | |

|
#46
Private Road 3870
Poolville, TX 76487
|
- sq. feet
|
- baths - beds |
show details | |

|
#47
Us Highway 380
Decatur, TX 76234
|
- sq. feet
|
- baths - beds |
show details | |

|
#48
Poolville Cut Off Rd
Poolville, TX 76487
|
- sq. feet
|
- baths - beds |
show details | |

|
#49
Valley Ridge Dr
Bridgeport, TX 76426
|
- sq. feet
|
- baths - beds |
show details | |

|
Check over 1 million property listings on Foreclosure.com!
|
browse all offers | |||


 | Very well off Colleyville family looking for beachhouse (15 replies) |
| Looking For Home / Property NW Ft. Worth (11 replies) |
| Requesting Decatur, TX information (20 replies) |
| Commuting Distance to DFW (airport) (21 replies) |
| Moving to Ft. Worth Area (15 replies) |

Median year apartment built: 1982
Household type by relationship:
Households: 373- Male householders: 81 (21 living alone), Female householders: 71 (10 living alone)
82 spouses (82 opposite-sex spouses), 28 unmarried partners, (28 opposite-sex unmarried partners), 91 children (84 natural, 2 adopted, 5 stepchildren), 10 grandchildren, 0 brothers or sisters, 0 parents, 0 foster children, 4 other relatives, 2 non-relatives
Size of family households: 46 2-persons, 44 3-persons, 12 4-persons, 4 5-persons.
Size of nonfamily households: 33 1-person, 16 2-persons.
22 married couples with children.
15 single-parent households (2 men, 13 women).
98.3% of residents of Lake Bridgeport speak English at home.
1.1% of residents speak Spanish at home (50% speak English very well, 50% speak English well).
0.6% of residents speak other Indo-European language at home (100% speak English well).
Foreign born population: 4 (1.1%)
(50.0% of them are naturalized citizens)
| Here: | 6.3 |
| State: | 6.3 |
| Here: | 4.2 |
| State: | 4.0 |

- Bedrooms in owner-occupied houses and condos in Lake Bridgeport, Texas
- 0no bedroom
- 41 bedroom
- 152 bedrooms
- 553 bedrooms
- 204 bedrooms
- 05+ bedrooms

- Bedrooms in renter-occupied apartments in Lake Bridgeport, Texas
- 0no bedroom
- 41 bedroom
- 192 bedrooms
- 343 bedrooms
- 04 bedrooms
- 05+ bedrooms

- Cars and other vehicles available in Lake Bridgeport in owner-occupied houses/condos
- 0no vehicle
- 151 vehicle
- 372 vehicles
- 263 vehicles
- 124 vehicles
- 45+ vehicles

- Cars and other vehicles available in Lake Bridgeport in renter-occupied apartments
- 4no vehicle
- 71 vehicle
- 332 vehicles
- 113 vehicles
- 04 vehicles
- 25+ vehicles

- Rooms in owner-occupied houses in Lake Bridgeport, Texas
- 01 room
- 32 rooms
- 23 rooms
- 104 rooms
- 165 rooms
- 236 rooms
- 257 rooms
- 48 rooms
- 119+ rooms

- Rooms in renter-occupied apartments in Lake Bridgeport, Texas
- 01 room
- 02 rooms
- 63 rooms
- 244 rooms
- 165 rooms
- 36 rooms
- 27 rooms
- 58 rooms
- 09+ rooms


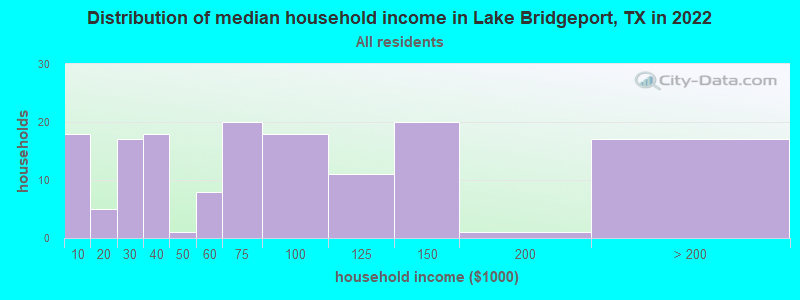
Lake Bridgeport, TX household income distribution

- 18Less than $10,000
- 5$10,000 to $19,999
- 17$20,000 to $29,999
- 18$30,000 to $39,999
- 1$40,000 to $49,999
- 8$50,000 to $59,999
- 20$60,000 to $74,999
- 18$75,000 to $99,999
- 11$100,000 to $124,999
- 20$125,000 to $149,999
- 1$150,000 to $199,999
- 17$200,000 or more
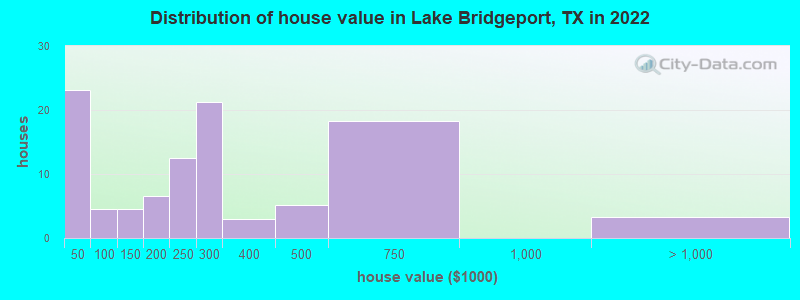
Home value of owner - occupied houses in 2022 in Lake Bridgeport, TX
-
- 2Less than $10,000
- 2$15,000 to $19,999
- 7$25,000 to $29,999
- 7$30,000 to $34,999
- 2$35,000 to $39,999
- 0$50,000 to $59,999
- 0$60,000 to $69,999
- 3$70,000 to $79,999
- 4$100,000 to $124,999
- 5$150,000 to $174,999
- 1$175,000 to $199,999
- 12$200,000 to $249,999
- 21$250,000 to $299,999
- 2$300,000 to $399,999
- 5$400,000 to $499,999
- 18$500,000 to $749,999
- 3$1,000,000 to $1,499,999
Rent paid by renters in 2022 in Lake Bridgeport, TX
-
- 4$400 to $449
- 2$450 to $499
- 2$500 to $549
- 1$550 to $599
- 5$650 to $699
- 2$750 to $799
- 3$800 to $899
- 12$900 to $999
- 17$1,000 to $1,249
- 1$1,500 to $1,999
- 1No cash rent


Percentage of workers working in this county: 72.3%
Number of people working at home: 15 (7.6% of all workers)
Travel time to work (commute)
- Less than 5 minutes: 0
- 5 to 9 minutes: 10
- 10 to 14 minutes: 33
- 15 to 19 minutes: 45
- 20 to 24 minutes: 18
- 25 to 29 minutes: 17
- 30 to 34 minutes: 4
- 35 to 39 minutes: 9
- 40 to 44 minutes: 2
- 45 to 59 minutes: 16
- 60 to 89 minutes: 34
- 90 or more minutes: 6
Means of transportation to work:
- Drove a car alone: 124 (72.1%)
- Carpooled: 32 (18.6%)
- Bicycle: 5 (2.9%)
- Worked at home: 11 (6.4%)

- Unemployment by race in 2022
- Unemployment rate for other race residents
- 100.0%Males

- Year of entry for the foreign-born population in Lake Bridgeport, Texas
- 02010 or later
- 02000 to 2009
- 21990 to 1999
- 01980 to 1989
- 41970 to 1979
- 6Before 1970

First ancestries reported:
- American: 30 (21.7%)
- English: 24 (17.4%)
- German: 19 (13.8%)
- Irish: 14 (10.1%)
- European: 2 (1.4%)
- Welsh: 2 (1.4%)
- Eastern European: 1 (0.7%)
- Polish: 1 (0.7%)
Most common places of birth for foreign-born residents (%):
| Lake Bridgeport: | 50.0% (2) |
| Texas: | 1.1% (55,371) |
| Lake Bridgeport: | 25.0% (1) |
| Texas: | 0.4% (21,746) |
Place of birth for U.S.-born residents:
- This state: 302
- Other state: 57
- Northeast: 6
- Midwest: 14
- South: 11
- West: 25
93.5% of Lake Bridgeport residents lived in the same house 1 years ago.
Out of people who lived in different houses, 38.9% lived in this county.
Out of people who lived in different counties, 87.5% lived in Texas.
| Lake Bridgeport: | 93.5% |
| State average: | 85.7% |
Education attainment for males 25 years and older:
- No schooling: 0
- Nursery to 4th grade: 0
- 5th and 6th grade: 0
- 7th and 8th grade: 4
- 9th grade: 2
- 10th grade: 2
- 11th grade: 4
- 12th grade, no diploma: 0
- High school graduate (or equivalency): 61
- Less than 1 year of college: 3
- Some college more than 1 year, no degree: 10
- Associate degree: 10
- Bachelor's degree: 14
- Master's degree: 6
- Professional school degree: 14
- Doctorate degree: 0

Education attainment for females 25 years and older:
- No schooling: 2
- Nursery to 4th grade: 0
- 5th and 6th grade: 0
- 7th and 8th grade: 0
- 9th grade: 0
- 10th grade: 1
- 11th grade: 4
- 12th grade, no diploma: 0
- High school graduate (or equivalency): 54
- Less than 1 year of college: 10
- Some college more than 1 year, no degree: 15
- Associate degree: 15
- Bachelor's degree: 24
- Master's degree: 5
- Professional school degree: 0
- Doctorate degree: 0


Housing units in structures:
- One, detached: 161
- Two: 12
- Mobile homes: 39
Housing units lacking complete kitchen facilities in 2022: 2.4%
House/condo owner moved in on average 11 years ago
Renter moved in on average 1 years ago

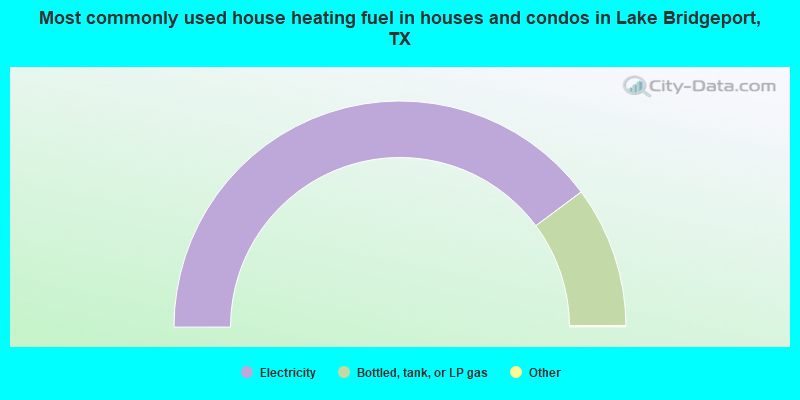
- 79.8%Electricity
- 20.2%Bottled, tank, or LP gas
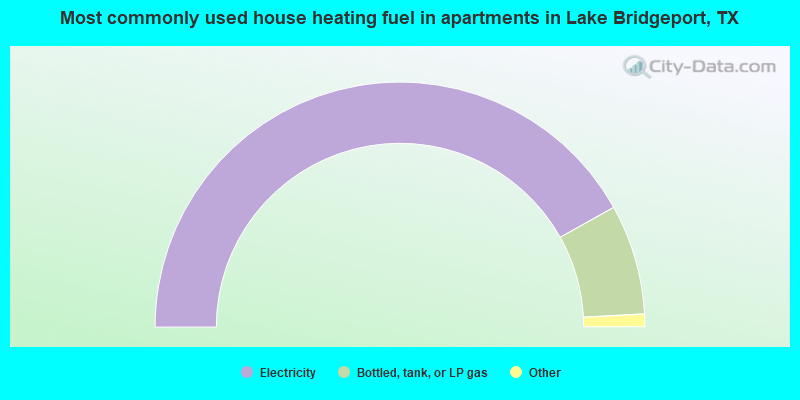
- 85.2%Electricity
- 14.8%Bottled, tank, or LP gas
Private vs. public school enrollment:
| Here: | 32.1% |
| Texas: | 8.8% |
| Here: | 33.3% |
| Texas: | 8.0% |
| Here: | 0.0% |
| Texas: | 16.2% |


