Lansing, IL (Illinois) Houses and Residents
Estimated median house or condo value in 2022: $162,450 (it was $115,600 in 2000 )
Lansing:
$162,450Illinois:
$251,600
Lower value quartile - upper value quartile: $123,816 - $196,392Total population: 28,522 (Urban population: 28,161, Rural population: 0)
Houses: 12,178 (11,226 occupied: 8,147 owner occupied, 3,270 renter occupied )
% of renters here:
29%State:
33%
Housing density: 1,800 houses/condos per square mile
Median price asked for vacant for-sale houses and condos in 2022: $57,919.
Median contract rent in 2022: $1,066 (lower quartile is $883, upper quartile is $1,347)
Median rent asked for vacant for-rent units in 2022: $1,694
Median gross rent in Lansing, IL in 2022: $1,206
Housing units in Lansing with a mortgage: 5,588 (348 second mortgage, 0 home equity loan, 267 both second mortgage and home equity loan )Houses without a mortgage: 69
Median household income for houses/condos with a mortgage: $78,870
Median household income for apartments without a mortgage: $82,615
Median monthly housing costs: $1,271
Data:
Median house or condo value ($)
Median house or condo value ($ change since 2000)
Median house or condo value ($) - White
Median house or condo value ($) - Black or African American
Median house or condo value ($) - Asian
Median house or condo value ($) - Hispanic or Latino
Median house or condo value ($) - American Indian and Alaska Native
Median house or condo value ($) - Multirace
Median house or condo value ($) - Other Race
Median price asked for mobile homes ($)
Household density (households per square mile)
Mean house or condo value by units in structure - 1, detached ($)
Mean house or condo value by units in structure - 1, attached ($)
Mean house or condo value by units in structure - 2 ($)
Mean house or condo value by units in structure by units in structure - 3 or 4 ($)
Mean house or condo value by units in structure - 5 or more ($)
Mean house or condo value by units in structure - Boat, RV, van, etc. ($)
Mean house or condo value by units in structure - Mobile home ($)
Median contract rent ($)
Median contract rent - Lower quartile ($)
Median contract rent - Upper quartile ($)
Median gross rent ($)
Urban houses (%)
Rural houses (%)
Houses occupied (%)
Houses occupied (% change since 2000)
Houses owner occupied (%)
Houses owner occupied (% change since 2000)
Houses renter occupied (%)
Houses renter occupied (% change since 2000)
Vacant housing units - For rent (%)
Vacant housing units - For rent (% change since 2000)
Vacant housing units - For sale only (%)
Vacant housing units - For sale only (% change since 2000)
Vacant housing units - Rented or sold, not occupied (%)
Vacant housing units - Rented or sold, not occupied (% change since 2000)
Vacant housing units - For seasonal, recreational, or occasional use (%)
Vacant housing units - For seasonal, recreational, or occasional use (% change since 2000)
Vacant housing units - For migrant workers (%)
Vacant housing units - For migrant workers (% change since 2000)
Vacant housing units - Other vacant (%)
Vacant housing units - Other vacant (% change since 2000)
Median monthly housing costs ($)
Median household income for houses/condos with a mortgage ($)
Median household income for houses/condos without a mortgage ($)
Median household income ($)
Median household income ($) - White
Median household income ($) - Black or African American
Median household income ($) - Asian
Median household income ($) - Hispanic or Latino
Median household income ($) - American Indian and Alaska Native
Median household income ($) - Multirace
Median household income ($) - Other Race
Mortgage status - with mortgage (%)
Mortgage status - with second mortgage (%)
Mortgage status - with home equity loan (%)
Mortgage status - with both second mortgage and home equity loan (%)
Mortgage status - without a mortgage (%)
Median year house/condo built
Median year apartment built
Household type by relationship - Male householder living alone (%)
Household type by relationship - Male householder not living alone (%)
Household type by relationship - Female householder living alone (%)
Household type by relationship - Female householder not living alone (%)
Household type by relationship - Opposite-Sex spouse (%)
Household type by relationship - Same-Sex spouse (%)
Household type by relationship - Opposite-Sex unmarried partner (%)
Household type by relationship - Same-Sex unmarried partner (%)
Household type by relationship - In group quarters (%)
Size of family households - 2-person household (%)
Size of family households - 3-person household (%)
Size of family households - 4-person household (%)
Size of family households - 5-person household (%)
Size of family households - 6-person household (%)
Size of family households - 7-or-more-person household (%)
Size of nonfamily households - 1-person household (%)
Size of nonfamily households - 2-person household (%)
Size of nonfamily households - 3-person household (%)
Size of nonfamily households - 4-person household (%)
Size of nonfamily households - 5-person household (%)
Size of nonfamily households - 6-person household (%)
Size of nonfamily households - 7-or-moreperson household (%)
Year house built - Built 2010 or later (%)
Year house built - Built 2000 to 2009 (%)
Year house built - Built 1990 to 1999 (%)
Year house built - Built 1980 to 1989 (%)
Year house built - Built 1970 to 1979 (%)
Year house built - Built 1960 to 1969 (%)
Year house built - Built 1950 to 1959 (%)
Year house built - Built 1940 to 1949 (%)
Year house built - Built 1939 or earlier (%)
Median number of rooms in houses and condos
Median number of rooms in apartments
Median number of bedrooms in owner occupied houses
Mean number of bedrooms in owner occupied houses
Median number of bedrooms in renter occupied houses
Mean number of bedrooms in renter occupied houses
Median number of vehichles in owner occupied houses
Mean number of vehichles in owner occupied houses
Median number of vehichles in renter occupied houses
Mean number of vehichles in renter occupied houses
Rooms in owner-occupied houses - 1 room (%)
Rooms in owner-occupied houses - 2 rooms (%)
Rooms in owner-occupied houses - 3 rooms (%)
Rooms in owner-occupied houses - 4 rooms (%)
Rooms in owner-occupied houses - 5 rooms (%)
Rooms in owner-occupied houses - 6 rooms (%)
Rooms in owner-occupied houses - 7 rooms (%)
Rooms in owner-occupied houses - 8 rooms (%)
Rooms in owner-occupied houses - 9+ rooms (%)
Rooms in renter-occupied houses - 1 room (%)
Rooms in renter-occupied houses - 2 rooms (%)
Rooms in renter-occupied houses - 3 rooms (%)
Rooms in renter-occupied houses - 4 rooms (%)
Rooms in renter-occupied houses - 5 rooms (%)
Rooms in renter-occupied houses - 6 rooms (%)
Rooms in renter-occupied houses - 7 rooms (%)
Rooms in renter-occupied houses - 8 rooms (%)
Rooms in renter-occupied houses - 9+ rooms (%)
Bedrooms in owner-occupied houses - no bedrooms (%)
Bedrooms in owner-occupied houses - 1 bedroom (%)
Bedrooms in owner-occupied houses - 2 bedrooms (%)
Bedrooms in owner-occupied houses - 3 bedrooms (%)
Bedrooms in owner-occupied houses - 4 bedrooms (%)
Bedrooms in owner-occupied houses - 5+ bedrooms (%)
Bedrooms in renter-occupied houses - no bedrooms (%)
Bedrooms in renter-occupied houses - 1 bedroom (%)
Bedrooms in renter-occupied houses - 2 bedrooms (%)
Bedrooms in renter-occupied houses - 3 bedrooms (%)
Bedrooms in renter-occupied houses - 4 bedrooms (%)
Bedrooms in renter-occupied houses - 5+ bedrooms (%)
Vehicles available in owner-occupied houses - no vehicle available (%)
Vehicles available in owner-occupied houses - 1 vehicle available(%)
Vehicles available in owner-occupied houses - 2 Vehicles available (%)
Vehicles available in owner-occupied houses - 3 Vehicles available (%)
Vehicles available in owner-occupied houses - 4 Vehicles available (%)
Vehicles available in owner-occupied houses - 5+ Vehicles available (%)
Vehicles available in renter-occupied houses - no vehicle available (%)
Vehicles available in renter-occupied houses - 1 vehicle available (%)
Vehicles available in renter-occupied houses - 2 Vehicles available (%)
Vehicles available in renter-occupied houses - 3 Vehicles available (%)
Vehicles available in renter-occupied houses - 4 Vehicles available (%)
Vehicles available in renter-occupied houses - 5+ Vehicles available (%)
Housing units in structures - 1, detached (%)
Housing units in structures - 1, attached (%)
Housing units in structures - 2 (%)
Housing units in structures - 3 or 4 (%)
Housing units in structures - 5 to 9 (%)
Housing units in structures - 10 to 19 (%)
Housing units in structures - 20 to 49 (%)
Housing units in structures - 50 or more (%)
Housing units in structures - Mobile home (%)
Housing units in structures - Boat, RV, van, etc. (%)
Housing units in structures - Owners - 1, detached (%)
Housing units in structures - Owners - 1, attached (%)
Housing units in structures - Owners - 2 (%)
Housing units in structures - Owners - 3 or 4 (%)
Housing units in structures - Owners - 5 to 9 (%)
Housing units in structures - Owners - 10 to 19 (%)
Housing units in structures - Owners - 20 to 49 (%)
Housing units in structures - Owners - 50 or more (%)
Housing units in structures - Owners - Mobile home (%)
Housing units in structures - Owners - Boat, RV, van, etc. (%)
Housing units in structures - Renters - 1, detached (%)
Housing units in structures - Renters - 1, attached (%)
Housing units in structures - Renters - 2 (%)
Housing units in structures - Renters - 3 or 4 (%)
Housing units in structures - Renters - 5 to 9 (%)
Housing units in structures - Renters - 10 to 19 (%)
Housing units in structures - Renters - 20 to 49 (%)
Housing units in structures - Renters - 50 or more (%)
Housing units in structures - Renters - Mobile home (%)
Housing units in structures - Renters - Boat, RV, van, etc. (%)
House/condo owner moved in on average (years ago)
Renter moved in on average (years ago)
Year householder moved into unit - Moved in 1999 to March 2000 (%)
Year householder moved into unit - Moved in 1999 to March 2000 (%) - White
Year householder moved into unit - Moved in 1999 to March 2000 (%) - Black or African American
Year householder moved into unit - Moved in 1999 to March 2000 (%) - Asian
Year householder moved into unit - Moved in 1999 to March 2000 (%) - Hispanic or Latino
Year householder moved into unit - Moved in 1999 to March 2000 (%) - American Indian and Alaska Native
Year householder moved into unit - Moved in 1999 to March 2000 (%) - Multirace
Year householder moved into unit - Moved in 1999 to March 2000 (%) - Other Race
Year householder moved into unit - Moved in 1995 to 1998 (%)
Year householder moved into unit - Moved in 1995 to 1998 (%) - White
Year householder moved into unit - Moved in 1995 to 1998 (%) - Black or African American
Year householder moved into unit - Moved in 1995 to 1998 (%) - Asian
Year householder moved into unit - Moved in 1995 to 1998 (%) - Hispanic or Latino
Year householder moved into unit - Moved in 1995 to 1998 (%) - American Indian and Alaska Native
Year householder moved into unit - Moved in 1995 to 1998 (%) - Multirace
Year householder moved into unit - Moved in 1995 to 1998 (%) - Other Race
Year householder moved into unit - Moved in 1990 to 1994 (%)
Year householder moved into unit - Moved in 1990 to 1994 (%) - White
Year householder moved into unit - Moved in 1990 to 1994 (%) - Black or African American
Year householder moved into unit - Moved in 1990 to 1994 (%) - Asian
Year householder moved into unit - Moved in 1990 to 1994 (%) - Hispanic or Latino
Year householder moved into unit - Moved in 1990 to 1994 (%) - American Indian and Alaska Native
Year householder moved into unit - Moved in 1990 to 1994 (%) - Multirace
Year householder moved into unit - Moved in 1990 to 1994 (%) - Other Race
Year householder moved into unit - Moved in 1980 to 1989 (%)
Year householder moved into unit - Moved in 1980 to 1989 (%) - White
Year householder moved into unit - Moved in 1980 to 1989 (%) - Black or African American
Year householder moved into unit - Moved in 1980 to 1989 (%) - Asian
Year householder moved into unit - Moved in 1980 to 1989 (%) - Hispanic or Latino
Year householder moved into unit - Moved in 1980 to 1989 (%) - American Indian and Alaska Native
Year householder moved into unit - Moved in 1980 to 1989 (%) - Multirace
Year householder moved into unit - Moved in 1980 to 1989 (%) - Other Race
Year householder moved into unit - Moved in 1970 to 1979 (%)
Year householder moved into unit - Moved in 1970 to 1979 (%) - White
Year householder moved into unit - Moved in 1970 to 1979 (%) - Black or African American
Year householder moved into unit - Moved in 1970 to 1979 (%) - Asian
Year householder moved into unit - Moved in 1970 to 1979 (%) - Hispanic or Latino
Year householder moved into unit - Moved in 1970 to 1979 (%) - American Indian and Alaska Native
Year householder moved into unit - Moved in 1970 to 1979 (%) - Multirace
Year householder moved into unit - Moved in 1970 to 1979 (%) - Other Race
Year householder moved into unit - Moved in 1969 or earlier (%)
Year householder moved into unit - Moved in 1969 or earlier (%) - White
Year householder moved into unit - Moved in 1969 or earlier (%) - Black or African American
Year householder moved into unit - Moved in 1969 or earlier (%) - Asian
Year householder moved into unit - Moved in 1969 or earlier (%) - Hispanic or Latino
Year householder moved into unit - Moved in 1969 or earlier (%) - American Indian and Alaska Native
Year householder moved into unit - Moved in 1969 or earlier (%) - Multirace
Year householder moved into unit - Moved in 1969 or earlier (%) - Other Race
Housing units lacking complete plumbing facilities (%)
Housing units lacking complete kitchen facilities (%)
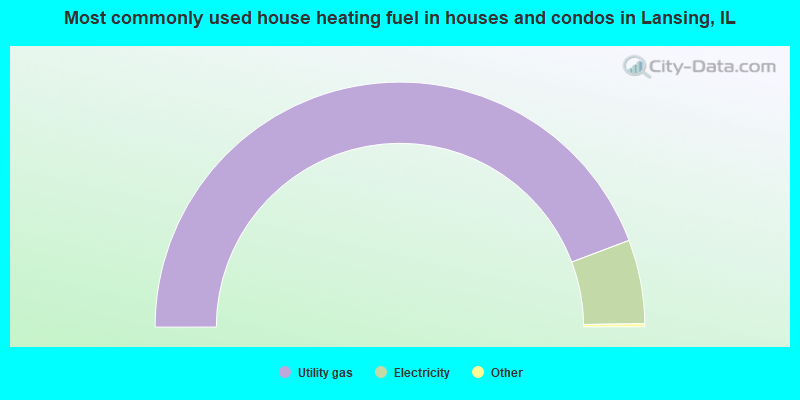
House heating fuel used in houses and condos - Utility gas (%)
House heating fuel used in houses and condos - Bottled, tank, or LP gas (%)
House heating fuel used in houses and condos - Electricity (%)
House heating fuel used in houses and condos - Fuel oil, kerosene, etc. (%)
House heating fuel used in houses and condos - Coal or coke (%)
House heating fuel used in houses and condos - Wood (%)
House heating fuel used in houses and condos - Solar energy (%)
House heating fuel used in houses and condos - Other fuel (%)
House heating fuel used in houses and condos - No fuel used (%)
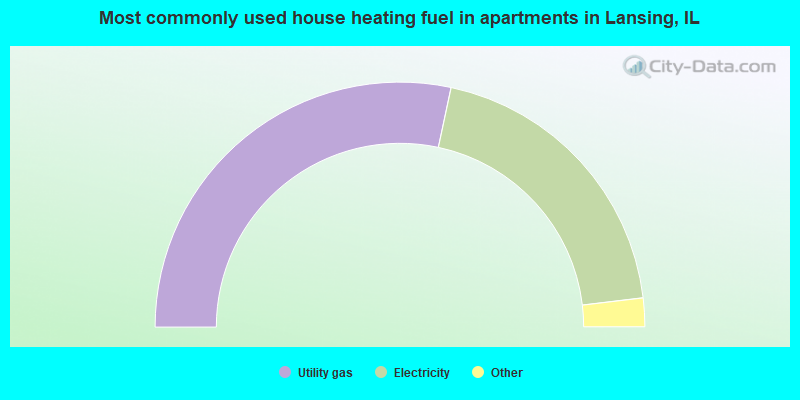
House heating fuel used in apartments - Utility gas (%)
House heating fuel used in apartments - Bottled, tank, or LP gas (%)
House heating fuel used in apartments - Electricity (%)
House heating fuel used in apartments - Fuel oil, kerosene, etc. (%)
House heating fuel used in apartments - Coal or coke (%)
House heating fuel used in apartments - Wood (%)
House heating fuel used in apartments - Solar energy (%)
House heating fuel used in apartments - Other fuel (%)
House heating fuel used in apartments - No fuel used (%)
Latest news about housing in Lansing, IL collected exclusively by city-data.com from local newspapers, TV, and radio stations
Median year house/condo built: 1963Median year apartment built: 1975Household type by relationship:
Households: 28,075
Male householders: 5,044 (1,760 living alone ), Female householders: 5,886 (1,749 living alone )3,587 spouses (3,587 opposite-sex spouses ), 556 unmarried partners , (455 opposite-sex unmarried partners ), 9,376 children (9,000 natural , 84 adopted , 292 stepchildren ), 918 grandchildren , 587 brothers or sisters , 605 parents , 202 foster children , 525 other relatives , 677 non-relatives In group quarters: 107
Size of family households: 2,814 2-persons , 1,718 3-persons , 1,391 4-persons , 787 5-persons , 140 6-persons , 185 7-or-more-persons .
Size of nonfamily households: 3,770 1-person , 323 2-persons , 155 3-persons , 73 4-persons .
2,303 married couples with children. single-parent households (822 men , 2,437 women ).
81.5% of residents of Lansing speak English at home. of residents speak Spanish at home (64% speak English very well , 16% speak English well , 14% speak English not well , 5% don't speak English at all ).of residents speak other Indo-European language at home (96% speak English very well , 4% speak English well ).of residents speak Asian or Pacific Island language at home (9% speak English very well , 57% speak English well , 34% speak English not well ).of residents speak other language at home (61% speak English very well , 18% speak English well , 21% don't speak English at all ).
Foreign born population: 2,934 (10.5%)of them are naturalized citizens )
Median number of rooms in houses and condos:
Median number of rooms in apartments
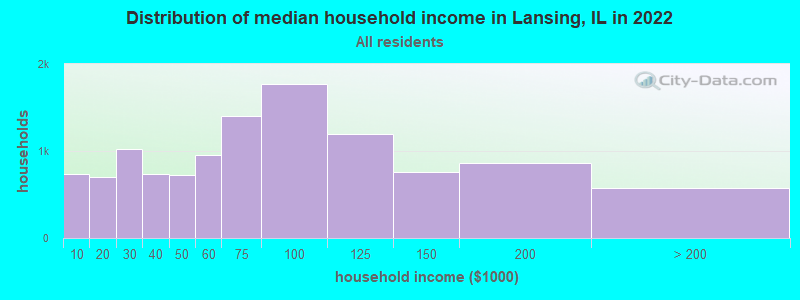
Lansing, IL household income distribution 741 Less than $10,000696 $10,000 to $19,9991,028 $20,000 to $29,999735 $30,000 to $39,999720 $40,000 to $49,999958 $50,000 to $59,9991,407 $60,000 to $74,9991,770 $75,000 to $99,9991,201 $100,000 to $124,999763 $125,000 to $149,999859 $150,000 to $199,999577 $200,000 or more
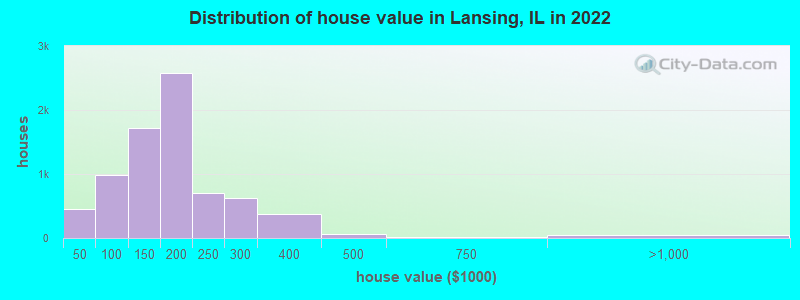
Home value of owner - occupied houses in 2022 in Lansing, IL 121 Less than $10,000119 $10,000 to $14,99958 $15,000 to $19,99931 $20,000 to $24,99919 $25,000 to $29,99948 $30,000 to $34,99929 $35,000 to $39,99921 $40,000 to $49,99998 $50,000 to $59,999309 $60,000 to $69,99967 $70,000 to $79,999189 $80,000 to $89,999303 $90,000 to $99,999626 $100,000 to $124,9991,098 $125,000 to $149,9991,443 $150,000 to $174,9991,139 $175,000 to $199,999708 $200,000 to $249,999621 $250,000 to $299,999375 $300,000 to $399,99963 $400,000 to $499,99915 $500,000 to $749,9999 $750,000 to $999,99913 $1,000,000 to $1,499,99929 $1,500,000 to $1,999,999Rent paid by renters in 2022 in Lansing, IL 26 $100 to $14912 $200 to $24921 $250 to $299126 $300 to $3496 $450 to $49923 $550 to $59993 $600 to $64917 $650 to $69992 $700 to $74914 $750 to $799424 $800 to $899462 $900 to $999829 $1,000 to $1,249456 $1,250 to $1,499418 $1,500 to $1,99967 $2,000 to $2,499218 No cash rent
Percentage of workers working in this county: 75.2%Number of people working at home: 1,516 (11.4% of all workers )
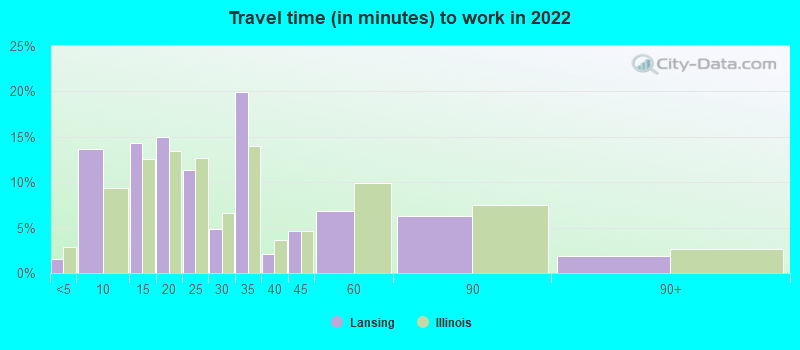
Travel time to work (commute)
Less than 5 minutes: 1545 to 9 minutes: 81710 to 14 minutes: 1,83015 to 19 minutes: 1,48320 to 24 minutes: 1,35525 to 29 minutes: 47230 to 34 minutes: 1,51235 to 39 minutes: 23340 to 44 minutes: 41745 to 59 minutes: 1,56660 to 89 minutes: 1,40090 or more minutes: 262
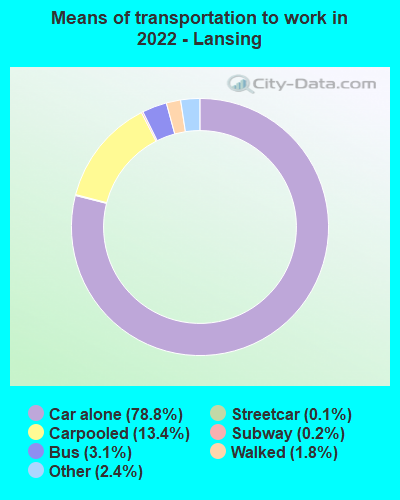
Means of transportation to work:
Drove a car alone: 5,183 (65.6%)Carpooled: 945 (12.0%)Bus : 187 (2.4%)Subway or elevated rail : 7 (0.1%)Long-distance train or commuter rail : 10 (0.1%)Taxi: 161 (2.0%)Walked: 123 (1.6%)Worked at home: 1,516 (19.2%)
Unemployment by race in 2022
Unemployment rate for White non-Hispanic residents 9.2% Males4.4% FemalesUnemployment rate for Black residents 5.5% Males13.3% FemalesUnemployment rate for other race residents 6.0% Males5.2% FemalesUnemployment rate for two or more race residents 6.9% Males5.7% FemalesUnemployment rate for Hispanic or Latino residents 10.4% Males9.4% Females
Year of entry for the foreign-born population in Lansing, Illinois
538 2010 or later 587 2000 to 2009 571 1990 to 1999 171 1980 to 1989 272 1970 to 1979 714 Before 1970
First ancestries reported:
Polish: 665 (4.0%)
Dutch: 365 (2.2%)
German: 336 (2.0%)
Nigerian: 273 (1.6%)
African: 236 (1.4%)
Italian: 231 (1.4%)
Irish: 205 (1.2%)
Serbian: 190 (1.1%)
English: 183 (1.1%)
American: 173 (1.0%)
Croatian: 113 (0.7%)
European: 50 (0.3%)
Haitian: 42 (0.3%)
Jamaican: 32 (0.2%)
Greek: 28 (0.2%)
Swedish: 23 (0.1%)
French: 17 (0.1%)
Maltese: 16 (0.10%)
Scotch-Irish: 15 (0.09%)
Scandinavian: 13 (0.08%)
Scottish: 12 (0.07%)
Hungarian: 10 (0.06%)
Romanian: 9 (0.05%)
Pennsylvania German: 8 (0.05%)
Russian: 5 (0.03%)
Slovak: 5 (0.03%)
Barbadian: 4 (0.02%) Most common places of birth for foreign-born residents (%): Mexico Lansing:
52.1% (1,528)Illinois:
34.7% (626,958)
Philippines Lansing:
17.3% (508)Illinois:
5.2% (93,003)
Nigeria Lansing:
10.5% (307)Illinois:
1.2% (21,186)
Cameroon Lansing:
2.4% (69)Illinois:
0.1% (1,856)
Korea Lansing:
2.0% (59)Illinois:
2.2% (40,393)
Bolivia Lansing:
2.0% (59)Illinois:
0.1% (1,913)
Africa, n.e.c. Lansing:
1.6% (47)Illinois:
0.3% (5,397)
Canada Lansing:
1.5% (45)Illinois:
1.1% (19,306)
Place of birth for U.S.-born residents:
This state: 18,508Other state: 6,460Northeast: 263Midwest: 4,269South: 1,695West: 312 88.4% of Lansing residents lived in the same house 1 years ago.
Out of people who lived in different houses, 48.6% lived in this county.
Out of people who lived in different counties, 57.6% lived in Illinois.
Lansing:
88.4%State average:
88.3%
Education attainment for males 25 years and older:
No schooling: 98Nursery to 4th grade: 855th and 6th grade: 117th and 8th grade: 459th grade: 7410th grade: 17711th grade: 6612th grade, no diploma: 150High school graduate (or equivalency): 3,331Less than 1 year of college: 606Some college more than 1 year, no degree: 1,459Associate degree: 872Bachelor's degree: 1,260Master's degree: 597Professional school degree: 104Doctorate degree: 121
Education attainment for females 25 years and older:
No schooling: 178Nursery to 4th grade: 475th and 6th grade: 677th and 8th grade: 499th grade: 7210th grade: 4211th grade: 7812th grade, no diploma: 268High school graduate (or equivalency): 2,677Less than 1 year of college: 803Some college more than 1 year, no degree: 1,954Associate degree: 995Bachelor's degree: 1,893Master's degree: 862Professional school degree: 199Doctorate degree: 49
Housing units in structures:
One, detached: 8,700One, attached: 267Two: 693 or 4: 4385 to 9: 97310 to 19: 79020 to 49: 57350 or more: 227Mobile homes: 137Housing units lacking complete plumbing facilities in 2022: 0.8%Housing units lacking complete kitchen facilities in 2022: 0.3%House/condo owner moved in on average 12 years ago
Renter moved in on average 3 years ago
Private vs. public school enrollment:
Students in private schools in grades 1 to 8 (elementary and middle school): 460 Students in private schools in grades 9 to 12 (high school): 269 Students in private undergraduate colleges: 289