Laurel, DE (Delaware) Houses and Residents
| Laurel: | $198,192 |
| Delaware: | $337,200 |
Mean price in 2022:
Detached houses: $182,344
Here: $182,344 State: $419,599
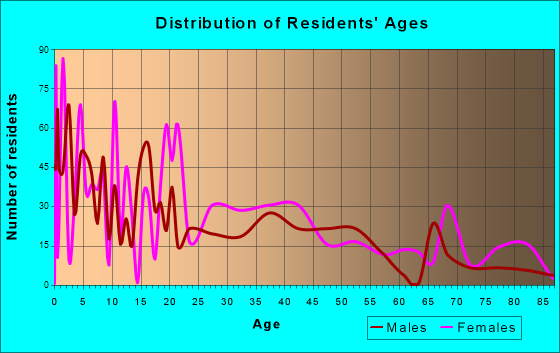
Total population: 3,983 (Urban population: 3,716 (all inside urban clusters), Rural population: 70 (all nonfarm))
Houses: 1,553 (1,388 occupied: 482 owner occupied, 897 renter occupied)
| % of renters here: | 65% |
| State: | 26% |
Housing density: 938 houses/condos per square mile
Median price asked for vacant for-sale houses and condos in 2022 in this county: $381,009.
Median contract rent in 2022: $757 (lower quartile is $357, upper quartile is $948)
Median rent asked for vacant for-rent units in 2022: $1,176
Median gross rent in Laurel, DE in 2022: $886
Housing units in Laurel with a mortgage: 314 (11 second mortgage, 0 home equity loan, 11 both second mortgage and home equity loan)
Houses without a mortgage: 19
Median household income for houses/condos with a mortgage: $88,522
Median household income for apartments without a mortgage: $39,998
Median monthly housing costs: $864
Compare current foreclosures near Laurel, DE:
| Photo | Address | Area | Beds / Baths | Price | Details |
|---|---|---|---|---|---|

|
#1
Kensington Way
Laurel, DE 19956
|
1,356 sq. feet
|
- baths 3 beds |
show details | |

|
#2
Kensington Way
Laurel, DE 19956
|
1,344 sq. feet
|
- baths 3 beds |
show details | |

|
#3
Pine Grove Rd
Laurel, DE 19956
|
1,863 sq. feet
|
- baths 3 beds |
show details | |

|
#4
Center St
Laurel, DE 19956
|
1,200 sq. feet
|
- baths 4 beds |
show details | |

|
#5
Mumfords Ln
Laurel, DE 19956
|
800 sq. feet
|
- baths 2 beds |
show details | |
|
|
#6
Portsville Rd
Laurel, DE 19956
|
2,051 sq. feet
|
- baths 3 beds |
show details | |

|
#7
Chris Ave
Laurel, DE 19956
|
1,056 sq. feet
|
- baths - beds |
show details | |

|
#8
Shockley Rd
Laurel, DE 19956
|
- sq. feet
|
- baths - beds |
show details | |

|
#9
Circle
Laurel, DE 19956
|
- sq. feet
|
- baths - beds |
show details | |

|
#10
Careys Camp Rd
Laurel, DE 19956
|
- sq. feet
|
- baths - beds |
show details |
| Photo | Address | Area | Beds / Baths | Price | Details |
|---|---|---|---|---|---|

|
#11
Discount Land Rd
Laurel, DE 19956
|
1,251 sq. feet
|
- baths - beds |
show details | |

|
#12
Little Creek Ln
Laurel, DE 19956
|
1,248 sq. feet
|
- baths - beds |
show details | |

|
#13
Laurel Ct Unit 102
Laurel, DE 19956
|
- sq. feet
|
- baths - beds |
show details | |

|
#14
Dannys Dr
Laurel, DE 19956
|
2,128 sq. feet
|
- baths - beds |
show details | |

|
#15
Carvel Ave
Laurel, DE 19956
|
- sq. feet
|
- baths - beds |
show details | |

|
#16
Broad Creek Rd
Laurel, DE 19956
|
- sq. feet
|
- baths - beds |
show details | |

|
#17
Portsville Rd
Laurel, DE 19956
|
- sq. feet
|
- baths - beds |
show details | |

|
#18
Laurel Ct
Laurel, DE 19956
|
- sq. feet
|
- baths - beds |
show details | |

|
#19
Mylee Ln
Laurel, DE 19956
|
- sq. feet
|
- baths - beds |
show details | |

|
#20
Beaver Dam Branch Rd
Laurel, DE 19956
|
- sq. feet
|
- baths - beds |
show details |
| Photo | Address | Area | Beds / Baths | Price | Details |
|---|---|---|---|---|---|

|
#21
Shiloh Way
Laurel, DE 19956
|
- sq. feet
|
- baths - beds |
show details | |

|
#22
E Church St
Salisbury, MD 21804
|
1,615 sq. feet
|
3 baths 1 beds |
$219,900
|
show details |

|
#23
Waterview Dr
Seaford, DE 19973
|
2,150 sq. feet
|
2 baths 3 beds |
$355,000
|
show details |

|
#24
Careys Camp Rd
Laurel, DE 19956
|
- sq. feet
|
- baths - beds |
show details | |

|
#25
Sharptown Rd
Laurel, DE 19956
|
- sq. feet
|
- baths - beds |
show details | |

|
#26
West St
Laurel, DE 19956
|
- sq. feet
|
- baths - beds |
show details | |

|
#27
West St
Laurel, DE 19956
|
- sq. feet
|
- baths - beds |
show details | |

|
#28
Tracy Cir
Laurel, DE 19956
|
- sq. feet
|
- baths - beds |
show details | |

|
#29
S Poplar St
Laurel, DE 19956
|
- sq. feet
|
- baths - beds |
show details | |

|
#30
Mount Zion Rd
Laurel, DE 19956
|
- sq. feet
|
- baths - beds |
show details |
| Photo | Address | Area | Beds / Baths | Price | Details |
|---|---|---|---|---|---|

|
#31
Franklin St
Georgetown, DE 19947
|
1,098 sq. feet
|
1 baths 2 beds |
show details | |

|
#32
Magnolia Dr
Seaford, DE 19973
|
1,804 sq. feet
|
3 baths 4 beds |
show details | |

|
#33
E Spruce St
Seaford, DE 19973
|
1,900 sq. feet
|
2 baths 3 beds |
show details | |

|
#34
Russell Rd
Bridgeville, DE 19933
|
2,554 sq. feet
|
2 baths 4 beds |
show details | |

|
#35
Bethesda Rd
Georgetown, DE 19947
|
1,876 sq. feet
|
2 baths 3 beds |
show details | |

|
#36
W Central Ave
Federalsburg, MD 21632
|
1,670 sq. feet
|
1 baths 4 beds |
show details | |

|
#37
West Rd
Salisbury, MD 21801
|
1,681 sq. feet
|
1 baths 3 beds |
show details | |

|
#38
Mount Hermon Rd
Parsonsburg, MD 21849
|
1,326 sq. feet
|
1 baths 3 beds |
show details | |

|
#39
Whipple Dr
Delmar, MD 21875
|
2,436 sq. feet
|
2 baths - beds |
show details | |

|
#40
E East St
Delmar, MD 21875
|
1,838 sq. feet
|
1 baths - beds |
show details |
| Photo | Address | Area | Beds / Baths | Price | Details |
|---|---|---|---|---|---|

|
#41
S Main St
Hurlock, MD 21643
|
1,757 sq. feet
|
2 baths - beds |
show details | |

|
#42
Bailey Ln
Salisbury, MD 21801
|
1,560 sq. feet
|
2 baths - beds |
show details | |

|
#43
Hollow Mist Dr
Salisbury, MD 21804
|
2,508 sq. feet
|
2 baths - beds |
show details | |

|
#44
E Lincoln Ave
Salisbury, MD 21804
|
1,008 sq. feet
|
1 baths - beds |
show details | |

|
#45
Cherry Way
Salisbury, MD 21804
|
884 sq. feet
|
1 baths - beds |
show details | |

|
#46
Redden Rd
Bridgeville, DE 19933
|
1,557 sq. feet
|
- baths 3 beds |
show details | |

|
#47
Green Branch Rd
Willards, MD 21874
|
1,568 sq. feet
|
1 baths - beds |
show details | |

|
#48
Gumboro Rd
Pittsville, MD 21850
|
912 sq. feet
|
1 baths - beds |
show details | |

|
#49
Godwin School Rd
Millsboro, DE 19966
|
2,536 sq. feet
|
- baths 3 beds |
show details | |

|
Check over 1 million property listings on Foreclosure.com!
|
browse all offers | |||

Latest news about housing in Laurel, DE collected exclusively by city-data.com from local newspapers, TV, and radio stations


Median year apartment built: 1979
Household type by relationship:
Households: 4,205- Male householders: 420 (136 living alone), Female householders: 978 (152 living alone)
208 spouses (185 opposite-sex spouses), 111 unmarried partners, (111 opposite-sex unmarried partners), 1,752 children (1,752 natural, 0 adopted, 0 stepchildren), 464 grandchildren, 0 brothers or sisters, 54 parents, 0 foster children, 130 other relatives, 60 non-relatives
- In group quarters: 23
Size of family households: 312 2-persons, 234 3-persons, 100 4-persons, 260 5-persons, 6 6-persons, 86 7-or-more-persons.
Size of nonfamily households: 268 1-person, 83 2-persons, 18 3-persons.
91 married couples with children.
890 single-parent households (119 men, 771 women).
73.9% of residents of Laurel speak English at home.
24.1% of residents speak Spanish at home (52% speak English very well, 13% speak English well, 21% speak English not well, 14% don't speak English at all).
1.3% of residents speak other Indo-European language at home (61% speak English well, 39% speak English not well).
Foreign born population: 664 (15.8%)
(38.9% of them are naturalized citizens)
| Here: | 6.9 |
| State: | 6.9 |
| Here: | 4.3 |
| State: | 4.4 |

- Bedrooms in owner-occupied houses and condos in Laurel, Delaware
- 0no bedroom
- 01 bedroom
- 1432 bedrooms
- 2463 bedrooms
- 604 bedrooms
- 355+ bedrooms

- Bedrooms in renter-occupied apartments in Laurel, Delaware
- 73no bedroom
- 351 bedroom
- 4342 bedrooms
- 2773 bedrooms
- 794 bedrooms
- 05+ bedrooms

- Cars and other vehicles available in Laurel in owner-occupied houses/condos
- 19no vehicle
- 1811 vehicle
- 2072 vehicles
- 253 vehicles
- 514 vehicles
- 05+ vehicles

- Cars and other vehicles available in Laurel in renter-occupied apartments
- 115no vehicle
- 6341 vehicle
- 942 vehicles
- 543 vehicles
- 04 vehicles
- 05+ vehicles

- Rooms in owner-occupied houses in Laurel, Delaware
- 01 room
- 02 rooms
- 03 rooms
- 584 rooms
- 585 rooms
- 826 rooms
- 1087 rooms
- 868 rooms
- 919+ rooms

- Rooms in renter-occupied apartments in Laurel, Delaware
- 731 room
- 02 rooms
- 1403 rooms
- 3334 rooms
- 2145 rooms
- 366 rooms
- 437 rooms
- 428 rooms
- 179+ rooms


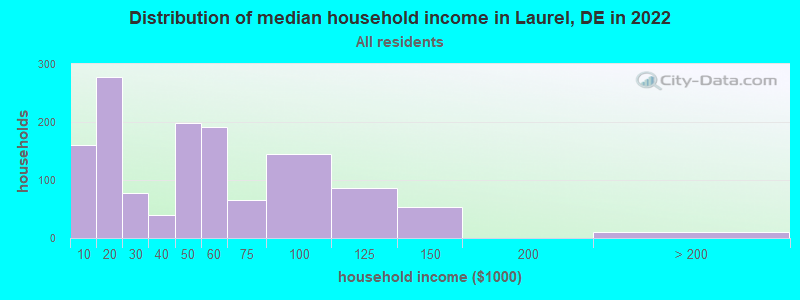
Laurel, DE household income distribution

- 161Less than $10,000
- 278$10,000 to $19,999
- 77$20,000 to $29,999
- 39$30,000 to $39,999
- 198$40,000 to $49,999
- 192$50,000 to $59,999
- 66$60,000 to $74,999
- 145$75,000 to $99,999
- 87$100,000 to $124,999
- 53$125,000 to $149,999
- 10$200,000 or more
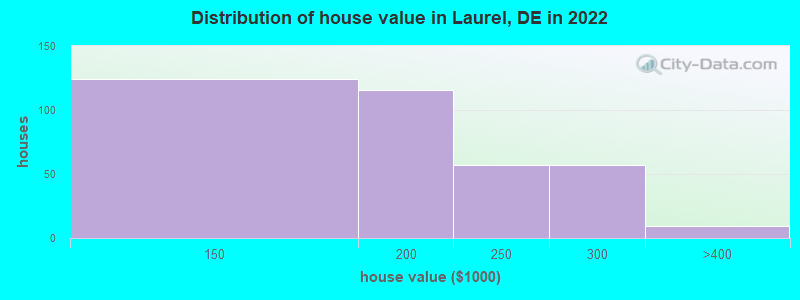
Home value of owner - occupied houses in 2022 in Laurel, DE
-
- 104$100,000 to $124,999
- 19$125,000 to $149,999
- 64$150,000 to $174,999
- 51$175,000 to $199,999
- 56$200,000 to $249,999
- 57$250,000 to $299,999
- 9$300,000 to $399,999
Rent paid by renters in 2022 in Laurel, DE
-
- 14$100 to $149
- 130$200 to $249
- 20$250 to $299
- 4$300 to $349
- 69$350 to $399
- 48$500 to $549
- 44$550 to $599
- 13$700 to $749
- 31$750 to $799
- 198$800 to $899
- 91$900 to $999
- 20$1,000 to $1,249
- 26$1,250 to $1,499
- 90No cash rent


Percentage of workers working in this county: 79.6%
Number of people working at home: 27 (2.1% of all workers)
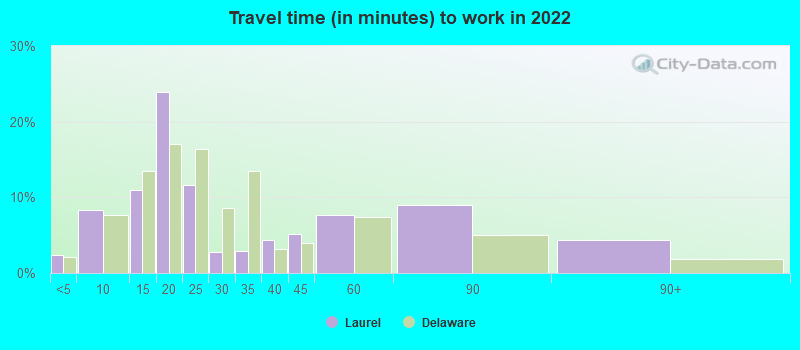
Travel time to work (commute)
- Less than 5 minutes: 31
- 5 to 9 minutes: 57
- 10 to 14 minutes: 148
- 15 to 19 minutes: 140
- 20 to 24 minutes: 50
- 25 to 29 minutes: 167
- 30 to 34 minutes: 102
- 35 to 39 minutes: 3
- 40 to 44 minutes: 0
- 45 to 59 minutes: 257
- 60 to 89 minutes: 137
- 90 or more minutes: 1
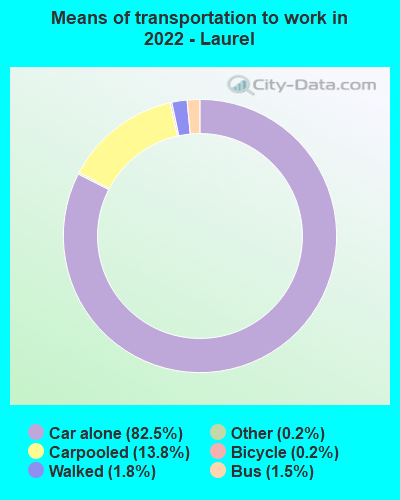
Means of transportation to work:
- Drove a car alone: 1,301 (77.7%)
- Carpooled: 198 (11.8%)
- Bus: 19 (1.1%)
- Taxi: 3 (0.2%)
- Bicycle: 2 (0.1%)
- Walked: 37 (2.2%)
- Worked at home: 27 (1.6%)

- Unemployment by race in 2022
- Unemployment rate for White non-Hispanic residents
- 8.0%Males
- 10.4%Females
- Unemployment rate for Black residents
- 8.3%Females
- Unemployment rate for Asian residents
- 100.0%Females
- Unemployment rate for other race residents
- 100.0%Females
- Unemployment rate for two or more race residents
- 31.0%Females
- Unemployment rate for Hispanic or Latino residents
- 8.8%Males
- 50.7%Females

- Year of entry for the foreign-born population in Laurel, Delaware
- 3552010 or later
- 2012000 to 2009
- 621990 to 1999
- 491980 to 1989
- 131970 to 1979
- 0Before 1970

First ancestries reported:
- German: 124 (3.9%)
- Haitian: 74 (2.4%)
- African: 71 (2.3%)
- English: 62 (2.0%)
- Irish: 54 (1.7%)
- Italian: 17 (0.5%)
- Scottish: 14 (0.4%)
- European: 13 (0.4%)
- American: 9 (0.3%)
- British: 5 (0.2%)
Most common places of birth for foreign-born residents (%):
| Laurel: | 56.8% (364) |
| Delaware: | 6.0% (5,803) |
| Laurel: | 18.6% (119) |
| Delaware: | 1.0% (950) |
| Laurel: | 17.6% (113) |
| Delaware: | 1.1% (1,038) |
| Laurel: | 8.0% (51) |
| Delaware: | 3.8% (3,686) |
| Laurel: | 4.4% (28) |
| Delaware: | 15.3% (14,887) |
Place of birth for U.S.-born residents:
- This state: 1,882
- Other state: 1,531
- Northeast: 462
- Midwest: 27
- South: 973
- West: 74
79.0% of Laurel residents lived in the same house 1 years ago.
Out of people who lived in different houses, 18.6% lived in this county.
Out of people who lived in different counties, 0.0% lived in Delaware.
| Laurel: | 79.0% |
| State average: | 89.2% |
Education attainment for males 25 years and older:
- No schooling: 0
- Nursery to 4th grade: 30
- 5th and 6th grade: 26
- 7th and 8th grade: 25
- 9th grade: 30
- 10th grade: 43
- 11th grade: 42
- 12th grade, no diploma: 143
- High school graduate (or equivalency): 237
- Less than 1 year of college: 53
- Some college more than 1 year, no degree: 144
- Associate degree: 26
- Bachelor's degree: 52
- Master's degree: 0
- Professional school degree: 1
- Doctorate degree: 0

Education attainment for females 25 years and older:
- No schooling: 34
- Nursery to 4th grade: 19
- 5th and 6th grade: 10
- 7th and 8th grade: 10
- 9th grade: 0
- 10th grade: 54
- 11th grade: 143
- 12th grade, no diploma: 0
- High school graduate (or equivalency): 531
- Less than 1 year of college: 40
- Some college more than 1 year, no degree: 157
- Associate degree: 83
- Bachelor's degree: 121
- Master's degree: 26
- Professional school degree: 0
- Doctorate degree: 0

Housing units in structures:
- One, detached: 913
- One, attached: 160
- Two: 93
- 3 or 4: 58
- 5 to 9: 99
- 10 to 19: 126
- 20 to 49: 39
- 50 or more: 62
House/condo owner moved in on average 12 years ago
Renter moved in on average 5 years ago

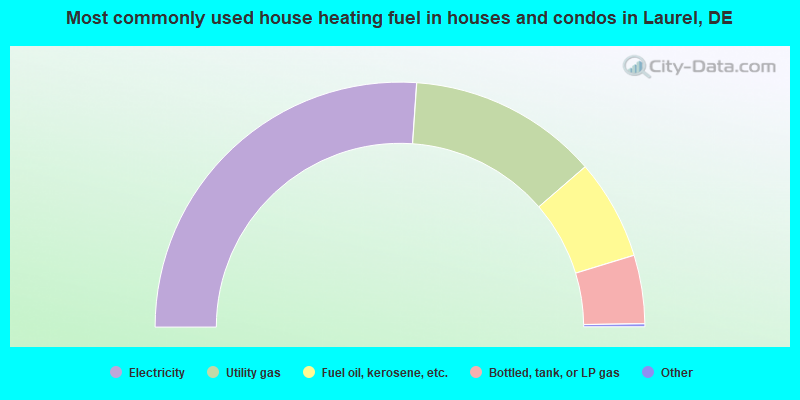
- 52.4%Electricity
- 25.2%Utility gas
- 13.3%Fuel oil, kerosene, etc.
- 9.1%Bottled, tank, or LP gas
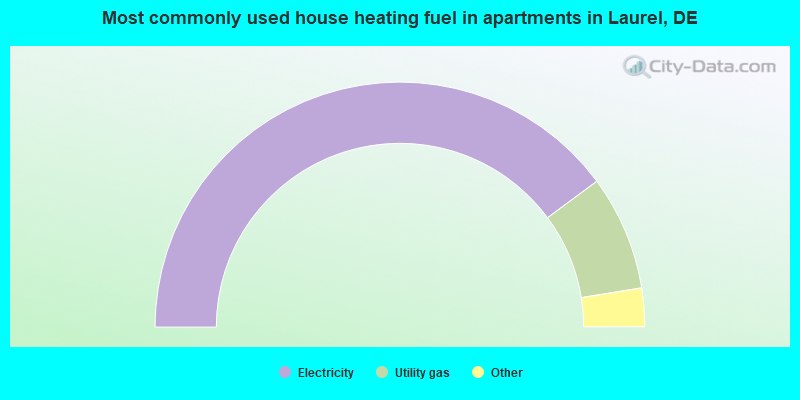
- 79.8%Electricity
- 15.2%Utility gas
- 3.0%Fuel oil, kerosene, etc.
- 2.0%Bottled, tank, or LP gas
Private vs. public school enrollment:
| Here: | 13.9% |
| Delaware: | 11.5% |
| Here: | 9.1% |
| Delaware: | 12.1% |
| Here: | 0.0% |
| Delaware: | 19.2% |


