Lebanon, OH (Ohio) Houses and Residents
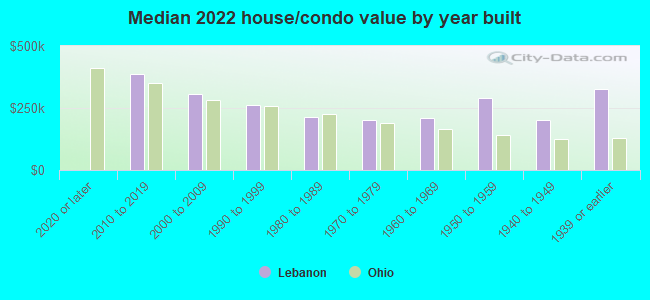
| Lebanon: | $272,294 |
| Ohio: | $204,100 |
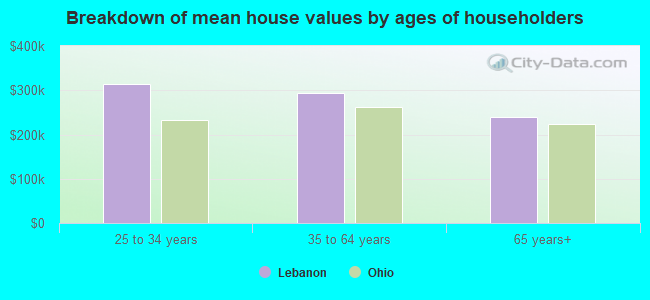
Mean price in 2022:
Detached houses: $281,186
Here: $281,186 State: $254,366 Townhouses or other attached units: $197,031
Here: $197,031 State: $225,733 In 2-unit structures: $243,561
Here: $243,561 State: $144,384 In 5-or-more-unit structures: $129,307
Here: $129,307 State: $211,593
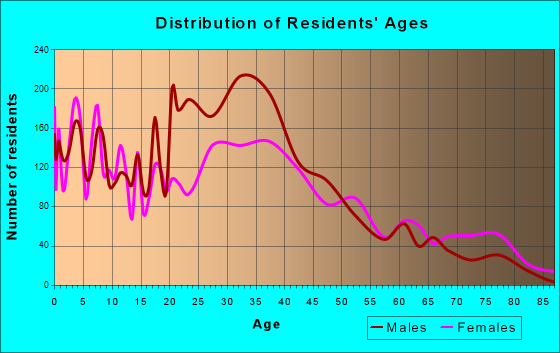
Total population: 20,434 (Urban population: 16,792 (all inside urban clusters), Rural population: 56 (all nonfarm))
Houses: 8,850 (8,309 occupied: 5,157 owner occupied, 3,357 renter occupied)
| % of renters here: | 39% |
| State: | 33% |
Housing density: 752 houses/condos per square mile
Median price asked for vacant for-sale houses and condos in 2022: $183,541.
Median contract rent in 2022: $882 (lower quartile is $684, upper quartile is $1,035)
Median rent asked for vacant for-rent units in 2022: $1,116
Median gross rent in Lebanon, OH in 2022: $991
Housing units in Lebanon with a mortgage: 3,794 (434 second mortgage, 1 home equity loan, 453 both second mortgage and home equity loan)
Houses without a mortgage: 170
Median household income for houses/condos with a mortgage: $108,421
Median household income for apartments without a mortgage: $66,593
Median monthly housing costs: $1,064
Compare current foreclosures in Lebanon, OH:
| Photo | Address | Area | Beds / Baths | Price | Details |
|---|---|---|---|---|---|

|
#1
Eastview Dr
Lebanon, OH 45036
|
1,859 sq. feet
|
2 baths 3 beds |
show details | |

|
#2
Hampton Ct
Lebanon, OH 45036
|
2,056 sq. feet
|
2 baths 4 beds |
show details | |

|
#3
Winding Way
Lebanon, OH 45036
|
1,134 sq. feet
|
1 baths 3 beds |
show details | |

|
#4
Garfield Park Blvd
Lebanon, OH 45036
|
1,698 sq. feet
|
2 baths 3 beds |
show details | |

|
#5
Cherry Hill Ln
Lebanon, OH 45036
|
1,872 sq. feet
|
2 baths 3 beds |
show details | |

|
#6
Grandstone Ct
Lebanon, OH 45036
|
1,772 sq. feet
|
2 baths 4 beds |
show details | |

|
#7
Vicki Ln
Lebanon, OH 45036
|
2,544 sq. feet
|
2 baths 3 beds |
show details | |

|
#8
Lawndale Ave
Lebanon, OH 45036
|
1,404 sq. feet
|
1 baths 3 beds |
show details | |

|
#9
Virginia Ct
Lebanon, OH 45036
|
1,624 sq. feet
|
2 baths 3 beds |
show details | |

|
#10
Sterling Dr
Lebanon, OH 45036
|
1,980 sq. feet
|
2 baths 4 beds |
show details |
| Photo | Address | Area | Beds / Baths | Price | Details |
|---|---|---|---|---|---|

|
#11
Wood Forge Cir
Lebanon, OH 45036
|
1,320 sq. feet
|
2 baths 3 beds |
show details | |

|
#12
W Warren St
Lebanon, OH 45036
|
800 sq. feet
|
1 baths 3 beds |
show details | |

|
#13
Cherry Hill Ln
Lebanon, OH 45036
|
3,660 sq. feet
|
2 baths 4 beds |
show details | |

|
#14
S Us Route 42
Lebanon, OH 45036
|
1,512 sq. feet
|
2 baths 3 beds |
show details | |

|
#15
Promenade Dr
Lebanon, OH 45036
|
2,136 sq. feet
|
2 baths 3 beds |
show details | |

|
#16
Hart Rd
Lebanon, OH 45036
|
1,644 sq. feet
|
2 baths 3 beds |
show details | |

|
#17
Deerfield Rd # B
Lebanon, OH 45036
|
1,272 sq. feet
|
1 baths 3 beds |
show details | |

|
#18
Belmont Ct
Lebanon, OH 45036
|
1,692 sq. feet
|
2 baths 3 beds |
show details | |

|
#19
Cedar Ln
Lebanon, OH 45036
|
1,040 sq. feet
|
1 baths 2 beds |
show details | |

|
#20
E Concord Dr
Lebanon, OH 45036
|
2,448 sq. feet
|
2 baths 4 beds |
show details |
| Photo | Address | Area | Beds / Baths | Price | Details |
|---|---|---|---|---|---|

|
#21
N Broadway St # 4102
Lebanon, OH 45036
|
- sq. feet
|
- baths - beds |
show details | |

|
#22
Hastings Ct
Lebanon, OH 45036
|
- sq. feet
|
- baths - beds |
show details | |

|
#23
Iroquois Dr
Lebanon, OH 45036
|
- sq. feet
|
- baths - beds |
show details | |

|
#24
Farview Ave Apt 2
Lebanon, OH 45036
|
- sq. feet
|
- baths - beds |
show details | |

|
#25
La Luz Blvd Apt 307
Lebanon, OH 45036
|
- sq. feet
|
- baths - beds |
show details | |

|
#26
Stanwood Dr
Lebanon, OH 45036
|
- sq. feet
|
- baths - beds |
show details | |

|
#27
Hunters Run Dr Apt A
Lebanon, OH 45036
|
- sq. feet
|
- baths - beds |
show details | |

|
#28
W Northwood Dr Apt 19
Lebanon, OH 45036
|
- sq. feet
|
- baths - beds |
show details | |

|
#29
Deerfield Rd Unit 602
Lebanon, OH 45036
|
- sq. feet
|
- baths - beds |
show details | |

|
#30
June Marie Dr Apt B
Lebanon, OH 45036
|
- sq. feet
|
- baths - beds |
show details |
| Photo | Address | Area | Beds / Baths | Price | Details |
|---|---|---|---|---|---|

|
#31
Rough Way Unit A
Lebanon, OH 45036
|
- sq. feet
|
- baths - beds |
show details | |

|
#32
Franklin Rd # D6
Lebanon, OH 45036
|
- sq. feet
|
- baths - beds |
show details | |

|
#33
Dave Ave # No102
Lebanon, OH 45036
|
6,770 sq. feet
|
- baths - beds |
show details | |

|
Check over 1 million property listings on Foreclosure.com!
|
browse all offers | |||

Latest news about housing in Lebanon, OH collected exclusively by city-data.com from local newspapers, TV, and radio stations


Median year apartment built: 1984
Household type by relationship:
Households: 21,567- Male householders: 3,960 (761 living alone), Female householders: 4,311 (1,165 living alone)
4,428 spouses (4,428 opposite-sex spouses), 588 unmarried partners, (555 opposite-sex unmarried partners), 6,685 children (6,342 natural, 93 adopted, 249 stepchildren), 277 grandchildren, 9 brothers or sisters, 120 parents, 0 foster children, 108 other relatives, 535 non-relatives
- In group quarters: 542
Size of family households: 2,790 2-persons, 1,028 3-persons, 1,080 4-persons, 559 5-persons, 105 6-persons, 122 7-or-more-persons.
Size of nonfamily households: 2,363 1-person, 525 2-persons, 31 3-persons.
3,697 married couples with children.
1,034 single-parent households (247 men, 787 women).
96.0% of residents of Lebanon speak English at home.
2.4% of residents speak Spanish at home (26% speak English very well, 14% speak English well, 29% speak English not well, 31% don't speak English at all).
0.7% of residents speak other Indo-European language at home (49% speak English very well, 46% speak English well, 5% don't speak English at all).
0.7% of residents speak Asian or Pacific Island language at home (64% speak English very well, 7% speak English well, 29% speak English not well).
0.1% of residents speak other language at home (100% speak English very well).
Foreign born population: 1,107 (5.1%)
(65.6% of them are naturalized citizens)
| Here: | 7.1 |
| State: | 6.7 |
| Here: | 4.3 |
| State: | 4.4 |
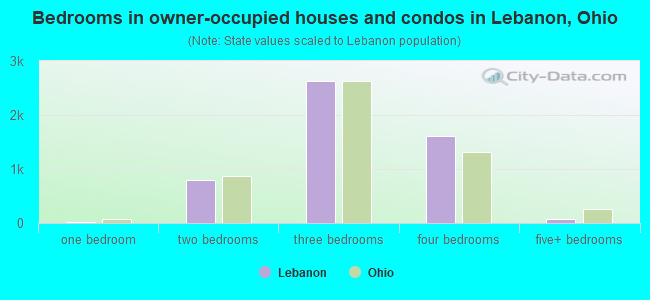
- Bedrooms in owner-occupied houses and condos in Lebanon, Ohio
- 8no bedroom
- 161 bedroom
- 8012 bedrooms
- 2,6373 bedrooms
- 1,6204 bedrooms
- 755+ bedrooms
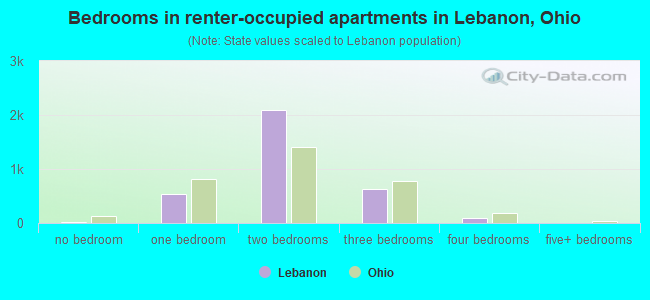
- Bedrooms in renter-occupied apartments in Lebanon, Ohio
- 20no bedroom
- 5441 bedroom
- 2,0882 bedrooms
- 6223 bedrooms
- 844 bedrooms
- 05+ bedrooms
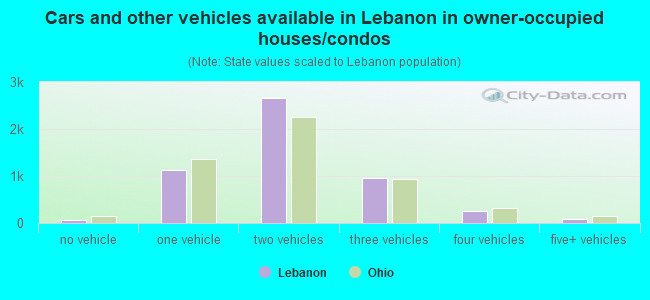
- Cars and other vehicles available in Lebanon in owner-occupied houses/condos
- 58no vehicle
- 1,1371 vehicle
- 2,6652 vehicles
- 9503 vehicles
- 2584 vehicles
- 895+ vehicles
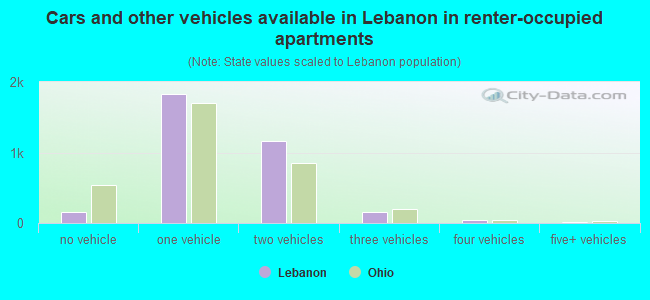
- Cars and other vehicles available in Lebanon in renter-occupied apartments
- 158no vehicle
- 1,8351 vehicle
- 1,1622 vehicles
- 1513 vehicles
- 434 vehicles
- 85+ vehicles
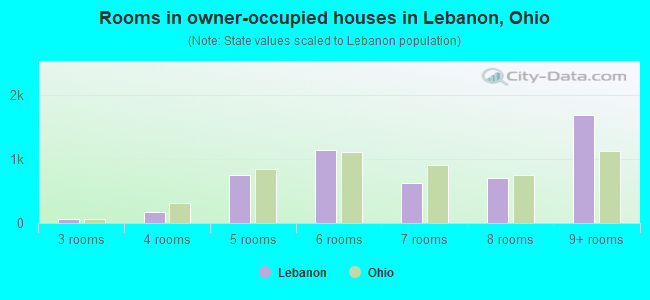
- Rooms in owner-occupied houses in Lebanon, Ohio
- 81 room
- 02 rooms
- 643 rooms
- 1654 rooms
- 7465 rooms
- 1,1416 rooms
- 6357 rooms
- 7028 rooms
- 1,6959+ rooms
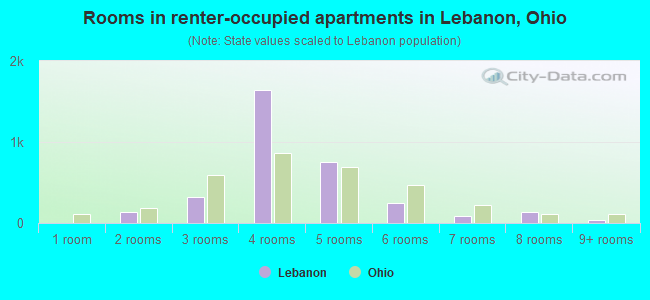
- Rooms in renter-occupied apartments in Lebanon, Ohio
- 01 room
- 1342 rooms
- 3213 rooms
- 1,6394 rooms
- 7595 rooms
- 2446 rooms
- 827 rooms
- 1378 rooms
- 409+ rooms
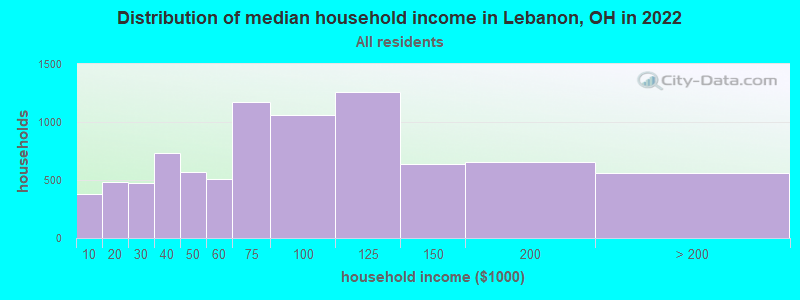
Lebanon, OH household income distribution

- 383Less than $10,000
- 480$10,000 to $19,999
- 478$20,000 to $29,999
- 734$30,000 to $39,999
- 571$40,000 to $49,999
- 507$50,000 to $59,999
- 1,175$60,000 to $74,999
- 1,064$75,000 to $99,999
- 1,260$100,000 to $124,999
- 642$125,000 to $149,999
- 658$150,000 to $199,999
- 561$200,000 or more
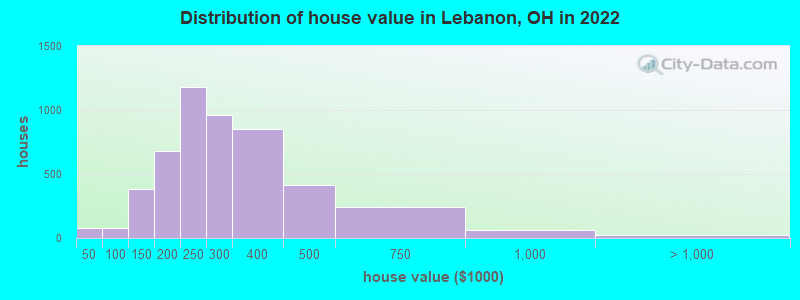
Home value of owner - occupied houses in 2022 in Lebanon, OH
-
- 21Less than $10,000
- 11$10,000 to $14,999
- 42$25,000 to $29,999
- 5$70,000 to $79,999
- 56$80,000 to $89,999
- 18$90,000 to $99,999
- 213$100,000 to $124,999
- 165$125,000 to $149,999
- 232$150,000 to $174,999
- 444$175,000 to $199,999
- 1,180$200,000 to $249,999
- 963$250,000 to $299,999
- 851$300,000 to $399,999
- 410$400,000 to $499,999
- 239$500,000 to $749,999
- 65$750,000 to $999,999
- 21$1,000,000 to $1,499,999
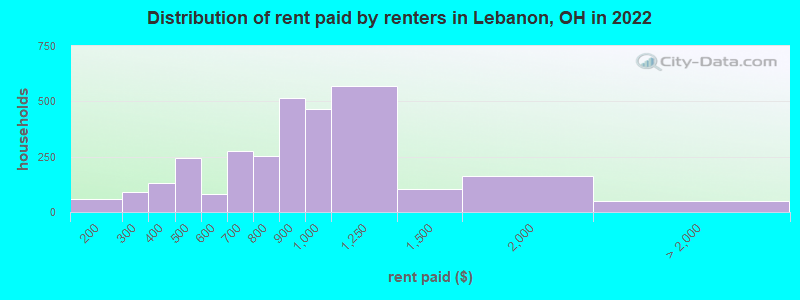
Rent paid by renters in 2022 in Lebanon, OH
-
- 38$100 to $149
- 18$150 to $199
- 92$200 to $249
- 11$300 to $349
- 121$350 to $399
- 96$400 to $449
- 148$450 to $499
- 67$500 to $549
- 11$550 to $599
- 134$600 to $649
- 139$650 to $699
- 178$700 to $749
- 73$750 to $799
- 514$800 to $899
- 464$900 to $999
- 569$1,000 to $1,249
- 101$1,250 to $1,499
- 160$1,500 to $1,999
- 50No cash rent
Percentage of workers working in this county: 62.8%
Number of people working at home: 1,189 (11.8% of all workers)
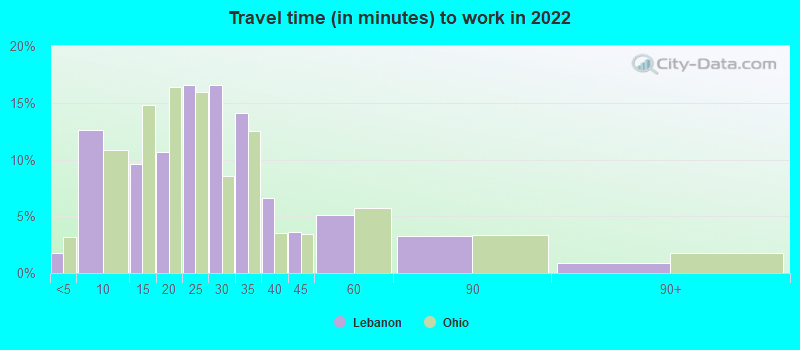
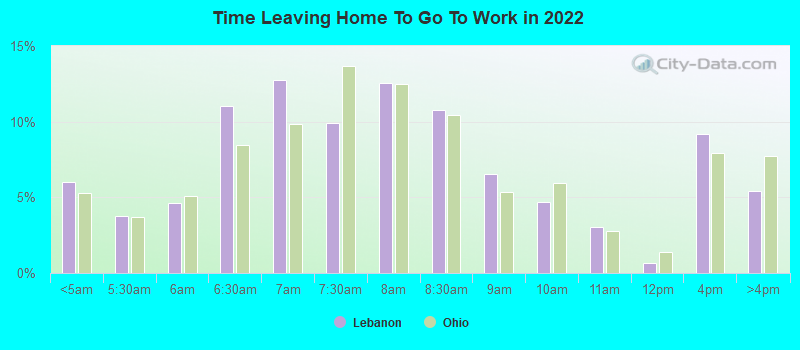
Travel time to work (commute)
- Less than 5 minutes: 240
- 5 to 9 minutes: 1,244
- 10 to 14 minutes: 1,121
- 15 to 19 minutes: 858
- 20 to 24 minutes: 1,054
- 25 to 29 minutes: 1,171
- 30 to 34 minutes: 1,593
- 35 to 39 minutes: 395
- 40 to 44 minutes: 349
- 45 to 59 minutes: 643
- 60 to 89 minutes: 343
- 90 or more minutes: 54
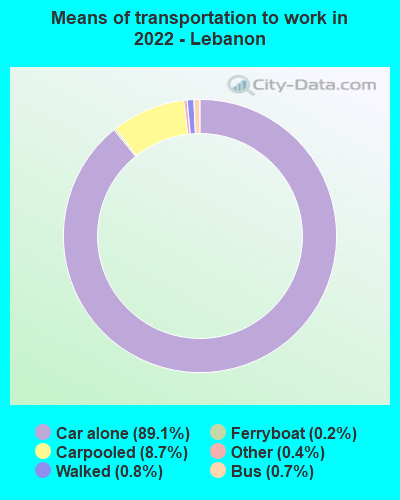
Means of transportation to work:
- Drove a car alone: 10,658 (79.6%)
- Carpooled: 1,126 (8.4%)
- Bus: 77 (0.6%)
- Ferryboat: 12 (0.1%)
- Taxi: 62 (0.5%)
- Walked: 100 (0.7%)
- Worked at home: 1,189 (8.9%)
- Unemployment by race in 2022
- Unemployment rate for White non-Hispanic residents
- 1.3%Males
- 1.5%Females
- Unemployment rate for Black residents
- 23.4%Males
- Unemployment rate for two or more race residents
- 6.4%Females
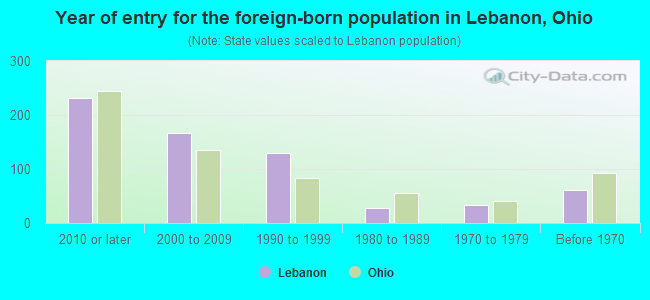
- Year of entry for the foreign-born population in Lebanon, Ohio
- 2322010 or later
- 1672000 to 2009
- 1301990 to 1999
- 271980 to 1989
- 341970 to 1979
- 62Before 1970
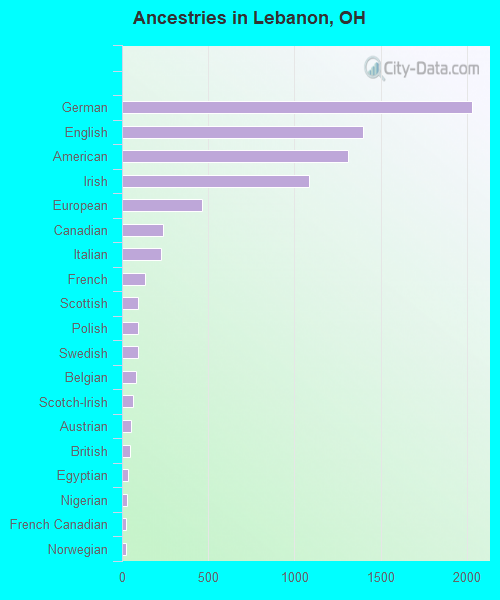
First ancestries reported:
- German: 2,027 (21.8%)
- English: 1,399 (15.1%)
- American: 1,312 (14.1%)
- Irish: 1,086 (11.7%)
- European: 463 (5.0%)
- Canadian: 235 (2.5%)
- Italian: 228 (2.5%)
- French: 131 (1.4%)
- Scottish: 91 (1.0%)
- Polish: 90 (1.0%)
- Swedish: 90 (1.0%)
- Belgian: 80 (0.9%)
- Scotch-Irish: 63 (0.7%)
- Austrian: 51 (0.5%)
- British: 46 (0.5%)
- Egyptian: 32 (0.3%)
- Nigerian: 30 (0.3%)
- French Canadian: 22 (0.2%)
- Norwegian: 21 (0.2%)
- African: 11 (0.1%)
- Russian: 10 (0.1%)
- Hungarian: 9 (0.10%)
- Syrian: 8 (0.09%)
Most common places of birth for foreign-born residents (%):
| Lebanon: | 30.0% (300) |
| Ohio: | 2.6% (14,988) |
| Lebanon: | 22.4% (224) |
| Ohio: | 7.8% (44,796) |
| Lebanon: | 14.7% (147) |
| Ohio: | 11.6% (66,525) |
| Lebanon: | 7.3% (73) |
| Ohio: | 1.6% (9,312) |
| Lebanon: | 7.0% (70) |
| Ohio: | 0.1% (502) |
| Lebanon: | 4.9% (49) |
| Ohio: | 0.7% (3,864) |
| Lebanon: | 4.2% (42) |
| Ohio: | 0.2% (1,210) |
| Lebanon: | 3.7% (37) |
| Ohio: | 1.4% (8,101) |
Place of birth for U.S.-born residents:
- This state: 15,191
- Other state: 5,064
- Northeast: 750
- Midwest: 1,396
- South: 2,050
- West: 912
90.0% of Lebanon residents lived in the same house 1 years ago.
Out of people who lived in different houses, 31.3% lived in this county.
Out of people who lived in different counties, 73.5% lived in Ohio.
| Lebanon: | 90.0% |
| State average: | 87.8% |
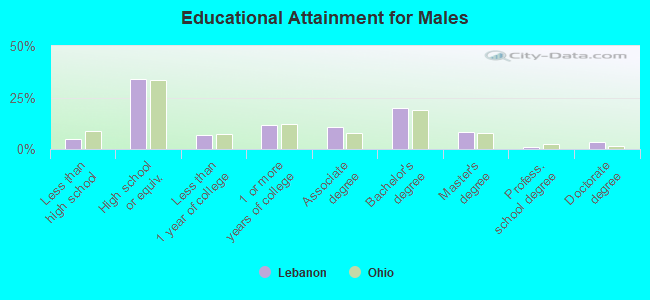
Education attainment for males 25 years and older:
- No schooling: 99
- Nursery to 4th grade: 24
- 5th and 6th grade: 0
- 7th and 8th grade: 10
- 9th grade: 13
- 10th grade: 19
- 11th grade: 92
- 12th grade, no diploma: 66
- High school graduate (or equivalency): 2,337
- Less than 1 year of college: 486
- Some college more than 1 year, no degree: 819
- Associate degree: 732
- Bachelor's degree: 1,392
- Master's degree: 556
- Professional school degree: 56
- Doctorate degree: 220
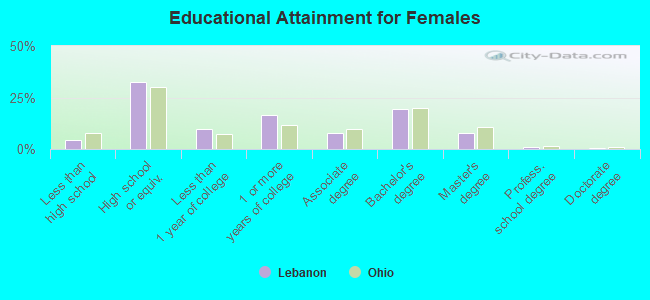
Education attainment for females 25 years and older:
- No schooling: 28
- Nursery to 4th grade: 18
- 5th and 6th grade: 0
- 7th and 8th grade: 50
- 9th grade: 0
- 10th grade: 57
- 11th grade: 104
- 12th grade, no diploma: 85
- High school graduate (or equivalency): 2,467
- Less than 1 year of college: 753
- Some college more than 1 year, no degree: 1,248
- Associate degree: 598
- Bachelor's degree: 1,454
- Master's degree: 584
- Professional school degree: 83
- Doctorate degree: 40
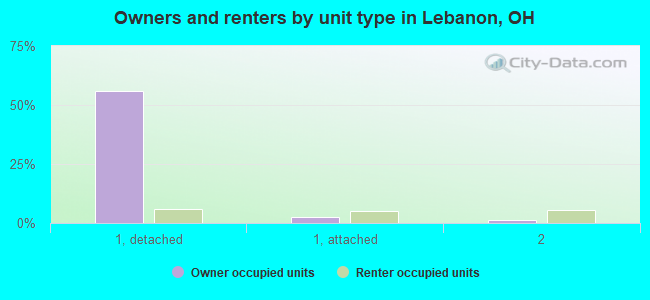
Housing units in structures:
- One, detached: 5,261
- One, attached: 786
- Two: 558
- 3 or 4: 841
- 5 to 9: 718
- 10 to 19: 467
- 20 to 49: 128
- 50 or more: 70
- Mobile homes: 17
Housing units lacking complete kitchen facilities in 2022: 1.8%
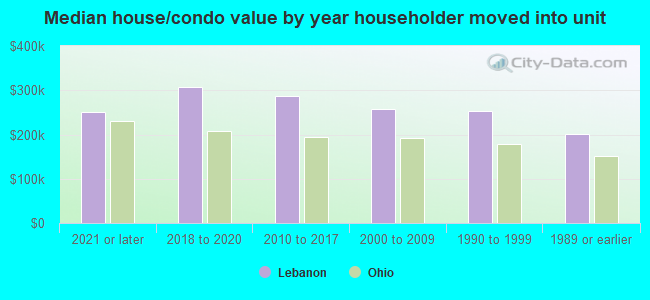
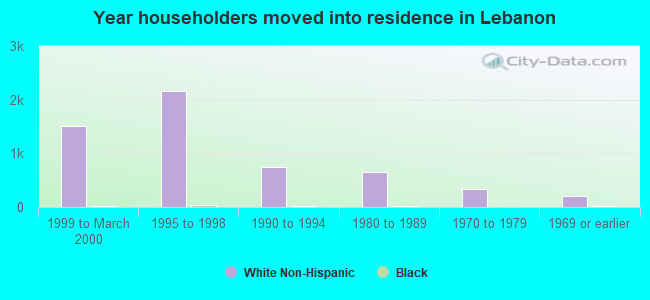
House/condo owner moved in on average 11 years ago
Renter moved in on average 5 years ago
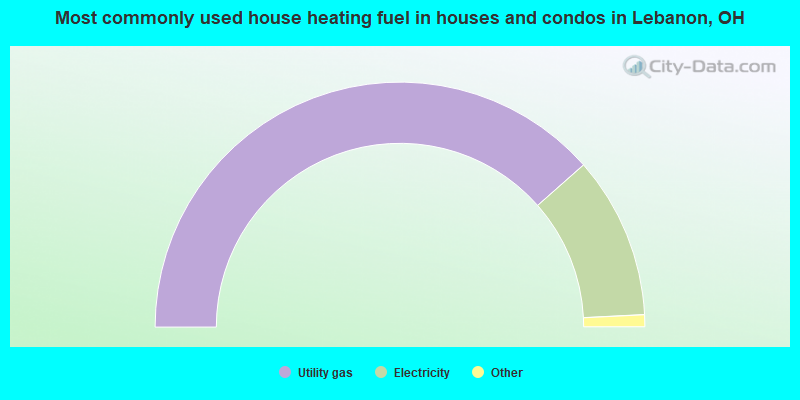
- 77.0%Utility gas
- 21.4%Electricity
- 0.7%Bottled, tank, or LP gas
- 0.7%No fuel used
- 0.2%Fuel oil, kerosene, etc.
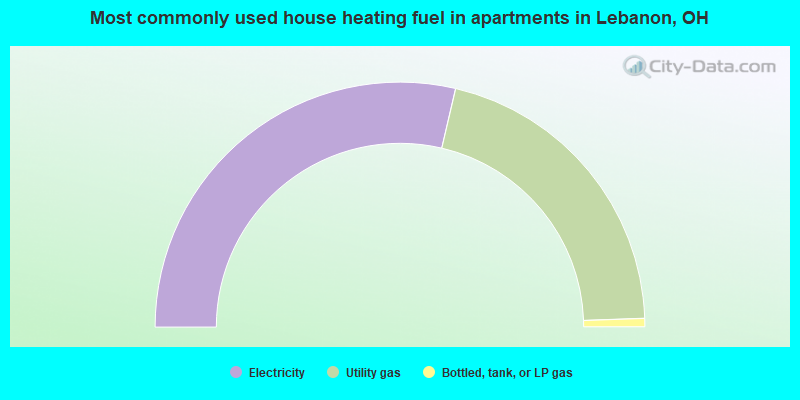
- 57.3%Electricity
- 41.6%Utility gas
- 1.1%Bottled, tank, or LP gas
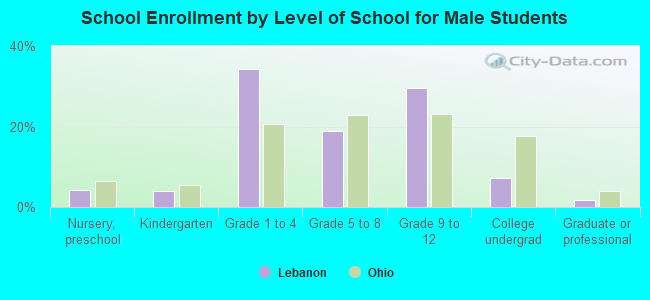
Private vs. public school enrollment:
| Here: | 12.3% |
| Ohio: | 16.0% |
| Here: | 17.4% |
| Ohio: | 13.1% |
| Here: | 25.8% |
| Ohio: | 22.3% |