Leland, ID (Idaho) Houses and Residents
| Leland: | $314,242 |
| Idaho: | $432,500 |
Total population: 391 (Urban population: 0, Rural population: 377 (89 farm, 288 nonfarm))
Houses: 176 (159 occupied: 132 owner occupied, 27 renter occupied)
| % of renters here: | 17% |
| State: | 28% |
Housing density: 3 houses/condos per square mile
Median price asked for vacant for-sale houses and condos in 2022 in this county: $556,410.
Median contract rent in 2022: $390 (lower quartile is $354, upper quartile is $579)
Median rent asked for vacant for-rent units in 2022: $660
Median gross rent in Leland, ID in 2022: $498
Housing units in Leland with a mortgage: 25 (0 second mortgage, 0 home equity loan, 0 both second mortgage and home equity loan)
Houses without a mortgage: 29


Household type by relationship:
Households: 38,299- In family households: 30,768 (7,573 male householders, 2,758 female householders)
7,929 spouses, 9,746 children (8,744 natural, 266 adopted, 736 stepchildren), 775 grandchildren, 264 brothers or sisters, 186 parents, foster children, 299 other relatives, 1,035 non-relatives
- In nonfamily households: 7,531 (2,892 male householders (2,161 living alone)), 3,018 female householders (2,480 living alone)), 1,621 nonrelatives
- In group quarters: 966 (594 institutionalized population)
5,997 married couples with children.
2,070 single-parent households (613 men, 1,457 women).
97.2% of residents of Leland speak English at home.
0.6% of residents speak Spanish at home (100% speak English not well).
2.2% of residents speak other Indo-European language at home (100% speak English very well).
Foreign born population: 8 (1.5%)
(87.5% of them are naturalized citizens)
| Here: | 6.6 |
| State: | 6.5 |
| Here: | 6.1 |
| State: | 4.4 |

- Bedrooms in owner-occupied houses and condos in Leland, Idaho
- 0no bedroom
- 41 bedroom
- 182 bedrooms
- 563 bedrooms
- 494 bedrooms
- 55+ bedrooms

- Bedrooms in renter-occupied apartments in Leland, Idaho
- 0no bedroom
- 21 bedroom
- 142 bedrooms
- 93 bedrooms
- 24 bedrooms
- 05+ bedrooms

- Cars and other vehicles available in Leland in owner-occupied houses/condos
- 0no vehicle
- 231 vehicle
- 592 vehicles
- 303 vehicles
- 174 vehicles
- 35+ vehicles

- Cars and other vehicles available in Leland in renter-occupied apartments
- 0no vehicle
- 21 vehicle
- 122 vehicles
- 93 vehicles
- 44 vehicles
- 05+ vehicles

- Rooms in owner-occupied houses in Leland, Idaho
- 01 room
- 02 rooms
- 63 rooms
- 84 rooms
- 235 rooms
- 296 rooms
- 187 rooms
- 228 rooms
- 269+ rooms

- Rooms in renter-occupied apartments in Leland, Idaho
- 01 room
- 02 rooms
- 23 rooms
- 84 rooms
- 65 rooms
- 56 rooms
- 47 rooms
- 28 rooms
- 09+ rooms


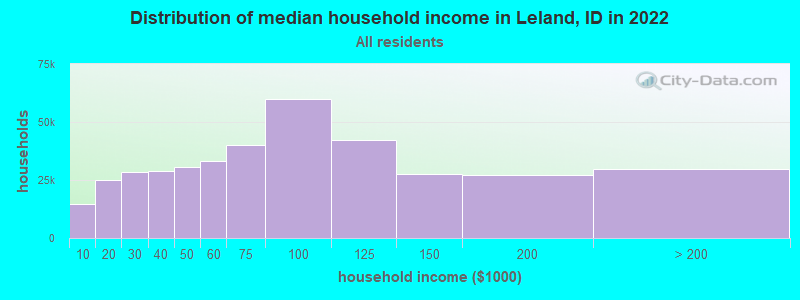
Leland, ID household income distribution

- 9,025Less than $10,000
- 15,236$10,000 to $19,999
- 17,240$20,000 to $29,999
- 18,387$30,000 to $39,999
- 17,872$40,000 to $49,999
- 21,263$50,000 to $59,999
- 25,897$60,000 to $74,999
- 36,926$75,000 to $99,999
- 25,744$100,000 to $124,999
- 13,921$125,000 to $149,999
- 13,723$150,000 to $199,999
- 21,121$200,000 or more
Percentage of workers working in this county: 38.2%
Number of people working at home: 23 (11.3% of all workers)
Travel time to work (commute)
- Less than 5 minutes: 16
- 5 to 9 minutes: 2
- 10 to 14 minutes: 6
- 15 to 19 minutes: 7
- 20 to 24 minutes: 19
- 25 to 29 minutes: 6
- 30 to 34 minutes: 6
- 35 to 39 minutes: 5
- 40 to 44 minutes: 6
- 45 to 59 minutes: 43
- 60 to 89 minutes: 11
- 90 or more minutes: 5
Means of transportation to work:
- Drove a car alone: 106 (70.2%)
- Carpooled: 19 (12.6%)
- Walked: 5 (3.3%)
- Other means: 2 (1.3%)
- Worked at home: 19 (12.6%)


- Year of entry for the foreign-born population in Leland, Idaho
- 01995 to March 2000
- 01990 to 1994
- 21985 to 1989
- 01980 to 1984
- 21975 to 1979
- 01970 to 1974
- 01965 to 1969
- 2Before 1965
Most common places of birth for foreign-born residents (%):
| Leland: | 33.3% (2) |
| Idaho: | 3.5% (2,228) |
| Leland: | 33.3% (2) |
| Idaho: | 0.4% (277) |
| Leland: | 33.3% (2) |
| Idaho: | 0.3% (215) |
Place of birth for U.S.-born residents:
- This state: 194
- Other state: 177
- Northeast: 11
- Midwest: 39
- South: 11
- West: 116
72% of Leland residents lived in the same house 5 years ago.
Out of people who lived in different houses, 18% lived in this county.
Out of people who lived in different counties, 38% lived in Idaho.
Education attainment for males 25 years and older:
- No schooling: 0
- Nursery to 4th grade: 0
- 5th and 6th grade: 0
- 7th and 8th grade: 4
- 9th grade: 2
- 10th grade: 6
- 11th grade: 6
- 12th grade, no diploma: 2
- High school graduate (or equivalency): 49
- Less than 1 year of college: 14
- Some college more than 1 year, no degree: 22
- Associate degree: 17
- Bachelor's degree: 7
- Master's degree: 9
- Professional school degree: 0
- Doctorate degree: 6

Education attainment for females 25 years and older:
- No schooling: 0
- Nursery to 4th grade: 0
- 5th and 6th grade: 0
- 7th and 8th grade: 2
- 9th grade: 6
- 10th grade: 2
- 11th grade: 0
- 12th grade, no diploma: 0
- High school graduate (or equivalency): 52
- Less than 1 year of college: 10
- Some college more than 1 year, no degree: 32
- Associate degree: 6
- Bachelor's degree: 23
- Master's degree: 6
- Professional school degree: 1
- Doctorate degree: 2


Housing units in structures:
- One, detached: 138
- Mobile homes: 38
Median worth of mobile homes: $284,162

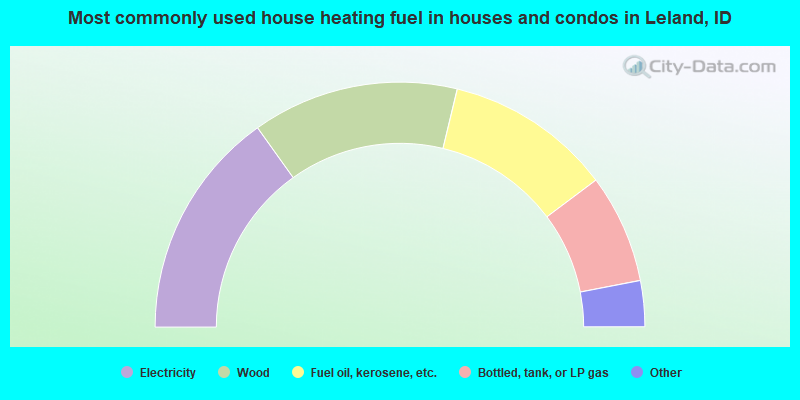
- 30.3%Electricity
- 27.3%Wood
- 22.0%Fuel oil, kerosene, etc.
- 14.4%Bottled, tank, or LP gas
- 3.0%Other fuel
- 1.5%Utility gas
- 1.5%No fuel used
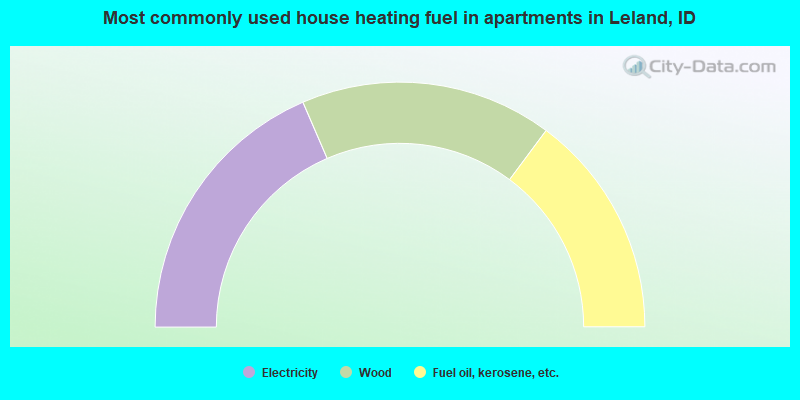
- 37.0%Electricity
- 33.3%Wood
- 29.6%Fuel oil, kerosene, etc.
Private vs. public school enrollment:
| Here: | 0.0% |
| Idaho: | 7.2% |
| Here: | 0.0% |
| Idaho: | 5.7% |
| Here: | 0.0% |
| Idaho: | 22.0% |


