Housing density: 467 houses/condos per square mile
Median price asked for vacant for-sale houses and condos in 2022 in this county: $275,451.
Median contract rent in 2022: $1,145 (lower quartile is $788, upper quartile is $1,555)
Median rent asked for vacant for-rent units in 2022: $1,202
Median gross rent in Lincoln, RI in 2022: $1,293
Housing units in Lincoln with a mortgage: 3,094 (342 second mortgage, 533 home equity loan, 0 both second mortgage and home equity loan) Houses without a mortgage: 1,355
In family households: 482,061 (90,167 male householders, 59,524 female householders)
98,652 spouses, 176,915 children (166,353 natural, 3,940 adopted, 6,622 stepchildren), 11,252 grandchildren, 7,716 brothers or sisters, 7,800 parents, foster children, 8,986 other relatives, 16,700 non-relatives
In nonfamily households: 116,821 (42,422 male householders (31,930 living alone)), 49,604 female householders (41,173 living alone)), 24,795 nonrelatives
In group quarters: 27,785 (9,688 institutionalized population)
87,776 married couples with children.
48,327 single-parent households (7,463 men, 40,864 women).
83.0% of residents of Lincoln speak English at home.
1.4% of residents speak Spanish at home (71% speak English very well, 12% speak English well, 14% speak English not well, 3% don't speak English at all).
12.9% of residents speak other Indo-European language at home (67% speak English very well, 25% speak English well, 7% speak English not well, 1% don't speak English at all).
1.9% of residents speak Asian or Pacific Island language at home (53% speak English very well, 42% speak English well, 5% speak English not well).
0.8% of residents speak other language at home (71% speak English very well, 10% speak English well, 2% speak English not well, 17% don't speak English at all).
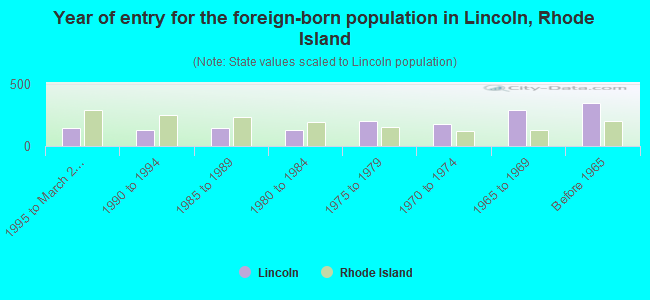
Foreign born population: 2,132 (9.6%)
(84.4% of them are naturalized citizens)
Year of entry for the foreign-born population in Lincoln, Rhode Island
1471995 to March 2000
1321990 to 1994
1481985 to 1989
1311980 to 1984
2021975 to 1979
1761970 to 1974
2891965 to 1969
344Before 1965
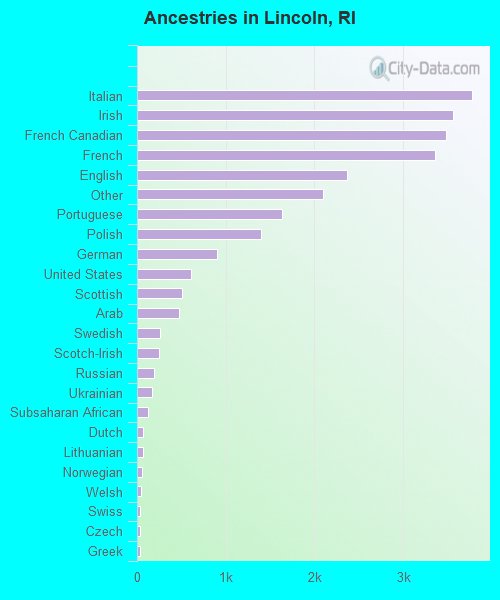
First ancestries reported:
Italian: 3,779 (14.8%)
Irish: 3,561 (13.9%)
French Canadian: 3,485 (13.6%)
French: 3,362 (13.2%)
English: 2,370 (9.3%)
Other: 2,092 (8.2%)
Portuguese: 1,636 (6.4%)
Polish: 1,396 (5.5%)
German: 906 (3.5%)
United States: 614 (2.4%)
Scottish: 509 (2.0%)
Arab: 477 (1.9%)
Swedish: 254 (1.0%)
Scotch-Irish: 249 (1.0%)
Russian: 186 (0.7%)
Ukrainian: 171 (0.7%)
Subsaharan African: 119 (0.5%)
Dutch: 71 (0.3%)
Lithuanian: 68 (0.3%)
Norwegian: 59 (0.2%)
Welsh: 48 (0.2%)
Swiss: 38 (0.1%)
Czech: 36 (0.1%)
Greek: 36 (0.1%)
Danish: 16 (0.06%)
Hungarian: 7 (0.03%)
Slovak: 7 (0.03%)
West Indian: 6 (0.02%)
Most common places of birth for foreign-born residents (%):
Portugal
Lincoln:
24.3% (382)
Rhode Island:
17.6% (21,016)
Canada
Lincoln:
8.6% (135)
Rhode Island:
3.4% (4,015)
China, excluding Hong Kong and Taiwan
Lincoln:
5.5% (86)
Rhode Island:
1.6% (1,954)
Other Western Africa
Lincoln:
5.4% (84)
Rhode Island:
7.0% (8,389)
Turkey
Lincoln:
5.1% (80)
Rhode Island:
0.4% (509)
Germany
Lincoln:
4.0% (63)
Rhode Island:
1.7% (1,982)
United Kingdom
Lincoln:
4.0% (62)
Rhode Island:
2.6% (3,120)
Syria
Lincoln:
3.8% (60)
Rhode Island:
0.4% (510)
Poland
Lincoln:
2.9% (46)
Rhode Island:
1.2% (1,473)
Lebanon
Lincoln:
2.7% (43)
Rhode Island:
0.6% (659)
Cambodia
Lincoln:
2.5% (40)
Rhode Island:
2.8% (3,335)
Laos
Lincoln:
2.4% (38)
Rhode Island:
2.2% (2,602)
Japan
Lincoln:
2.3% (36)
Rhode Island:
0.5% (640)
Other Eastern Europe
Lincoln:
2.2% (34)
Rhode Island:
0.7% (789)
Korea
Lincoln:
2.0% (31)
Rhode Island:
1.2% (1,404)
Philippines
Lincoln:
2.0% (31)
Rhode Island:
1.6% (1,936)
Italy
Lincoln:
1.8% (29)
Rhode Island:
3.8% (4,502)
Pakistan
Lincoln:
1.5% (24)
Rhode Island:
0.2% (256)
Place of birth for U.S.-born residents:
This state: 15,386
Other state: 3,825
Northeast: 2,675
Midwest: 497
South: 413
West: 240
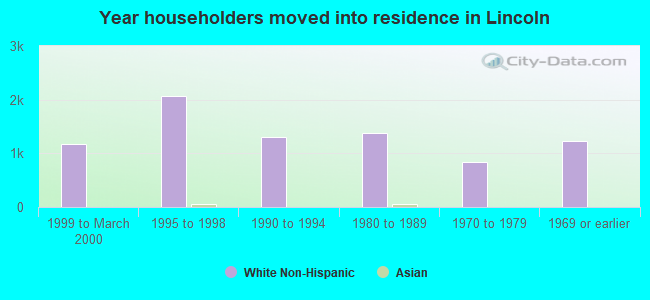
61% of Lincoln residents lived in the same house 5 years ago. Out of people who lived in different houses, 80% lived in this county. Out of people who lived in different counties, 21% lived in Rhode Island.
Education attainment for males 25 years and older:
No schooling: 42
Nursery to 4th grade: 41
5th and 6th grade: 125
7th and 8th grade: 251
9th grade: 262
10th grade: 233
11th grade: 85
12th grade, no diploma: 215
High school graduate (or equivalency): 1,592
Less than 1 year of college: 383
Some college more than 1 year, no degree: 763
Associate degree: 462
Bachelor's degree: 1,192
Master's degree: 589
Professional school degree: 291
Doctorate degree: 67
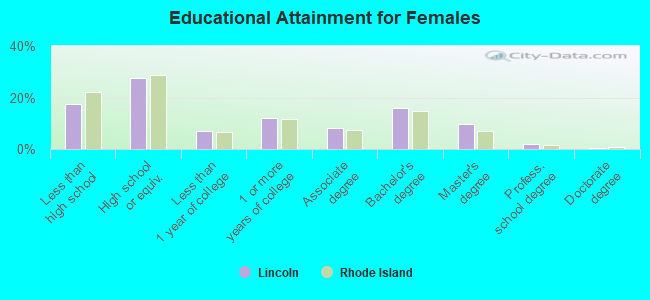
Education attainment for females 25 years and older:
No schooling: 51
Nursery to 4th grade: 70
5th and 6th grade: 84
7th and 8th grade: 376
9th grade: 322
10th grade: 162
11th grade: 149
12th grade, no diploma: 170
High school graduate (or equivalency): 2,158
Less than 1 year of college: 561
Some college more than 1 year, no degree: 937
Associate degree: 640
Bachelor's degree: 1,240
Master's degree: 755
Professional school degree: 156
Doctorate degree: 38
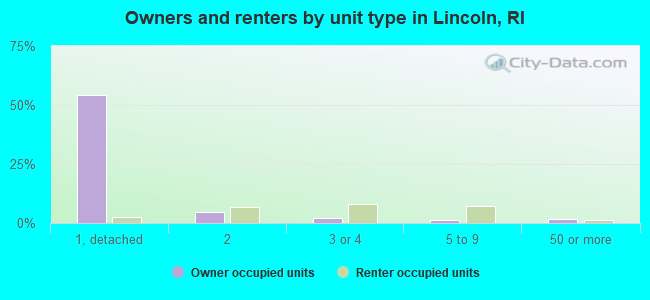
Housing units in structures:
One, detached: 4,772
One, attached: 155
Two: 1,015
3 or 4: 940
5 to 9: 689
10 to 19: 348
20 to 49: 315
50 or more: 222
Mobile homes: 52
Median worth of mobile homes: $144,537
Housing units lacking complete plumbing facilities: 0.4%
Housing units lacking complete kitchen facilities: 0.3%