Lindenwold, NJ (New Jersey) Houses and Residents
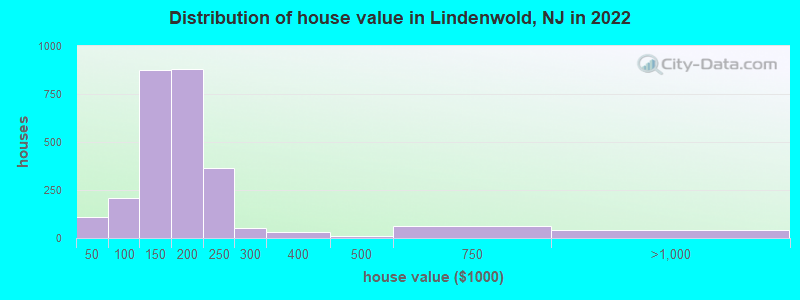
Estimated median house or condo value in 2022: $174,720 (it was $83,100 in 2000 )
Lindenwold:
$174,720New Jersey:
$428,900
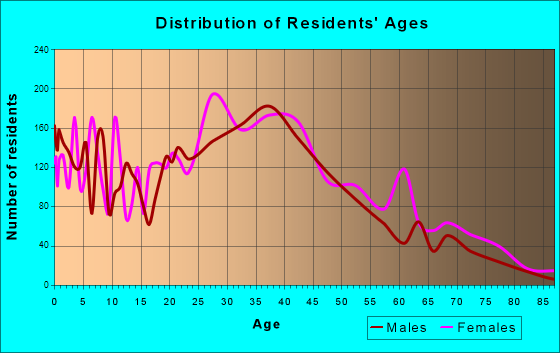
Lower value quartile - upper value quartile: $132,322 - $203,956Total population: 17,417 (Urban population: 17,414, Rural population: 0)
Houses: 9,666 (9,083 occupied: 3,321 owner occupied, 5,921 renter occupied )
% of renters here:
64%State:
35%
Housing density: 2,451 houses/condos per square mile
Median price asked for vacant for-sale houses and condos in 2022: $156,007.
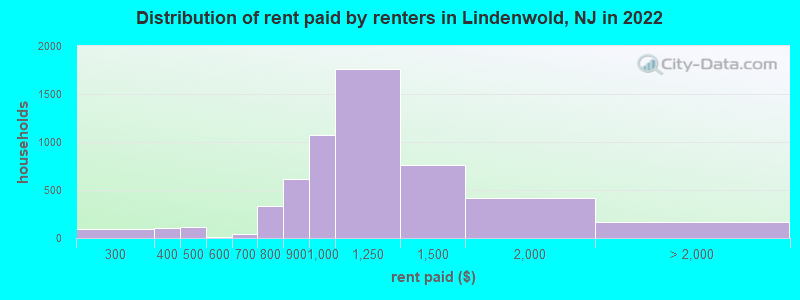
Median contract rent in 2022: $1,013 (lower quartile is $840, upper quartile is $1,204)
Median rent asked for vacant for-rent units in 2022: $969
Median gross rent in Lindenwold, NJ in 2022: $1,182
Housing units in Lindenwold with a mortgage: 2,153 (186 second mortgage, 47 home equity loan, 114 both second mortgage and home equity loan )Houses without a mortgage: 117
Median household income for houses/condos with a mortgage: $81,614
Median household income for apartments without a mortgage: $88,869
Median monthly housing costs: $1,194
Data:
Median house or condo value ($)
Median house or condo value ($ change since 2000)
Median house or condo value ($) - White
Median house or condo value ($) - Black or African American
Median house or condo value ($) - Asian
Median house or condo value ($) - Hispanic or Latino
Median house or condo value ($) - American Indian and Alaska Native
Median house or condo value ($) - Multirace
Median house or condo value ($) - Other Race
Median price asked for mobile homes ($)
Household density (households per square mile)
Mean house or condo value by units in structure - 1, detached ($)
Mean house or condo value by units in structure - 1, attached ($)
Mean house or condo value by units in structure - 2 ($)
Mean house or condo value by units in structure by units in structure - 3 or 4 ($)
Mean house or condo value by units in structure - 5 or more ($)
Mean house or condo value by units in structure - Boat, RV, van, etc. ($)
Mean house or condo value by units in structure - Mobile home ($)
Median contract rent ($)
Median contract rent - Lower quartile ($)
Median contract rent - Upper quartile ($)
Median gross rent ($)
Urban houses (%)
Rural houses (%)
Houses occupied (%)
Houses occupied (% change since 2000)
Houses owner occupied (%)
Houses owner occupied (% change since 2000)
Houses renter occupied (%)
Houses renter occupied (% change since 2000)
Vacant housing units - For rent (%)
Vacant housing units - For rent (% change since 2000)
Vacant housing units - For sale only (%)
Vacant housing units - For sale only (% change since 2000)
Vacant housing units - Rented or sold, not occupied (%)
Vacant housing units - Rented or sold, not occupied (% change since 2000)
Vacant housing units - For seasonal, recreational, or occasional use (%)
Vacant housing units - For seasonal, recreational, or occasional use (% change since 2000)
Vacant housing units - For migrant workers (%)
Vacant housing units - For migrant workers (% change since 2000)
Vacant housing units - Other vacant (%)
Vacant housing units - Other vacant (% change since 2000)
Median monthly housing costs ($)
Median household income for houses/condos with a mortgage ($)
Median household income for houses/condos without a mortgage ($)
Median household income ($)
Median household income ($) - White
Median household income ($) - Black or African American
Median household income ($) - Asian
Median household income ($) - Hispanic or Latino
Median household income ($) - American Indian and Alaska Native
Median household income ($) - Multirace
Median household income ($) - Other Race
Mortgage status - with mortgage (%)
Mortgage status - with second mortgage (%)
Mortgage status - with home equity loan (%)
Mortgage status - with both second mortgage and home equity loan (%)
Mortgage status - without a mortgage (%)
Median year house/condo built
Median year apartment built
Household type by relationship - Male householder living alone (%)
Household type by relationship - Male householder not living alone (%)
Household type by relationship - Female householder living alone (%)
Household type by relationship - Female householder not living alone (%)
Household type by relationship - Opposite-Sex spouse (%)
Household type by relationship - Same-Sex spouse (%)
Household type by relationship - Opposite-Sex unmarried partner (%)
Household type by relationship - Same-Sex unmarried partner (%)
Household type by relationship - In group quarters (%)
Size of family households - 2-person household (%)
Size of family households - 3-person household (%)
Size of family households - 4-person household (%)
Size of family households - 5-person household (%)
Size of family households - 6-person household (%)
Size of family households - 7-or-more-person household (%)
Size of nonfamily households - 1-person household (%)
Size of nonfamily households - 2-person household (%)
Size of nonfamily households - 3-person household (%)
Size of nonfamily households - 4-person household (%)
Size of nonfamily households - 5-person household (%)
Size of nonfamily households - 6-person household (%)
Size of nonfamily households - 7-or-moreperson household (%)
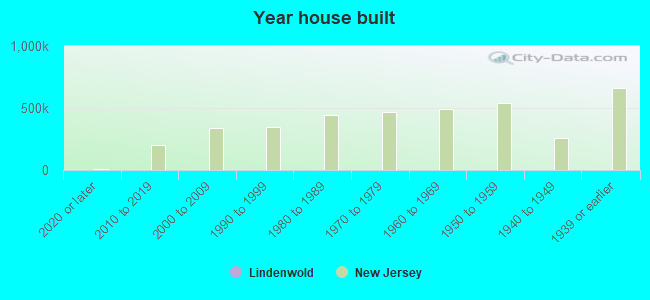
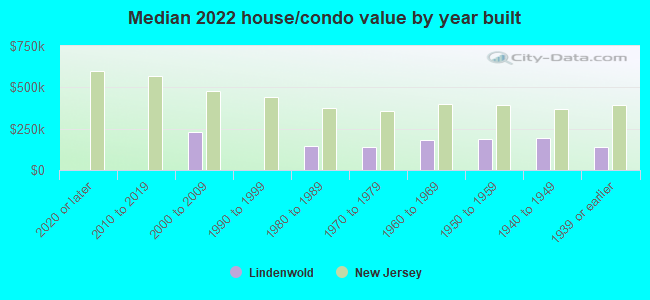
Year house built - Built 2010 or later (%)
Year house built - Built 2000 to 2009 (%)
Year house built - Built 1990 to 1999 (%)
Year house built - Built 1980 to 1989 (%)
Year house built - Built 1970 to 1979 (%)
Year house built - Built 1960 to 1969 (%)
Year house built - Built 1950 to 1959 (%)
Year house built - Built 1940 to 1949 (%)
Year house built - Built 1939 or earlier (%)
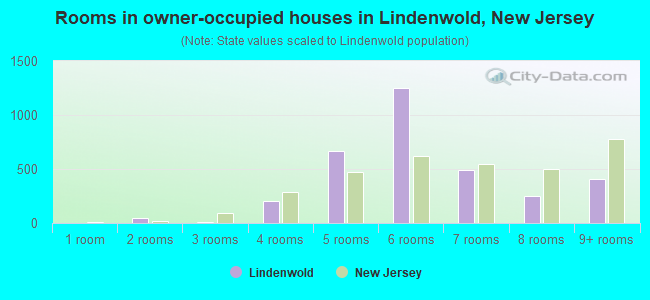
Median number of rooms in houses and condos
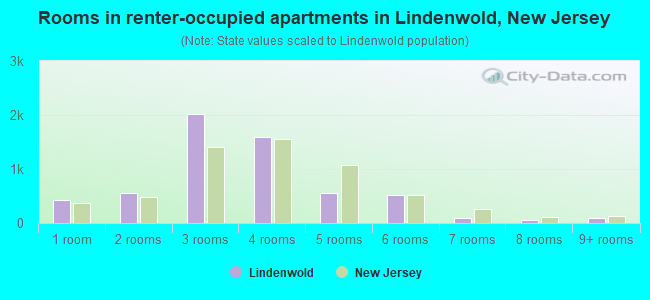
Median number of rooms in apartments
Median number of bedrooms in owner occupied houses
Mean number of bedrooms in owner occupied houses
Median number of bedrooms in renter occupied houses
Mean number of bedrooms in renter occupied houses
Median number of vehichles in owner occupied houses
Mean number of vehichles in owner occupied houses
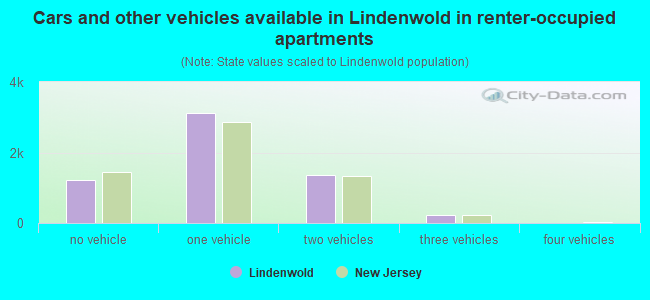
Median number of vehichles in renter occupied houses
Mean number of vehichles in renter occupied houses
Rooms in owner-occupied houses - 1 room (%)
Rooms in owner-occupied houses - 2 rooms (%)
Rooms in owner-occupied houses - 3 rooms (%)
Rooms in owner-occupied houses - 4 rooms (%)
Rooms in owner-occupied houses - 5 rooms (%)
Rooms in owner-occupied houses - 6 rooms (%)
Rooms in owner-occupied houses - 7 rooms (%)
Rooms in owner-occupied houses - 8 rooms (%)
Rooms in owner-occupied houses - 9+ rooms (%)
Rooms in renter-occupied houses - 1 room (%)
Rooms in renter-occupied houses - 2 rooms (%)
Rooms in renter-occupied houses - 3 rooms (%)
Rooms in renter-occupied houses - 4 rooms (%)
Rooms in renter-occupied houses - 5 rooms (%)
Rooms in renter-occupied houses - 6 rooms (%)
Rooms in renter-occupied houses - 7 rooms (%)
Rooms in renter-occupied houses - 8 rooms (%)
Rooms in renter-occupied houses - 9+ rooms (%)
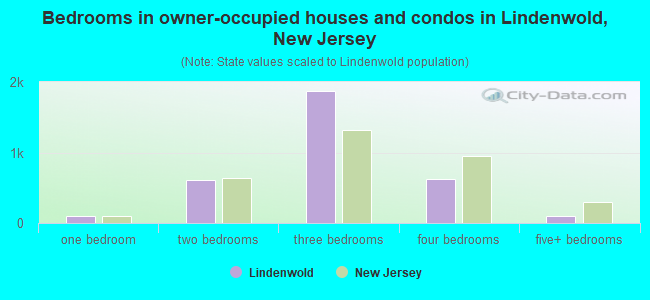
Bedrooms in owner-occupied houses - no bedrooms (%)
Bedrooms in owner-occupied houses - 1 bedroom (%)
Bedrooms in owner-occupied houses - 2 bedrooms (%)
Bedrooms in owner-occupied houses - 3 bedrooms (%)
Bedrooms in owner-occupied houses - 4 bedrooms (%)
Bedrooms in owner-occupied houses - 5+ bedrooms (%)
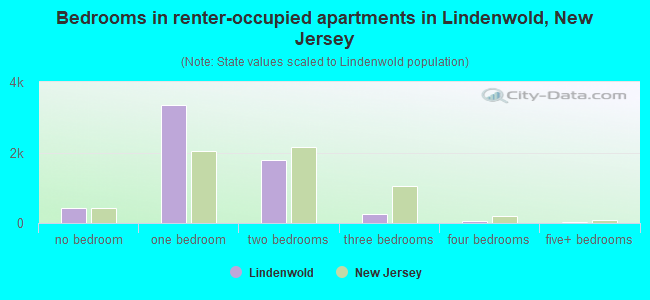
Bedrooms in renter-occupied houses - no bedrooms (%)
Bedrooms in renter-occupied houses - 1 bedroom (%)
Bedrooms in renter-occupied houses - 2 bedrooms (%)
Bedrooms in renter-occupied houses - 3 bedrooms (%)
Bedrooms in renter-occupied houses - 4 bedrooms (%)
Bedrooms in renter-occupied houses - 5+ bedrooms (%)
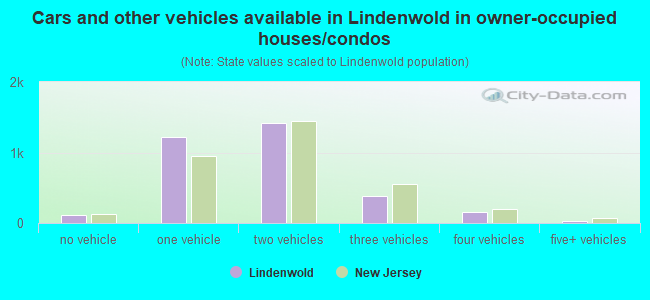
Vehicles available in owner-occupied houses - no vehicle available (%)
Vehicles available in owner-occupied houses - 1 vehicle available(%)
Vehicles available in owner-occupied houses - 2 Vehicles available (%)
Vehicles available in owner-occupied houses - 3 Vehicles available (%)
Vehicles available in owner-occupied houses - 4 Vehicles available (%)
Vehicles available in owner-occupied houses - 5+ Vehicles available (%)
Vehicles available in renter-occupied houses - no vehicle available (%)
Vehicles available in renter-occupied houses - 1 vehicle available (%)
Vehicles available in renter-occupied houses - 2 Vehicles available (%)
Vehicles available in renter-occupied houses - 3 Vehicles available (%)
Vehicles available in renter-occupied houses - 4 Vehicles available (%)
Vehicles available in renter-occupied houses - 5+ Vehicles available (%)
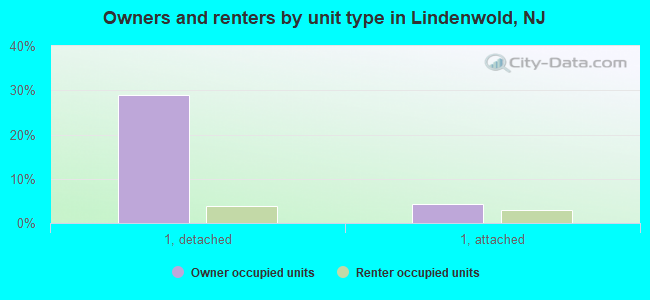
Housing units in structures - 1, detached (%)
Housing units in structures - 1, attached (%)
Housing units in structures - 2 (%)
Housing units in structures - 3 or 4 (%)
Housing units in structures - 5 to 9 (%)
Housing units in structures - 10 to 19 (%)
Housing units in structures - 20 to 49 (%)
Housing units in structures - 50 or more (%)
Housing units in structures - Mobile home (%)
Housing units in structures - Boat, RV, van, etc. (%)
Housing units in structures - Owners - 1, detached (%)
Housing units in structures - Owners - 1, attached (%)
Housing units in structures - Owners - 2 (%)
Housing units in structures - Owners - 3 or 4 (%)
Housing units in structures - Owners - 5 to 9 (%)
Housing units in structures - Owners - 10 to 19 (%)
Housing units in structures - Owners - 20 to 49 (%)
Housing units in structures - Owners - 50 or more (%)
Housing units in structures - Owners - Mobile home (%)
Housing units in structures - Owners - Boat, RV, van, etc. (%)
Housing units in structures - Renters - 1, detached (%)
Housing units in structures - Renters - 1, attached (%)
Housing units in structures - Renters - 2 (%)
Housing units in structures - Renters - 3 or 4 (%)
Housing units in structures - Renters - 5 to 9 (%)
Housing units in structures - Renters - 10 to 19 (%)
Housing units in structures - Renters - 20 to 49 (%)
Housing units in structures - Renters - 50 or more (%)
Housing units in structures - Renters - Mobile home (%)
Housing units in structures - Renters - Boat, RV, van, etc. (%)
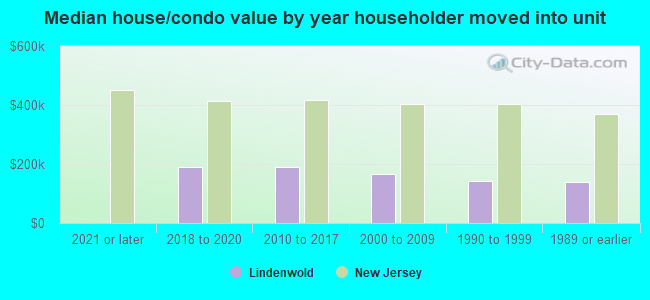
House/condo owner moved in on average (years ago)
Renter moved in on average (years ago)
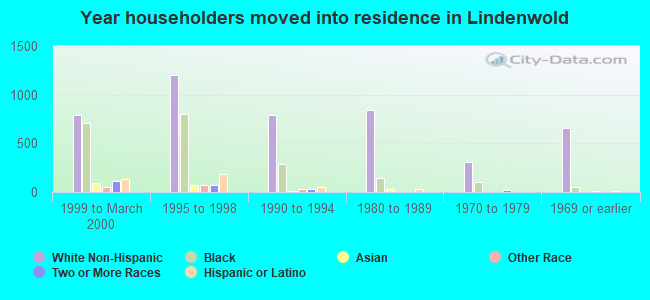
Year householder moved into unit - Moved in 1999 to March 2000 (%)
Year householder moved into unit - Moved in 1999 to March 2000 (%) - White
Year householder moved into unit - Moved in 1999 to March 2000 (%) - Black or African American
Year householder moved into unit - Moved in 1999 to March 2000 (%) - Asian
Year householder moved into unit - Moved in 1999 to March 2000 (%) - Hispanic or Latino
Year householder moved into unit - Moved in 1999 to March 2000 (%) - American Indian and Alaska Native
Year householder moved into unit - Moved in 1999 to March 2000 (%) - Multirace
Year householder moved into unit - Moved in 1999 to March 2000 (%) - Other Race
Year householder moved into unit - Moved in 1995 to 1998 (%)
Year householder moved into unit - Moved in 1995 to 1998 (%) - White
Year householder moved into unit - Moved in 1995 to 1998 (%) - Black or African American
Year householder moved into unit - Moved in 1995 to 1998 (%) - Asian
Year householder moved into unit - Moved in 1995 to 1998 (%) - Hispanic or Latino
Year householder moved into unit - Moved in 1995 to 1998 (%) - American Indian and Alaska Native
Year householder moved into unit - Moved in 1995 to 1998 (%) - Multirace
Year householder moved into unit - Moved in 1995 to 1998 (%) - Other Race
Year householder moved into unit - Moved in 1990 to 1994 (%)
Year householder moved into unit - Moved in 1990 to 1994 (%) - White
Year householder moved into unit - Moved in 1990 to 1994 (%) - Black or African American
Year householder moved into unit - Moved in 1990 to 1994 (%) - Asian
Year householder moved into unit - Moved in 1990 to 1994 (%) - Hispanic or Latino
Year householder moved into unit - Moved in 1990 to 1994 (%) - American Indian and Alaska Native
Year householder moved into unit - Moved in 1990 to 1994 (%) - Multirace
Year householder moved into unit - Moved in 1990 to 1994 (%) - Other Race
Year householder moved into unit - Moved in 1980 to 1989 (%)
Year householder moved into unit - Moved in 1980 to 1989 (%) - White
Year householder moved into unit - Moved in 1980 to 1989 (%) - Black or African American
Year householder moved into unit - Moved in 1980 to 1989 (%) - Asian
Year householder moved into unit - Moved in 1980 to 1989 (%) - Hispanic or Latino
Year householder moved into unit - Moved in 1980 to 1989 (%) - American Indian and Alaska Native
Year householder moved into unit - Moved in 1980 to 1989 (%) - Multirace
Year householder moved into unit - Moved in 1980 to 1989 (%) - Other Race
Year householder moved into unit - Moved in 1970 to 1979 (%)
Year householder moved into unit - Moved in 1970 to 1979 (%) - White
Year householder moved into unit - Moved in 1970 to 1979 (%) - Black or African American
Year householder moved into unit - Moved in 1970 to 1979 (%) - Asian
Year householder moved into unit - Moved in 1970 to 1979 (%) - Hispanic or Latino
Year householder moved into unit - Moved in 1970 to 1979 (%) - American Indian and Alaska Native
Year householder moved into unit - Moved in 1970 to 1979 (%) - Multirace
Year householder moved into unit - Moved in 1970 to 1979 (%) - Other Race
Year householder moved into unit - Moved in 1969 or earlier (%)
Year householder moved into unit - Moved in 1969 or earlier (%) - White
Year householder moved into unit - Moved in 1969 or earlier (%) - Black or African American
Year householder moved into unit - Moved in 1969 or earlier (%) - Asian
Year householder moved into unit - Moved in 1969 or earlier (%) - Hispanic or Latino
Year householder moved into unit - Moved in 1969 or earlier (%) - American Indian and Alaska Native
Year householder moved into unit - Moved in 1969 or earlier (%) - Multirace
Year householder moved into unit - Moved in 1969 or earlier (%) - Other Race
Housing units lacking complete plumbing facilities (%)
Housing units lacking complete kitchen facilities (%)
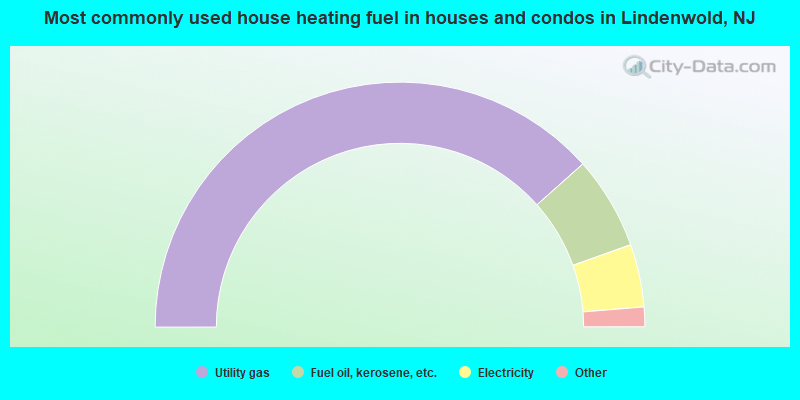
House heating fuel used in houses and condos - Utility gas (%)
House heating fuel used in houses and condos - Bottled, tank, or LP gas (%)
House heating fuel used in houses and condos - Electricity (%)
House heating fuel used in houses and condos - Fuel oil, kerosene, etc. (%)
House heating fuel used in houses and condos - Coal or coke (%)
House heating fuel used in houses and condos - Wood (%)
House heating fuel used in houses and condos - Solar energy (%)
House heating fuel used in houses and condos - Other fuel (%)
House heating fuel used in houses and condos - No fuel used (%)
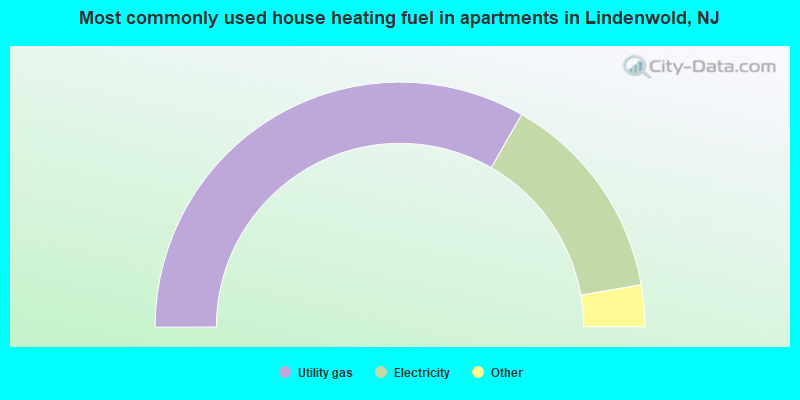
House heating fuel used in apartments - Utility gas (%)
House heating fuel used in apartments - Bottled, tank, or LP gas (%)
House heating fuel used in apartments - Electricity (%)
House heating fuel used in apartments - Fuel oil, kerosene, etc. (%)
House heating fuel used in apartments - Coal or coke (%)
House heating fuel used in apartments - Wood (%)
House heating fuel used in apartments - Solar energy (%)
House heating fuel used in apartments - Other fuel (%)
House heating fuel used in apartments - No fuel used (%)
Latest news about housing in Lindenwold, NJ collected exclusively by city-data.com from local newspapers, TV, and radio stations
Median year house/condo built: 1962Median year apartment built: 1972Household type by relationship:
Households: 21,431
Male householders: 4,808 (1,606 living alone ), Female householders: 4,258 (1,621 living alone )2,770 spouses (2,681 opposite-sex spouses ), 1,190 unmarried partners , (1,152 opposite-sex unmarried partners ), 6,161 children (5,668 natural , 252 adopted , 241 stepchildren ), 376 grandchildren , 383 brothers or sisters , 395 parents , 34 foster children , 603 other relatives , 434 non-relatives In group quarters: 14
Size of family households: 2,077 2-persons , 942 3-persons , 1,183 4-persons , 246 5-persons , 182 6-persons , 179 7-or-more-persons .
Size of nonfamily households: 3,268 1-person , 1,135 2-persons , 21 3-persons , 4 4-persons .
2,500 married couples with children. single-parent households (118 men , 1,635 women ).
69.0% of residents of Lindenwold speak English at home. of residents speak Spanish at home (42% speak English very well , 26% speak English well , 25% speak English not well , 6% don't speak English at all ).of residents speak other Indo-European language at home (38% speak English very well , 19% speak English well , 43% don't speak English at all ).of residents speak Asian or Pacific Island language at home (32% speak English very well , 42% speak English well , 2% speak English not well , 23% don't speak English at all ).of residents speak other language at home (70% speak English very well , 30% speak English well ).
Foreign born population: 4,742 (22.1%)of them are naturalized citizens )
Median number of rooms in houses and condos:
Median number of rooms in apartments
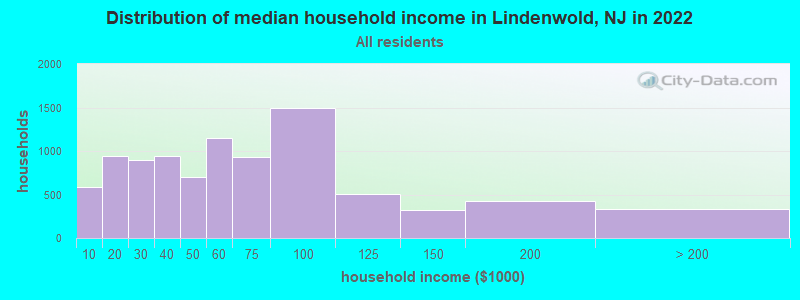
Lindenwold, NJ household income distribution 586 Less than $10,000942 $10,000 to $19,999899 $20,000 to $29,999939 $30,000 to $39,999699 $40,000 to $49,9991,153 $50,000 to $59,999930 $60,000 to $74,9991,490 $75,000 to $99,999501 $100,000 to $124,999323 $125,000 to $149,999420 $150,000 to $199,999333 $200,000 or more
Home value of owner - occupied houses in 2022 in Lindenwold, NJ 26 Less than $10,0003 $10,000 to $14,99922 $20,000 to $24,99932 $25,000 to $29,99924 $30,000 to $34,9995 $60,000 to $69,99959 $70,000 to $79,99952 $80,000 to $89,99991 $90,000 to $99,999485 $100,000 to $124,999391 $125,000 to $149,999455 $150,000 to $174,999426 $175,000 to $199,999365 $200,000 to $249,99953 $250,000 to $299,99930 $300,000 to $399,9997 $400,000 to $499,99965 $500,000 to $749,99944 $750,000 to $999,999Rent paid by renters in 2022 in Lindenwold, NJ 98 $250 to $29915 $300 to $34989 $350 to $399115 $450 to $49911 $500 to $54940 $650 to $69957 $700 to $749273 $750 to $799611 $800 to $8991,069 $900 to $9991,758 $1,000 to $1,249765 $1,250 to $1,499413 $1,500 to $1,99950 $2,500 to $2,999114 No cash rent
Percentage of workers working in this county: 72.4%Number of people working at home: 517 (4.6% of all workers )
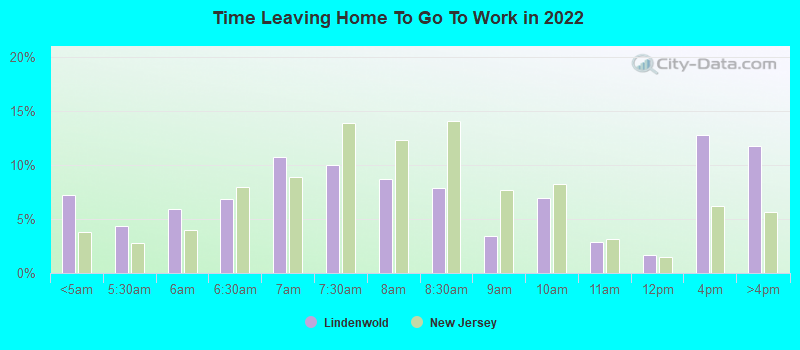
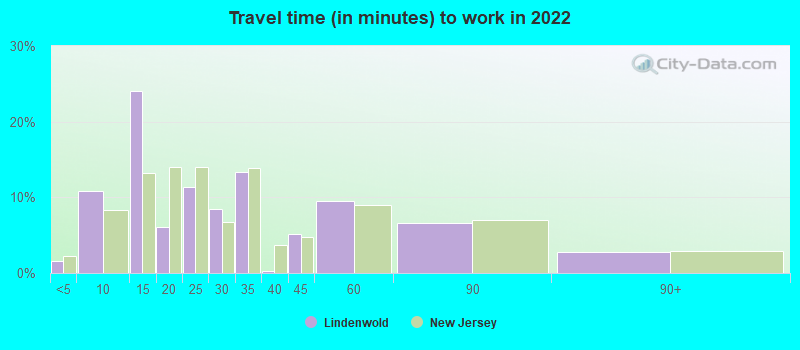
Travel time to work (commute)
Less than 5 minutes: 2085 to 9 minutes: 63210 to 14 minutes: 2,13915 to 19 minutes: 1,02020 to 24 minutes: 1,54325 to 29 minutes: 36930 to 34 minutes: 1,87235 to 39 minutes: 36140 to 44 minutes: 56245 to 59 minutes: 74560 to 89 minutes: 63290 or more minutes: 297
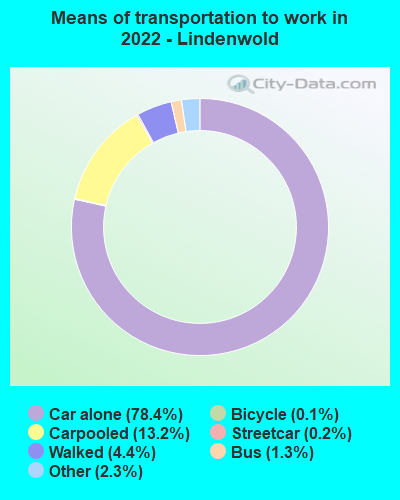
Means of transportation to work:
Drove a car alone: 1,528 (59.9%)Carpooled: 339 (13.3%)Bus : 31 (1.2%)Subway or elevated rail : 4 (0.2%)Taxi: 69 (2.7%)Bicycle: 3 (0.1%)Walked: 122 (4.8%)Worked at home: 517 (20.3%)
Unemployment by race in 2022
Unemployment rate for White non-Hispanic residents 3.2% Males3.1% FemalesUnemployment rate for Black residents 1.2% Males1.1% FemalesUnemployment rate for other race residents 4.2% Males9.2% FemalesUnemployment rate for two or more race residents 1.2% FemalesUnemployment rate for Hispanic or Latino residents 3.8% Males3.3% Females
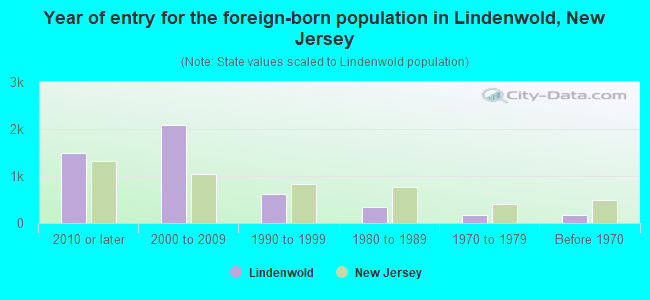
Year of entry for the foreign-born population in Lindenwold, New Jersey
1,491 2010 or later 2,080 2000 to 2009 619 1990 to 1999 344 1980 to 1989 167 1970 to 1979 160 Before 1970
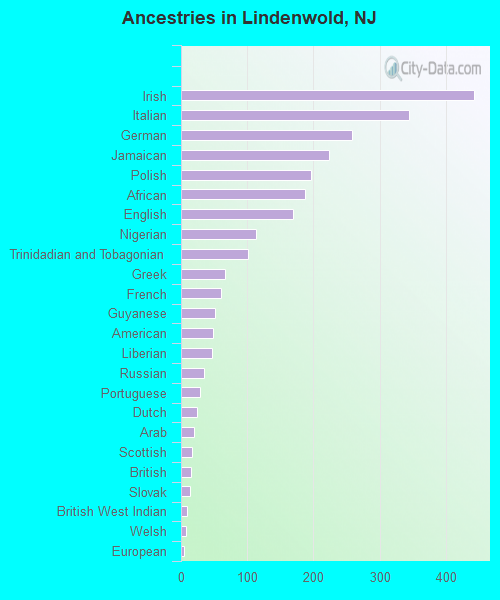
First ancestries reported:
Irish: 443 (3.6%)
Italian: 344 (2.8%)
German: 258 (2.1%)
Jamaican: 224 (1.8%)
Polish: 197 (1.6%)
African: 188 (1.5%)
English: 169 (1.4%)
Nigerian: 114 (0.9%)
Trinidadian and Tobagonian: 101 (0.8%)
Greek: 66 (0.5%)
French: 60 (0.5%)
Guyanese: 52 (0.4%)
American: 49 (0.4%)
Liberian: 47 (0.4%)
Russian: 34 (0.3%)
Portuguese: 29 (0.2%)
Dutch: 24 (0.2%)
Arab: 19 (0.2%)
Scottish: 16 (0.1%)
British: 15 (0.1%)
Slovak: 13 (0.1%)
British West Indian: 9 (0.07%)
Welsh: 8 (0.06%)
European: 5 (0.04%)
Scotch-Irish: 3 (0.02%) Most common places of birth for foreign-born residents (%): El Salvador Lindenwold:
17.4% (809)New Jersey:
2.3% (48,885)
Mexico Lindenwold:
13.2% (611)New Jersey:
4.8% (102,527)
Honduras Lindenwold:
13.0% (605)New Jersey:
1.7% (37,335)
Dominican Republic Lindenwold:
12.1% (560)New Jersey:
9.7% (209,055)
Jamaica Lindenwold:
4.9% (227)New Jersey:
2.2% (47,365)
Philippines Lindenwold:
3.9% (181)New Jersey:
4.0% (85,934)
Peru Lindenwold:
3.7% (173)New Jersey:
2.7% (58,563)
Vietnam Lindenwold:
3.0% (138)New Jersey:
0.7% (15,644)
Nigeria Lindenwold:
2.8% (130)New Jersey:
1.2% (25,213)
China, excluding Hong Kong and Taiwan Lindenwold:
2.7% (124)New Jersey:
3.7% (78,969)
Guyana Lindenwold:
2.5% (116)New Jersey:
1.2% (26,173)
Grenada Lindenwold:
2.3% (105)New Jersey:
0.1% (1,602)
Colombia Lindenwold:
1.8% (85)New Jersey:
4.2% (90,817)
Liberia Lindenwold:
1.8% (82)New Jersey:
0.4% (8,533)
India Lindenwold:
1.7% (80)New Jersey:
12.8% (274,609)
Place of birth for U.S.-born residents:
This state: 11,205Other state: 4,983Northeast: 3,827Midwest: 94South: 922West: 101 88.2% of Lindenwold residents lived in the same house 1 years ago.
Out of people who lived in different houses, 40.5% lived in this county.
Out of people who lived in different counties, 46.8% lived in New Jersey.
Lindenwold:
88.2%State average:
90.4%
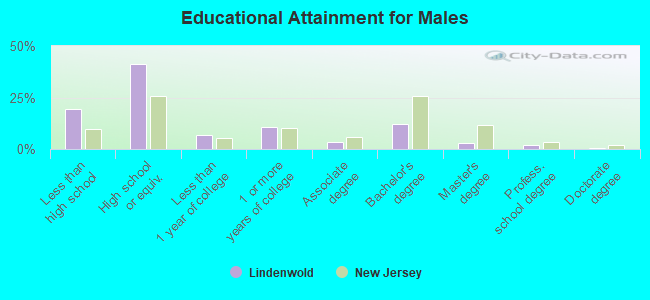
Education attainment for males 25 years and older:
No schooling: 209Nursery to 4th grade: 325th and 6th grade: 2107th and 8th grade: 739th grade: 47610th grade: 23911th grade: 3912th grade, no diploma: 146High school graduate (or equivalency): 2,977Less than 1 year of college: 507Some college more than 1 year, no degree: 784Associate degree: 259Bachelor's degree: 894Master's degree: 208Professional school degree: 147Doctorate degree: 51
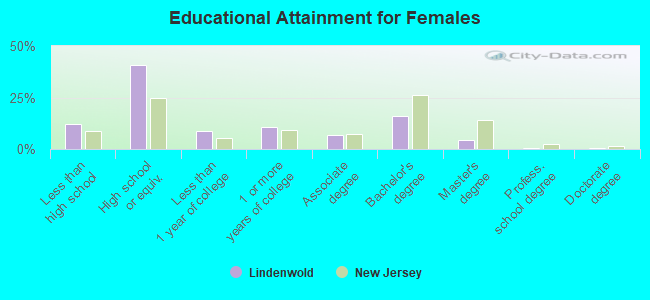
Education attainment for females 25 years and older:
No schooling: 142Nursery to 4th grade: 355th and 6th grade: 1437th and 8th grade: 399th grade: 23710th grade: 2111th grade: 14412th grade, no diploma: 164High school graduate (or equivalency): 3,108Less than 1 year of college: 663Some college more than 1 year, no degree: 808Associate degree: 504Bachelor's degree: 1,216Master's degree: 341Professional school degree: 20Doctorate degree: 43
Housing units in structures:
One, detached: 3,175One, attached: 684Two: 1653 or 4: 6355 to 9: 1,16910 to 19: 1,89720 to 49: 84050 or more: 1,034Mobile homes: 63Housing units lacking complete plumbing facilities in 2022: 1.4%Housing units lacking complete kitchen facilities in 2022: 2.5%House/condo owner moved in on average 16 years ago
Renter moved in on average 3 years ago
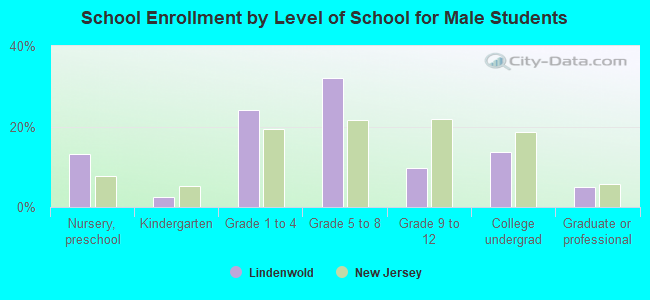
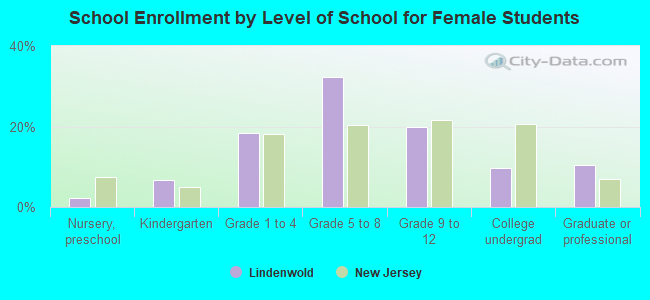
Private vs. public school enrollment:
Students in private schools in grades 1 to 8 (elementary and middle school): 146 Here:
6.3%New Jersey:
12.3%
Students in private schools in grades 9 to 12 (high school): 109 Here:
17.2%New Jersey:
13.1%
Students in private undergraduate colleges: 61 Here:
12.6%New Jersey:
33.2%