Linganore-Bartonsville, MD (Maryland) Houses and Residents
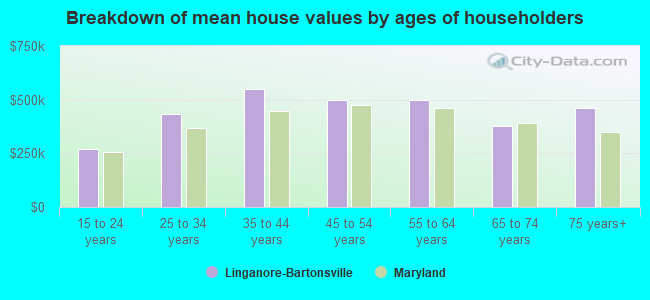
| Linganore-Bartonsville: | $474,240 |
| Maryland: | $398,100 |
Total population: 14,343 (Urban population: 11,230, Rural population: 1,199 (all nonfarm))
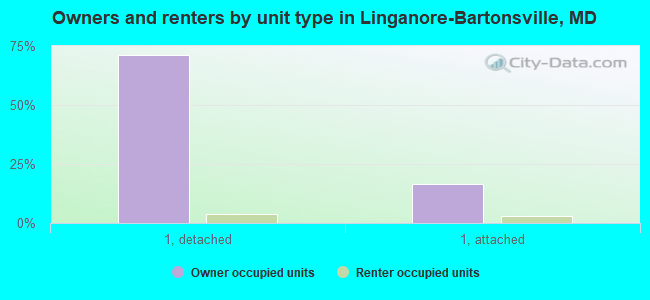
Houses: 4,237 (4,104 occupied: 3,794 owner occupied, 310 renter occupied)
| % of renters here: | 8% |
| State: | 32% |
Housing density: 263 houses/condos per square mile
Median price asked for vacant for-sale houses and condos in 2022 in this county: $402,870.
Median contract rent in 2022: over $2,000 (lower quartile is $1,029, upper quartile is over $2,000)
Median rent asked for vacant for-rent units in 2022: $3,043
Median gross rent in Linganore-Bartonsville, MD in 2022: over $2,000
Housing units in Linganore-Bartonsville with a mortgage: 3,163 (455 second mortgage, 453 home equity loan, 0 both second mortgage and home equity loan)
Houses without a mortgage: 278
Compare current foreclosures near Linganore-Bartonsville, MD:
| Photo | Address | Area | Beds / Baths | Price | Details |
|---|---|---|---|---|---|

|
#1
Bruceville Rd
Keymar, MD 21757
|
1,320 sq. feet
|
1 baths 3 beds |
$153,200
|
show details |

|
#2
W Broadway St
Union Bridge, MD 21791
|
- sq. feet
|
2 baths 4 beds |
$239,900
|
show details |

|
#3
Gallop Ter
Germantown, MD 20874
|
1,360 sq. feet
|
2 baths 3 beds |
show details | |

|
#4
Buhrstone Dr
Montgomery Village, MD 20886
|
1,060 sq. feet
|
3 baths 3 beds |
show details | |

|
#5
Fish Hatchery Rd
Frederick, MD 21702
|
1,200 sq. feet
|
1 baths 3 beds |
show details | |

|
#6
Polaris Dr
Walkersville, MD 21793
|
2,858 sq. feet
|
4 baths 4 beds |
show details | |

|
#7
Maycrest Way
Germantown, MD 20876
|
2,452 sq. feet
|
2 baths 3 beds |
show details | |

|
#8
Dockside Ct
Frederick, MD 21701
|
1,360 sq. feet
|
1 baths 2 beds |
show details | |

|
#9
Braeburn Dr
Walkersville, MD 21793
|
2,032 sq. feet
|
3 baths 3 beds |
show details | |

|
#10
Brookshire Run
Point Of Rocks, MD 21777
|
844 sq. feet
|
2 baths 3 beds |
show details |
| Photo | Address | Area | Beds / Baths | Price | Details |
|---|---|---|---|---|---|

|
#11
Mosby Ct
Frederick, MD 21701
|
1,564 sq. feet
|
2 baths 3 beds |
show details | |

|
#12
Mcwhorter Farm Ct
Damascus, MD 20872
|
6,621 sq. feet
|
6 baths 5 beds |
show details | |

|
#13
Twin Arch Rd
Mount Airy, MD 21771
|
988 sq. feet
|
1 baths - beds |
show details | |

|
#14
Lockwood Dr
Middletown, MD 21769
|
936 sq. feet
|
1 baths - beds |
show details | |

|
#15
Bellison Rd
Damascus, MD 20872
|
3,732 sq. feet
|
5 baths - beds |
show details | |

|
#16
Maitland Ter
Frederick, MD 21703
|
3,147 sq. feet
|
2 baths - beds |
show details | |

|
#17
Clemsonville Rd
Union Bridge, MD 21791
|
1,736 sq. feet
|
1 baths - beds |
show details | |

|
#18
Curiosity Ct
Walkersville, MD 21793
|
1,792 sq. feet
|
2 baths - beds |
show details | |

|
#19
Buhrstone Dr
Montgomery Village, MD 20886
|
1,060 sq. feet
|
2 baths - beds |
show details | |

|
#20
Commodore Ct
New Market, MD 21774
|
1,708 sq. feet
|
3 baths - beds |
show details |
| Photo | Address | Area | Beds / Baths | Price | Details |
|---|---|---|---|---|---|

|
#21
Bedford Dr
Jefferson, MD 21755
|
1,660 sq. feet
|
1 baths - beds |
show details | |

|
#22
Clearspring Rd
Damascus, MD 20872
|
2,751 sq. feet
|
2 baths - beds |
show details | |

|
#23
Middleboro Dr
Damascus, MD 20872
|
2,040 sq. feet
|
2 baths - beds |
show details | |

|
#24
New Windsor Rd
New Windsor, MD 21776
|
792 sq. feet
|
1 baths - beds |
show details | |

|
#25
Jefferson Pike
Jefferson, MD 21755
|
1,752 sq. feet
|
1 baths - beds |
show details | |

|
#26
Murphy Grove Ter
Clarksburg, MD 20871
|
2,836 sq. feet
|
2 baths - beds |
show details | |

|
#27
Bunker Hill Ct
Union Bridge, MD 21791
|
2,208 sq. feet
|
1 baths - beds |
show details | |

|
#28
Wesley Sq
Frederick, MD 21703
|
2,860 sq. feet
|
2 baths - beds |
show details | |

|
#29
Ebenezer Chapel Dr
Clarksburg, MD 20871
|
2,656 sq. feet
|
2 baths - beds |
show details | |

|
#30
Moneyworth Way
Clarksburg, MD 20871
|
1,800 sq. feet
|
2 baths - beds |
show details |
| Photo | Address | Area | Beds / Baths | Price | Details |
|---|---|---|---|---|---|

|
#31
Peachtree Ct
Frederick, MD 21703
|
1,764 sq. feet
|
2 baths - beds |
show details | |

|
#32
Bishops Glen Dr
Frederick, MD 21702
|
1,916 sq. feet
|
2 baths - beds |
show details | |

|
#33
Woodfield Rd
Damascus, MD 20872
|
3,928 sq. feet
|
4 baths - beds |
show details | |

|
#34
Public House Rd
Clarksburg, MD 20871
|
1,520 sq. feet
|
4 baths - beds |
show details | |

|
#35
Warner Rd
Keymar, MD 21757
|
5,530 sq. feet
|
4 baths - beds |
show details | |

|
#36
E Main St
Middletown, MD 21769
|
1,242 sq. feet
|
1 baths - beds |
show details | |

|
#37
Blacks Mill Rd
Thurmont, MD 21788
|
1,344 sq. feet
|
1 baths - beds |
show details | |

|
#38
Nightingale St
Gaithersburg, MD 20882
|
1,280 sq. feet
|
2 baths - beds |
show details | |

|
#39
Carrington Way
Frederick, MD 21702
|
2,040 sq. feet
|
2 baths - beds |
show details | |

|
#40
Frederick Rd
Clarksburg, MD 20871
|
2,724 sq. feet
|
2 baths - beds |
show details |
| Photo | Address | Area | Beds / Baths | Price | Details |
|---|---|---|---|---|---|

|
#41
Apple Way
Frederick, MD 21703
|
1,534 sq. feet
|
3 baths - beds |
show details | |

|
#42
Browningsville Rd
Ijamsville, MD 21754
|
1,933 sq. feet
|
1 baths - beds |
show details | |

|
#43
Sycamore Farm Dr
Clarksburg, MD 20871
|
2,100 sq. feet
|
3 baths - beds |
show details | |

|
#44
Moss Meadow Way
Mount Airy, MD 21771
|
2,084 sq. feet
|
2 baths - beds |
show details | |

|
#45
Crosscut Way
Damascus, MD 20872
|
3,138 sq. feet
|
2 baths - beds |
show details | |

|
#46
Doubs Ct
Adamstown, MD 21710
|
1,580 sq. feet
|
2 baths - beds |
show details | |

|
#47
Pine Valley Ct
Middletown, MD 21769
|
1,408 sq. feet
|
1 baths - beds |
show details | |

|
#48
Woodville Rd
Mount Airy, MD 21771
|
1,841 sq. feet
|
2 baths - beds |
show details | |

|
#49
Park Ave
Mount Airy, MD 21771
|
1,320 sq. feet
|
1 baths - beds |
show details | |

|
Check over 1 million property listings on Foreclosure.com!
|
browse all offers | |||

 | 100 Richest Towns in State of Maryland (39 replies) |

Household type by relationship:
Households: 229,203- In family households: 199,111 (45,130 male householders, 16,068 female householders)
49,048 spouses, 71,169 children (66,662 natural, 1,549 adopted, 2,958 stepchildren), 3,868 grandchildren, 1,839 brothers or sisters, 2,153 parents, foster children, 2,881 other relatives, 5,194 non-relatives
- In nonfamily households: 30,092 (10,870 male householders (8,043 living alone)), 12,732 female householders (10,582 living alone)), 6,490 nonrelatives
- In group quarters: 4,182 (1,640 institutionalized population)
41,250 married couples with children.
8,777 single-parent households (2,130 men, 6,647 women).
94.6% of residents of Linganore-Bartonsville speak English at home.
2.2% of residents speak Spanish at home (82% speak English very well, 15% speak English well, 3% speak English not well).
1.9% of residents speak other Indo-European language at home (74% speak English very well, 13% speak English well, 12% speak English not well).
1.0% of residents speak Asian or Pacific Island language at home (67% speak English very well, 19% speak English well, 15% speak English not well).
0.3% of residents speak other language at home (77% speak English very well, 23% speak English well).
Foreign born population: 2,716 (14.9%)
(57.9% of them are naturalized citizens)
| Here: | 7.6 |
| State: | 7.3 |
| Here: | 5.9 |
| State: | 4.2 |
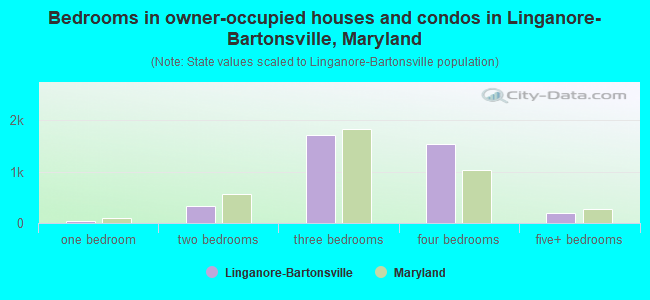
- Bedrooms in owner-occupied houses and condos in Linganore-Bartonsville, Maryland
- 0no bedroom
- 321 bedroom
- 3212 bedrooms
- 1,7133 bedrooms
- 1,5284 bedrooms
- 2005+ bedrooms
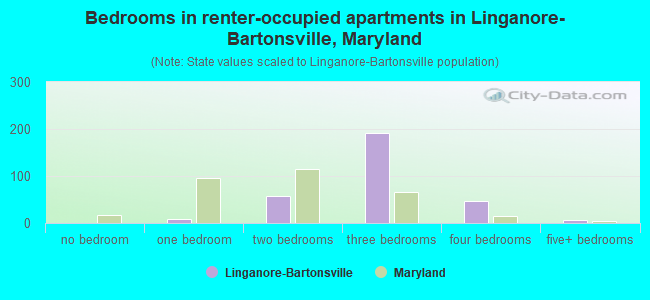
- Bedrooms in renter-occupied apartments in Linganore-Bartonsville, Maryland
- 0no bedroom
- 81 bedroom
- 572 bedrooms
- 1923 bedrooms
- 474 bedrooms
- 65+ bedrooms
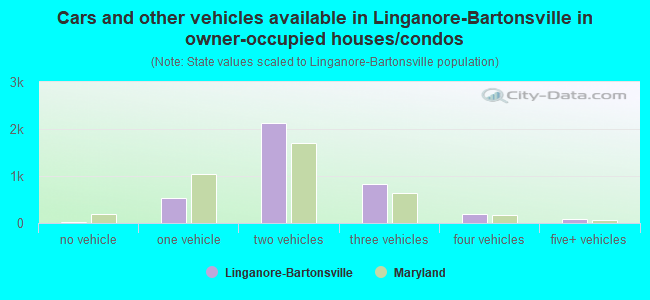
- Cars and other vehicles available in Linganore-Bartonsville in owner-occupied houses/condos
- 31no vehicle
- 5251 vehicle
- 2,1282 vehicles
- 8373 vehicles
- 1944 vehicles
- 795+ vehicles
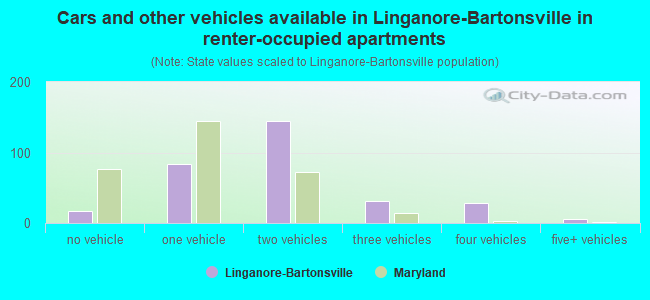
- Cars and other vehicles available in Linganore-Bartonsville in renter-occupied apartments
- 17no vehicle
- 831 vehicle
- 1442 vehicles
- 313 vehicles
- 294 vehicles
- 65+ vehicles
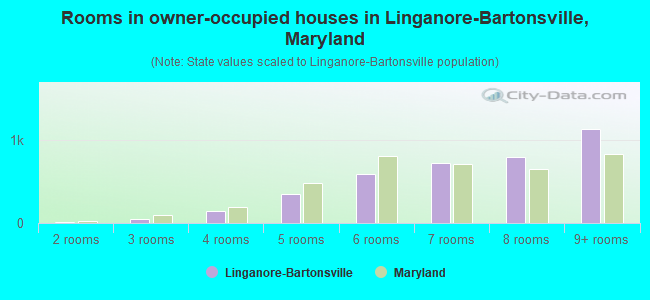
- Rooms in owner-occupied houses in Linganore-Bartonsville, Maryland
- 01 room
- 112 rooms
- 433 rooms
- 1484 rooms
- 3495 rooms
- 5926 rooms
- 7267 rooms
- 7978 rooms
- 1,1289+ rooms
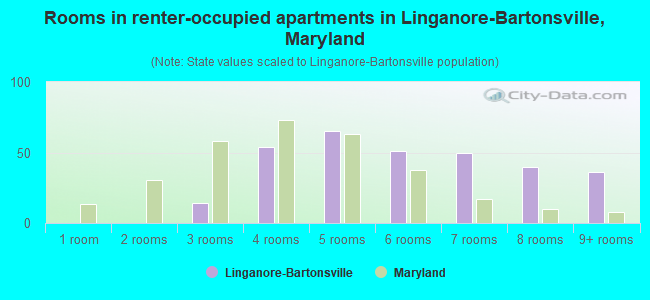
- Rooms in renter-occupied apartments in Linganore-Bartonsville, Maryland
- 01 room
- 02 rooms
- 143 rooms
- 544 rooms
- 655 rooms
- 516 rooms
- 507 rooms
- 408 rooms
- 369+ rooms
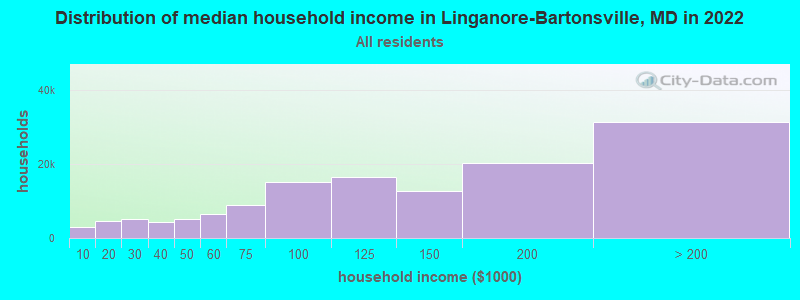
Linganore-Bartonsville, MD household income distribution

- 3,047Less than $10,000
- 4,671$10,000 to $19,999
- 5,117$20,000 to $29,999
- 4,361$30,000 to $39,999
- 5,128$40,000 to $49,999
- 6,407$50,000 to $59,999
- 8,887$60,000 to $74,999
- 15,271$75,000 to $99,999
- 16,510$100,000 to $124,999
- 12,705$125,000 to $149,999
- 20,225$150,000 to $199,999
- 31,415$200,000 or more
Percentage of workers working in this county: 49.5%
Number of people working at home: 2,091 (21.8% of all workers)
Travel time to work (commute)
- Less than 5 minutes: 36
- 5 to 9 minutes: 245
- 10 to 14 minutes: 346
- 15 to 19 minutes: 946
- 20 to 24 minutes: 722
- 25 to 29 minutes: 187
- 30 to 34 minutes: 462
- 35 to 39 minutes: 234
- 40 to 44 minutes: 309
- 45 to 59 minutes: 1,043
- 60 to 89 minutes: 1,251
- 90 or more minutes: 337
Means of transportation to work:
- Drove a car alone: 5,340 (83.9%)
- Carpooled: 678 (10.6%)
- Bus or trolley bus: 9 (0.1%)
- Railroad: 17 (0.3%)
- Motorcycle: 7 (0.1%)
- Other means: 67 (1.1%)
- Worked at home: 250 (3.9%)
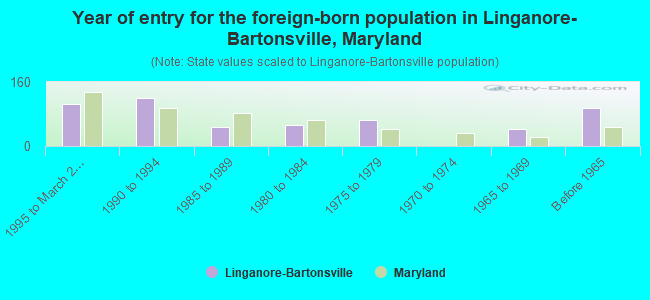
- Year of entry for the foreign-born population in Linganore-Bartonsville, Maryland
- 1041995 to March 2000
- 1191990 to 1994
- 471985 to 1989
- 521980 to 1984
- 641975 to 1979
- 01970 to 1974
- 421965 to 1969
- 95Before 1965
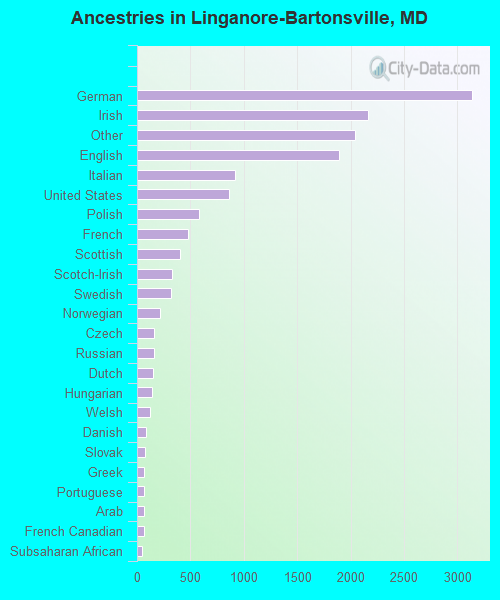
First ancestries reported:
- German: 3,139 (21.5%)
- Irish: 2,160 (14.8%)
- Other: 2,041 (14.0%)
- English: 1,890 (13.0%)
- Italian: 914 (6.3%)
- United States: 862 (5.9%)
- Polish: 585 (4.0%)
- French: 476 (3.3%)
- Scottish: 406 (2.8%)
- Scotch-Irish: 326 (2.2%)
- Swedish: 319 (2.2%)
- Norwegian: 218 (1.5%)
- Czech: 161 (1.1%)
- Russian: 158 (1.1%)
- Dutch: 151 (1.0%)
- Hungarian: 145 (1.0%)
- Welsh: 126 (0.9%)
- Danish: 81 (0.6%)
- Slovak: 79 (0.5%)
- Greek: 69 (0.5%)
- Portuguese: 66 (0.5%)
- Arab: 65 (0.4%)
- French Canadian: 62 (0.4%)
- Subsaharan African: 46 (0.3%)
- Swiss: 22 (0.2%)
- Lithuanian: 11 (0.08%)
- Ukrainian: 8 (0.05%)
Most common places of birth for foreign-born residents (%):
| Linganore-Bartonsville: | 12.8% (67) |
| Maryland: | 0.3% (1,541) |
| Linganore-Bartonsville: | 11.1% (58) |
| Maryland: | 2.9% (14,807) |
| Linganore-Bartonsville: | 9.0% (47) |
| Maryland: | 2.8% (14,555) |
| Linganore-Bartonsville: | 8.8% (46) |
| Maryland: | 1.7% (9,019) |
| Linganore-Bartonsville: | 7.1% (37) |
| Maryland: | 2.0% (10,309) |
| Linganore-Bartonsville: | 5.7% (30) |
| Maryland: | 1.7% (8,723) |
| Linganore-Bartonsville: | 5.4% (28) |
| Maryland: | 2.7% (14,206) |
| Linganore-Bartonsville: | 4.6% (24) |
| Maryland: | 1.2% (6,266) |
| Linganore-Bartonsville: | 4.2% (22) |
| Maryland: | 4.1% (21,007) |
| Linganore-Bartonsville: | 3.1% (16) |
| Maryland: | 0.4% (2,102) |
| Linganore-Bartonsville: | 2.7% (14) |
| Maryland: | 0.8% (4,318) |
| Linganore-Bartonsville: | 2.5% (13) |
| Maryland: | 6.2% (32,276) |
| Linganore-Bartonsville: | 2.5% (13) |
| Maryland: | 1.7% (8,678) |
| Linganore-Bartonsville: | 2.3% (12) |
| Maryland: | 6.0% (31,249) |
| Linganore-Bartonsville: | 2.1% (11) |
| Maryland: | 0.3% (1,415) |
| Linganore-Bartonsville: | 1.9% (10) |
| Maryland: | 0.4% (2,147) |
| Linganore-Bartonsville: | 1.9% (10) |
| Maryland: | 1.6% (8,407) |
| Linganore-Bartonsville: | 1.7% (9) |
| Maryland: | 0.3% (1,565) |
| Linganore-Bartonsville: | 1.7% (9) |
| Maryland: | 0.8% (4,199) |
| Linganore-Bartonsville: | 1.7% (9) |
| Maryland: | 0.3% (1,547) |
| Linganore-Bartonsville: | 1.5% (8) |
| Maryland: | 0.2% (778) |
| Linganore-Bartonsville: | 1.5% (8) |
| Maryland: | 0.1% (658) |
| Linganore-Bartonsville: | 1.5% (8) |
| Maryland: | 0.6% (2,999) |
Place of birth for U.S.-born residents:
- This state: 6,032
- Other state: 5,691
- Northeast: 2,177
- Midwest: 920
- South: 2,186
- West: 408
47% of Linganore-Bartonsville residents lived in the same house 5 years ago.
Out of people who lived in different houses, 36% lived in this county.
Out of people who lived in different counties, 62% lived in Maryland.
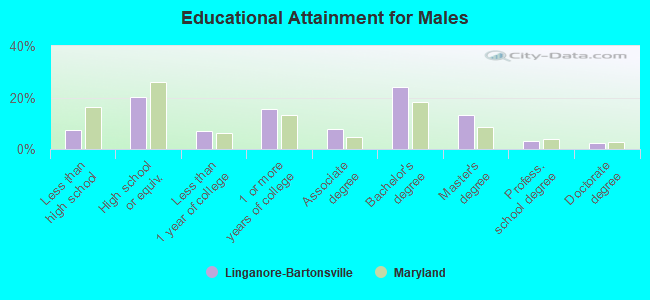
Education attainment for males 25 years and older:
- No schooling: 23
- Nursery to 4th grade: 0
- 5th and 6th grade: 5
- 7th and 8th grade: 59
- 9th grade: 11
- 10th grade: 51
- 11th grade: 44
- 12th grade, no diploma: 82
- High school graduate (or equivalency): 776
- Less than 1 year of college: 260
- Some college more than 1 year, no degree: 588
- Associate degree: 295
- Bachelor's degree: 923
- Master's degree: 498
- Professional school degree: 114
- Doctorate degree: 94
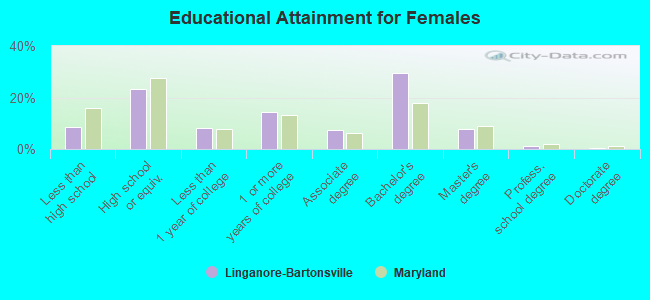
Education attainment for females 25 years and older:
- No schooling: 8
- Nursery to 4th grade: 19
- 5th and 6th grade: 19
- 7th and 8th grade: 97
- 9th grade: 19
- 10th grade: 79
- 11th grade: 38
- 12th grade, no diploma: 59
- High school graduate (or equivalency): 926
- Less than 1 year of college: 323
- Some college more than 1 year, no degree: 569
- Associate degree: 288
- Bachelor's degree: 1,177
- Master's degree: 310
- Professional school degree: 49
- Doctorate degree: 8


Housing units in structures:
- One, detached: 3,154
- One, attached: 836
- Two: 27
- 3 or 4: 8
- 5 to 9: 9
- 10 to 19: 156
- Mobile homes: 47
Median worth of mobile homes: $420,525
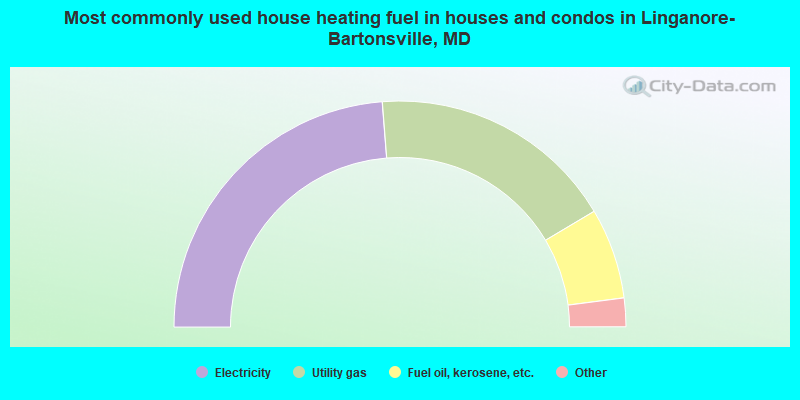
- 47.5%Electricity
- 35.4%Utility gas
- 13.0%Fuel oil, kerosene, etc.
- 2.9%Bottled, tank, or LP gas
- 0.8%Wood
- 0.2%Other fuel
- 0.2%No fuel used
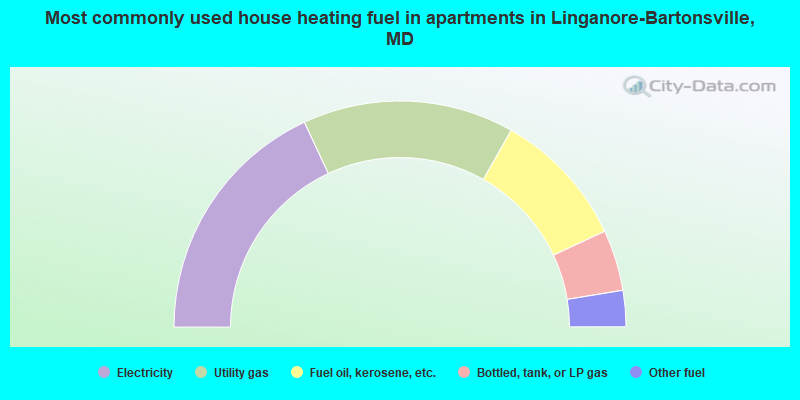
- 36.1%Electricity
- 30.3%Utility gas
- 19.7%Fuel oil, kerosene, etc.
- 8.7%Bottled, tank, or LP gas
- 5.2%Other fuel
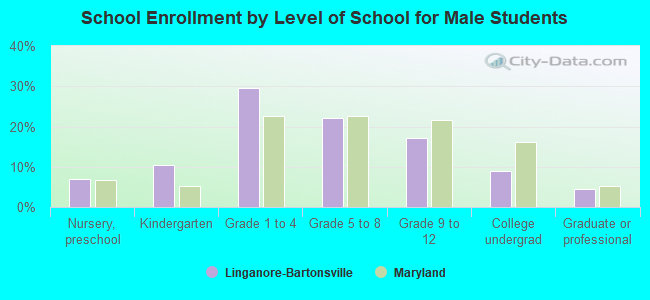
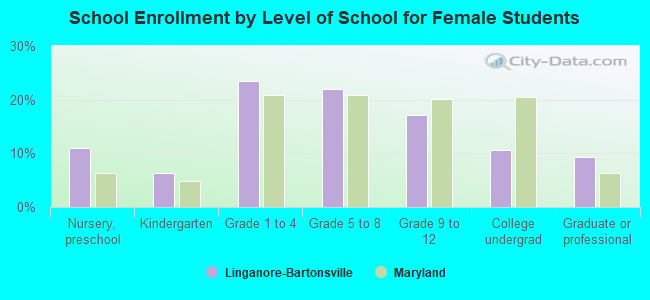
Private vs. public school enrollment:
| Here: | 8.5% |
| Maryland: | 14.8% |
| Here: | 2.5% |
| Maryland: | 13.3% |
| Here: | 18.0% |
| Maryland: | 21.7% |