Housing density: 2,087 houses/condos per square mile
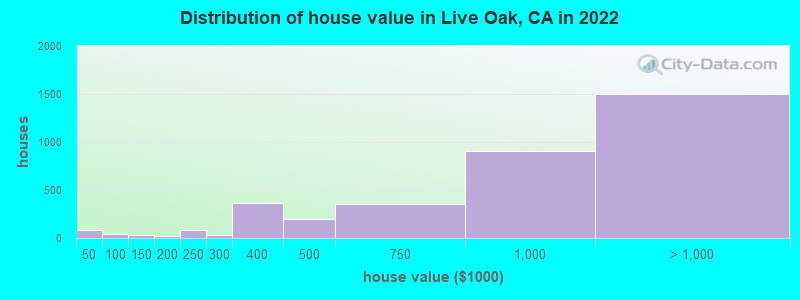
Median price asked for vacant for-sale houses and condos in 2022: $822,751.
Median contract rent in 2022: over $2,000 (lower quartile is $1,280, upper quartile is over $2,000)
Median rent asked for vacant for-rent units in 2022: $4,829
Median gross rent in Live Oak, CA in 2022: over $2,000
Housing units in Live Oak with a mortgage: 2,416 (331 second mortgage, 0 home equity loan, 274 both second mortgage and home equity loan) Houses without a mortgage: 35
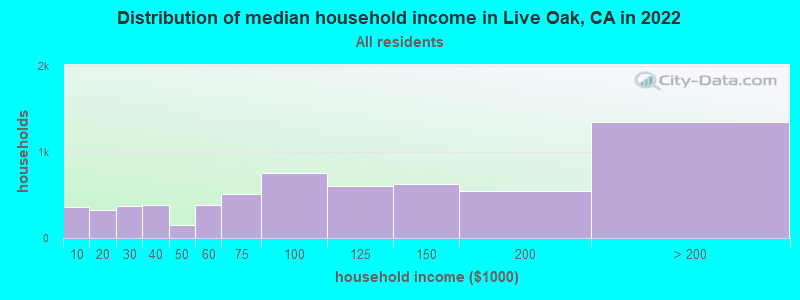
Median household income for houses/condos with a mortgage: $139,722
Median household income for apartments without a mortgage: $83,827
1,905 married couples with children.
764 single-parent households (191 men, 573 women).
72.1% of residents of Live Oak speak English at home.
20.3% of residents speak Spanish at home (63% speak English very well, 17% speak English well, 13% speak English not well, 7% don't speak English at all).
3.8% of residents speak other Indo-European language at home (64% speak English very well, 36% speak English well).
3.5% of residents speak Asian or Pacific Island language at home (47% speak English very well, 43% speak English well, 5% speak English not well, 5% don't speak English at all).
0.2% of residents speak other language at home (27% speak English very well, 51% speak English well, 22% speak English not well).
Foreign born population: 2,579 (14.8%)
(43.9% of them are naturalized citizens)
Percentage of workers working in this county: 87.2% Number of people working at home: 1,662 (18.9% of all workers)
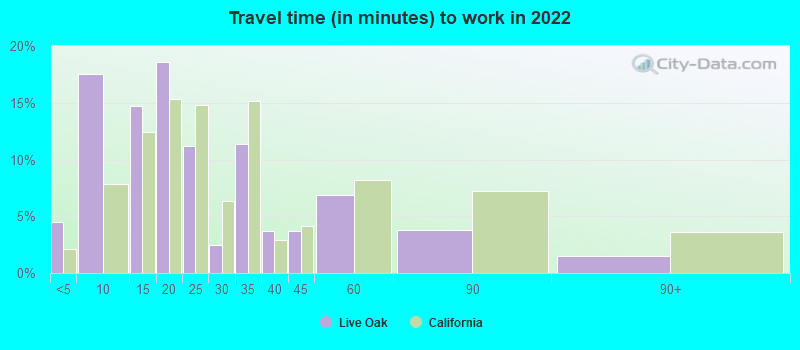
Travel time to work (commute)
Less than 5 minutes: 123
5 to 9 minutes: 874
10 to 14 minutes: 1,242
15 to 19 minutes: 1,673
20 to 24 minutes: 938
25 to 29 minutes: 199
30 to 34 minutes: 495
35 to 39 minutes: 228
40 to 44 minutes: 228
45 to 59 minutes: 699
60 to 89 minutes: 307
90 or more minutes: 109
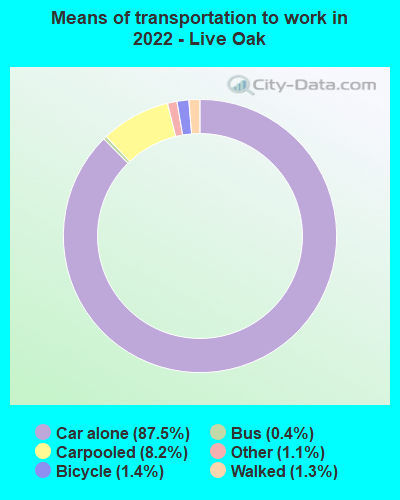
Means of transportation to work:
Drove a car alone: 5,085 (66.7%)
Carpooled: 530 (7.0%)
Bus: 35 (0.5%)
Taxi: 72 (0.9%)
Bicycle: 93 (1.2%)
Walked: 76 (1.0%)
Worked at home: 1,662 (21.8%)
Unemployment by race in 2022
Unemployment rate for White non-Hispanic residents
3.6%Males
4.7%Females
Unemployment rate for Asian residents
8.2%Males
Unemployment rate for other race residents
1.2%Males
6.5%Females
Unemployment rate for two or more race residents
2.7%Males
3.8%Females
Unemployment rate for Hispanic or Latino residents
4.7%Males
3.5%Females
Year of entry for the foreign-born population in Live Oak, California
6532010 or later
8512000 to 2009
4581990 to 1999
8821980 to 1989
3501970 to 1979
468Before 1970
First ancestries reported:
English: 509 (6.7%)
German: 495 (6.5%)
Italian: 381 (5.0%)
Irish: 306 (4.0%)
American: 284 (3.8%)
European: 202 (2.7%)
Iranian: 157 (2.1%)
Scottish: 152 (2.0%)
Norwegian: 103 (1.4%)
Scotch-Irish: 81 (1.1%)
Scandinavian: 79 (1.0%)
French: 70 (0.9%)
British: 52 (0.7%)
Polish: 51 (0.7%)
Portuguese: 42 (0.6%)
Canadian: 39 (0.5%)
Ukrainian: 38 (0.5%)
Syrian: 31 (0.4%)
Russian: 31 (0.4%)
Kenyan: 31 (0.4%)
Eastern European: 30 (0.4%)
Danish: 28 (0.4%)
Czech: 26 (0.3%)
French Canadian: 24 (0.3%)
Swedish: 20 (0.3%)
Northern European: 15 (0.2%)
Hungarian: 13 (0.2%)
Ethiopian: 10 (0.1%)
Brazilian: 9 (0.1%)
Romanian: 9 (0.1%)
Trinidadian and Tobagonian: 9 (0.1%)
Dutch: 8 (0.1%)
Egyptian: 8 (0.1%)
Greek: 7 (0.09%)
Turkish: 7 (0.09%)
Armenian: 6 (0.08%)
Finnish: 5 (0.07%)
Most common places of birth for foreign-born residents (%):
Mexico
Live Oak:
38.5% (969)
California:
37.2% (3,881,193)
El Salvador
Live Oak:
8.7% (218)
California:
4.2% (440,287)
Germany
Live Oak:
6.0% (152)
California:
0.7% (73,304)
China, excluding Hong Kong and Taiwan
Live Oak:
5.6% (142)
California:
6.6% (684,672)
Iran
Live Oak:
5.4% (136)
California:
2.0% (206,004)
Oceania, n.e.c.
Live Oak:
3.8% (95)
California:
0.2% (18,925)
Thailand
Live Oak:
3.5% (87)
California:
0.6% (65,335)
Philippines
Live Oak:
3.2% (81)
California:
7.8% (818,297)
Vietnam
Live Oak:
2.9% (72)
California:
4.9% (512,335)
Canada
Live Oak:
2.1% (53)
California:
1.2% (127,477)
Italy
Live Oak:
1.7% (42)
California:
0.3% (31,439)
Peru
Live Oak:
1.6% (40)
California:
0.7% (74,025)
Place of birth for U.S.-born residents:
This state: 11,614
Other state: 3,001
Northeast: 982
Midwest: 725
South: 596
West: 708
84.4% of Live Oak residents lived in the same house 1 years ago. Out of people who lived in different houses, 30.7% lived in this county. Out of people who lived in different counties, 86.4% lived in California.
Live Oak:
84.4%
State average:
88.9%
Education attainment for males 25 years and older:
No schooling: 186
Nursery to 4th grade: 19
5th and 6th grade: 50
7th and 8th grade: 11
9th grade: 78
10th grade: 48
11th grade: 49
12th grade, no diploma: 223
High school graduate (or equivalency): 1,194
Less than 1 year of college: 445
Some college more than 1 year, no degree: 1,163
Associate degree: 510
Bachelor's degree: 1,636
Master's degree: 420
Professional school degree: 84
Doctorate degree: 124
Education attainment for females 25 years and older:
No schooling: 83
Nursery to 4th grade: 64
5th and 6th grade: 34
7th and 8th grade: 49
9th grade: 96
10th grade: 5
11th grade: 63
12th grade, no diploma: 139
High school graduate (or equivalency): 909
Less than 1 year of college: 402
Some college more than 1 year, no degree: 913
Associate degree: 529
Bachelor's degree: 1,711
Master's degree: 917
Professional school degree: 246
Doctorate degree: 82
Housing units in structures:
One, detached: 3,445
One, attached: 763
Two: 258
3 or 4: 449
5 to 9: 96
10 to 19: 299
20 to 49: 226
50 or more: 317
Mobile homes: 890
Median worth of mobile homes: $389,893
Housing units lacking complete plumbing facilities in 2022: 0.8%
Housing units lacking complete kitchen facilities in 2022: 2.5%