Lodi, CA (California) Houses and Residents
Estimated median house or condo value in 2022: $513,900 (it was $139,800 in 2000 )
Lodi:
$513,900California:
$715,900
Lower value quartile - upper value quartile: $386,800 - $675,500Mean price in 2022: Detached houses: $532,441 Here:
$532,441State:
$988,808
Townhouses or other attached units: $432,727 Here:
$432,727State:
$838,546
In 3-to-4-unit structures: $507,837 Here:
$507,837State:
$824,253
In 5-or-more-unit structures: $276,721 Here:
$276,721State:
$730,996
Mobile homes: $97,094 Here:
$97,094State:
$184,506
Total population: 63,950 (Urban population: 57,037, Rural population: 0)
Houses: 25,244 (23,659 occupied: 14,037 owner occupied, 9,622 renter occupied )
% of renters here:
41%State:
44%
Housing density: 2,063 houses/condos per square mile
Median price asked for vacant for-sale houses and condos in 2022: $828,137.
Median contract rent in 2022: $1,244 (lower quartile is $935, upper quartile is $1,650)
Median rent asked for vacant for-rent units in 2022: $2,021
Median gross rent in Lodi, CA in 2022: $1,497
Housing units in Lodi with a mortgage: 9,909 (528 second mortgage, 0 home equity loan, 528 both second mortgage and home equity loan )Houses without a mortgage: 79
Median household income for houses/condos with a mortgage: $117,795
Median household income for apartments without a mortgage: $66,057
Median monthly housing costs: $1,510
Data:
Median house or condo value ($)
Median house or condo value ($ change since 2000)
Median house or condo value ($) - White
Median house or condo value ($) - Black or African American
Median house or condo value ($) - Asian
Median house or condo value ($) - Hispanic or Latino
Median house or condo value ($) - American Indian and Alaska Native
Median house or condo value ($) - Multirace
Median house or condo value ($) - Other Race
Median price asked for mobile homes ($)
Household density (households per square mile)
Mean house or condo value by units in structure - 1, detached ($)
Mean house or condo value by units in structure - 1, attached ($)
Mean house or condo value by units in structure - 2 ($)
Mean house or condo value by units in structure by units in structure - 3 or 4 ($)
Mean house or condo value by units in structure - 5 or more ($)
Mean house or condo value by units in structure - Boat, RV, van, etc. ($)
Mean house or condo value by units in structure - Mobile home ($)
Median contract rent ($)
Median contract rent - Lower quartile ($)
Median contract rent - Upper quartile ($)
Median gross rent ($)
Urban houses (%)
Rural houses (%)
Houses occupied (%)
Houses occupied (% change since 2000)
Houses owner occupied (%)
Houses owner occupied (% change since 2000)
Houses renter occupied (%)
Houses renter occupied (% change since 2000)
Vacant housing units - For rent (%)
Vacant housing units - For rent (% change since 2000)
Vacant housing units - For sale only (%)
Vacant housing units - For sale only (% change since 2000)
Vacant housing units - Rented or sold, not occupied (%)
Vacant housing units - Rented or sold, not occupied (% change since 2000)
Vacant housing units - For seasonal, recreational, or occasional use (%)
Vacant housing units - For seasonal, recreational, or occasional use (% change since 2000)
Vacant housing units - For migrant workers (%)
Vacant housing units - For migrant workers (% change since 2000)
Vacant housing units - Other vacant (%)
Vacant housing units - Other vacant (% change since 2000)
Median monthly housing costs ($)
Median household income for houses/condos with a mortgage ($)
Median household income for houses/condos without a mortgage ($)
Median household income ($)
Median household income ($) - White
Median household income ($) - Black or African American
Median household income ($) - Asian
Median household income ($) - Hispanic or Latino
Median household income ($) - American Indian and Alaska Native
Median household income ($) - Multirace
Median household income ($) - Other Race
Mortgage status - with mortgage (%)
Mortgage status - with second mortgage (%)
Mortgage status - with home equity loan (%)
Mortgage status - with both second mortgage and home equity loan (%)
Mortgage status - without a mortgage (%)
Median year house/condo built
Median year apartment built
Household type by relationship - Male householder living alone (%)
Household type by relationship - Male householder not living alone (%)
Household type by relationship - Female householder living alone (%)
Household type by relationship - Female householder not living alone (%)
Household type by relationship - Opposite-Sex spouse (%)
Household type by relationship - Same-Sex spouse (%)
Household type by relationship - Opposite-Sex unmarried partner (%)
Household type by relationship - Same-Sex unmarried partner (%)
Household type by relationship - In group quarters (%)
Size of family households - 2-person household (%)
Size of family households - 3-person household (%)
Size of family households - 4-person household (%)
Size of family households - 5-person household (%)
Size of family households - 6-person household (%)
Size of family households - 7-or-more-person household (%)
Size of nonfamily households - 1-person household (%)
Size of nonfamily households - 2-person household (%)
Size of nonfamily households - 3-person household (%)
Size of nonfamily households - 4-person household (%)
Size of nonfamily households - 5-person household (%)
Size of nonfamily households - 6-person household (%)
Size of nonfamily households - 7-or-moreperson household (%)
Year house built - Built 2010 or later (%)
Year house built - Built 2000 to 2009 (%)
Year house built - Built 1990 to 1999 (%)
Year house built - Built 1980 to 1989 (%)
Year house built - Built 1970 to 1979 (%)
Year house built - Built 1960 to 1969 (%)
Year house built - Built 1950 to 1959 (%)
Year house built - Built 1940 to 1949 (%)
Year house built - Built 1939 or earlier (%)
Median number of rooms in houses and condos
Median number of rooms in apartments
Median number of bedrooms in owner occupied houses
Mean number of bedrooms in owner occupied houses
Median number of bedrooms in renter occupied houses
Mean number of bedrooms in renter occupied houses
Median number of vehichles in owner occupied houses
Mean number of vehichles in owner occupied houses
Median number of vehichles in renter occupied houses
Mean number of vehichles in renter occupied houses
Rooms in owner-occupied houses - 1 room (%)
Rooms in owner-occupied houses - 2 rooms (%)
Rooms in owner-occupied houses - 3 rooms (%)
Rooms in owner-occupied houses - 4 rooms (%)
Rooms in owner-occupied houses - 5 rooms (%)
Rooms in owner-occupied houses - 6 rooms (%)
Rooms in owner-occupied houses - 7 rooms (%)
Rooms in owner-occupied houses - 8 rooms (%)
Rooms in owner-occupied houses - 9+ rooms (%)
Rooms in renter-occupied houses - 1 room (%)
Rooms in renter-occupied houses - 2 rooms (%)
Rooms in renter-occupied houses - 3 rooms (%)
Rooms in renter-occupied houses - 4 rooms (%)
Rooms in renter-occupied houses - 5 rooms (%)
Rooms in renter-occupied houses - 6 rooms (%)
Rooms in renter-occupied houses - 7 rooms (%)
Rooms in renter-occupied houses - 8 rooms (%)
Rooms in renter-occupied houses - 9+ rooms (%)
Bedrooms in owner-occupied houses - no bedrooms (%)
Bedrooms in owner-occupied houses - 1 bedroom (%)
Bedrooms in owner-occupied houses - 2 bedrooms (%)
Bedrooms in owner-occupied houses - 3 bedrooms (%)
Bedrooms in owner-occupied houses - 4 bedrooms (%)
Bedrooms in owner-occupied houses - 5+ bedrooms (%)
Bedrooms in renter-occupied houses - no bedrooms (%)
Bedrooms in renter-occupied houses - 1 bedroom (%)
Bedrooms in renter-occupied houses - 2 bedrooms (%)
Bedrooms in renter-occupied houses - 3 bedrooms (%)
Bedrooms in renter-occupied houses - 4 bedrooms (%)
Bedrooms in renter-occupied houses - 5+ bedrooms (%)
Vehicles available in owner-occupied houses - no vehicle available (%)
Vehicles available in owner-occupied houses - 1 vehicle available(%)
Vehicles available in owner-occupied houses - 2 Vehicles available (%)
Vehicles available in owner-occupied houses - 3 Vehicles available (%)
Vehicles available in owner-occupied houses - 4 Vehicles available (%)
Vehicles available in owner-occupied houses - 5+ Vehicles available (%)
Vehicles available in renter-occupied houses - no vehicle available (%)
Vehicles available in renter-occupied houses - 1 vehicle available (%)
Vehicles available in renter-occupied houses - 2 Vehicles available (%)
Vehicles available in renter-occupied houses - 3 Vehicles available (%)
Vehicles available in renter-occupied houses - 4 Vehicles available (%)
Vehicles available in renter-occupied houses - 5+ Vehicles available (%)
Housing units in structures - 1, detached (%)
Housing units in structures - 1, attached (%)
Housing units in structures - 2 (%)
Housing units in structures - 3 or 4 (%)
Housing units in structures - 5 to 9 (%)
Housing units in structures - 10 to 19 (%)
Housing units in structures - 20 to 49 (%)
Housing units in structures - 50 or more (%)
Housing units in structures - Mobile home (%)
Housing units in structures - Boat, RV, van, etc. (%)
Housing units in structures - Owners - 1, detached (%)
Housing units in structures - Owners - 1, attached (%)
Housing units in structures - Owners - 2 (%)
Housing units in structures - Owners - 3 or 4 (%)
Housing units in structures - Owners - 5 to 9 (%)
Housing units in structures - Owners - 10 to 19 (%)
Housing units in structures - Owners - 20 to 49 (%)
Housing units in structures - Owners - 50 or more (%)
Housing units in structures - Owners - Mobile home (%)
Housing units in structures - Owners - Boat, RV, van, etc. (%)
Housing units in structures - Renters - 1, detached (%)
Housing units in structures - Renters - 1, attached (%)
Housing units in structures - Renters - 2 (%)
Housing units in structures - Renters - 3 or 4 (%)
Housing units in structures - Renters - 5 to 9 (%)
Housing units in structures - Renters - 10 to 19 (%)
Housing units in structures - Renters - 20 to 49 (%)
Housing units in structures - Renters - 50 or more (%)
Housing units in structures - Renters - Mobile home (%)
Housing units in structures - Renters - Boat, RV, van, etc. (%)
House/condo owner moved in on average (years ago)
Renter moved in on average (years ago)
Year householder moved into unit - Moved in 1999 to March 2000 (%)
Year householder moved into unit - Moved in 1999 to March 2000 (%) - White
Year householder moved into unit - Moved in 1999 to March 2000 (%) - Black or African American
Year householder moved into unit - Moved in 1999 to March 2000 (%) - Asian
Year householder moved into unit - Moved in 1999 to March 2000 (%) - Hispanic or Latino
Year householder moved into unit - Moved in 1999 to March 2000 (%) - American Indian and Alaska Native
Year householder moved into unit - Moved in 1999 to March 2000 (%) - Multirace
Year householder moved into unit - Moved in 1999 to March 2000 (%) - Other Race
Year householder moved into unit - Moved in 1995 to 1998 (%)
Year householder moved into unit - Moved in 1995 to 1998 (%) - White
Year householder moved into unit - Moved in 1995 to 1998 (%) - Black or African American
Year householder moved into unit - Moved in 1995 to 1998 (%) - Asian
Year householder moved into unit - Moved in 1995 to 1998 (%) - Hispanic or Latino
Year householder moved into unit - Moved in 1995 to 1998 (%) - American Indian and Alaska Native
Year householder moved into unit - Moved in 1995 to 1998 (%) - Multirace
Year householder moved into unit - Moved in 1995 to 1998 (%) - Other Race
Year householder moved into unit - Moved in 1990 to 1994 (%)
Year householder moved into unit - Moved in 1990 to 1994 (%) - White
Year householder moved into unit - Moved in 1990 to 1994 (%) - Black or African American
Year householder moved into unit - Moved in 1990 to 1994 (%) - Asian
Year householder moved into unit - Moved in 1990 to 1994 (%) - Hispanic or Latino
Year householder moved into unit - Moved in 1990 to 1994 (%) - American Indian and Alaska Native
Year householder moved into unit - Moved in 1990 to 1994 (%) - Multirace
Year householder moved into unit - Moved in 1990 to 1994 (%) - Other Race
Year householder moved into unit - Moved in 1980 to 1989 (%)
Year householder moved into unit - Moved in 1980 to 1989 (%) - White
Year householder moved into unit - Moved in 1980 to 1989 (%) - Black or African American
Year householder moved into unit - Moved in 1980 to 1989 (%) - Asian
Year householder moved into unit - Moved in 1980 to 1989 (%) - Hispanic or Latino
Year householder moved into unit - Moved in 1980 to 1989 (%) - American Indian and Alaska Native
Year householder moved into unit - Moved in 1980 to 1989 (%) - Multirace
Year householder moved into unit - Moved in 1980 to 1989 (%) - Other Race
Year householder moved into unit - Moved in 1970 to 1979 (%)
Year householder moved into unit - Moved in 1970 to 1979 (%) - White
Year householder moved into unit - Moved in 1970 to 1979 (%) - Black or African American
Year householder moved into unit - Moved in 1970 to 1979 (%) - Asian
Year householder moved into unit - Moved in 1970 to 1979 (%) - Hispanic or Latino
Year householder moved into unit - Moved in 1970 to 1979 (%) - American Indian and Alaska Native
Year householder moved into unit - Moved in 1970 to 1979 (%) - Multirace
Year householder moved into unit - Moved in 1970 to 1979 (%) - Other Race
Year householder moved into unit - Moved in 1969 or earlier (%)
Year householder moved into unit - Moved in 1969 or earlier (%) - White
Year householder moved into unit - Moved in 1969 or earlier (%) - Black or African American
Year householder moved into unit - Moved in 1969 or earlier (%) - Asian
Year householder moved into unit - Moved in 1969 or earlier (%) - Hispanic or Latino
Year householder moved into unit - Moved in 1969 or earlier (%) - American Indian and Alaska Native
Year householder moved into unit - Moved in 1969 or earlier (%) - Multirace
Year householder moved into unit - Moved in 1969 or earlier (%) - Other Race
Housing units lacking complete plumbing facilities (%)
Housing units lacking complete kitchen facilities (%)
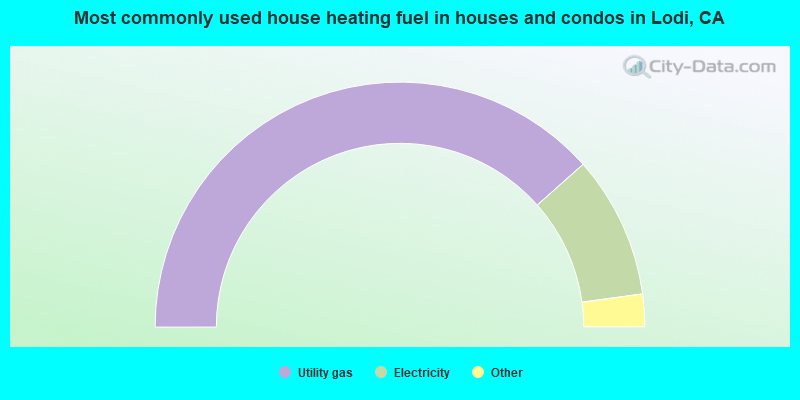
House heating fuel used in houses and condos - Utility gas (%)
House heating fuel used in houses and condos - Bottled, tank, or LP gas (%)
House heating fuel used in houses and condos - Electricity (%)
House heating fuel used in houses and condos - Fuel oil, kerosene, etc. (%)
House heating fuel used in houses and condos - Coal or coke (%)
House heating fuel used in houses and condos - Wood (%)
House heating fuel used in houses and condos - Solar energy (%)
House heating fuel used in houses and condos - Other fuel (%)
House heating fuel used in houses and condos - No fuel used (%)
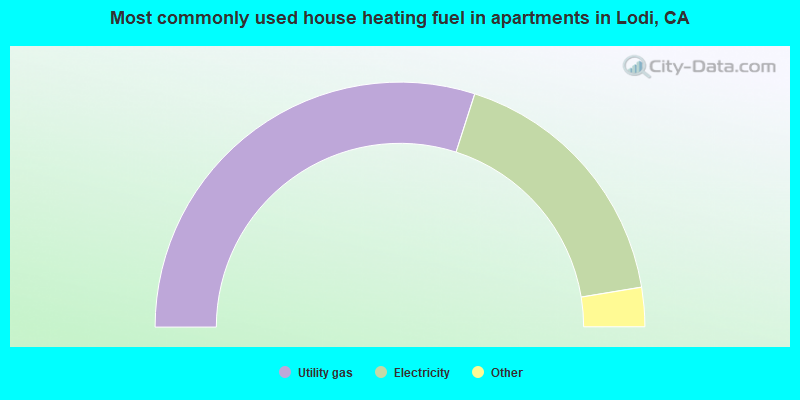
House heating fuel used in apartments - Utility gas (%)
House heating fuel used in apartments - Bottled, tank, or LP gas (%)
House heating fuel used in apartments - Electricity (%)
House heating fuel used in apartments - Fuel oil, kerosene, etc. (%)
House heating fuel used in apartments - Coal or coke (%)
House heating fuel used in apartments - Wood (%)
House heating fuel used in apartments - Solar energy (%)
House heating fuel used in apartments - Other fuel (%)
House heating fuel used in apartments - No fuel used (%)
Latest news about housing in Lodi, CA collected exclusively by city-data.com from local newspapers, TV, and radio stations
Median year house/condo built: 1982Median year apartment built: 1976Household type by relationship:
Households: 67,273
Male householders: 11,328 (2,565 living alone ), Female householders: 12,331 (3,214 living alone )10,243 spouses (10,243 opposite-sex spouses ), 1,557 unmarried partners , (1,557 opposite-sex unmarried partners ), 21,740 children (21,310 natural , 111 adopted , 319 stepchildren ), 1,759 grandchildren , 1,120 brothers or sisters , 2,394 parents , 0 foster children , 1,594 other relatives , 2,202 non-relatives In group quarters: 1,005
Size of family households: 6,771 2-persons , 4,222 3-persons , 2,852 4-persons , 1,355 5-persons , 1,074 6-persons , 702 7-or-more-persons .
Size of nonfamily households: 5,779 1-person , 507 2-persons , 35 3-persons , 362 4-persons .
9,237 married couples with children. single-parent households (1,403 men , 2,930 women ).
62.3% of residents of Lodi speak English at home. of residents speak Spanish at home (59% speak English very well , 15% speak English well , 14% speak English not well , 11% don't speak English at all ).of residents speak other Indo-European language at home (53% speak English very well , 25% speak English well , 19% speak English not well , 4% don't speak English at all ).of residents speak Asian or Pacific Island language at home (54% speak English very well , 25% speak English well , 11% speak English not well , 10% don't speak English at all ).of residents speak other language at home (70% speak English very well , 28% speak English well , 1% speak English not well ).
Foreign born population: 15,943 (23.7%)of them are naturalized citizens )
Median number of rooms in houses and condos:
Median number of rooms in apartments
Owner-occupied Renter-occupied
Rooms in owner-occupied houses in Lodi, California
0 1 room 0 2 rooms 850 3 rooms 1,387 4 rooms 3,963 5 rooms 3,327 6 rooms 2,054 7 rooms 1,106 8 rooms 1,350 9+ rooms
Rooms in renter-occupied apartments in Lodi, California
642 1 room 404 2 rooms 1,615 3 rooms 2,874 4 rooms 1,687 5 rooms 1,672 6 rooms 88 7 rooms 420 8 rooms 220 9+ rooms
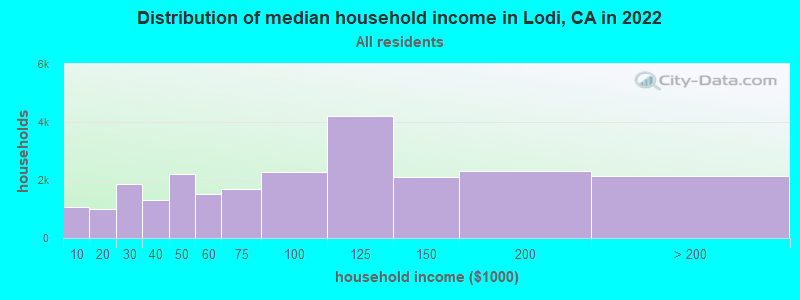
Lodi, CA household income distribution 1,052 Less than $10,0001,008 $10,000 to $19,9991,865 $20,000 to $29,9991,294 $30,000 to $39,9992,202 $40,000 to $49,9991,531 $50,000 to $59,9991,694 $60,000 to $74,9992,263 $75,000 to $99,9994,218 $100,000 to $124,9992,096 $125,000 to $149,9992,299 $150,000 to $199,9992,137 $200,000 or more
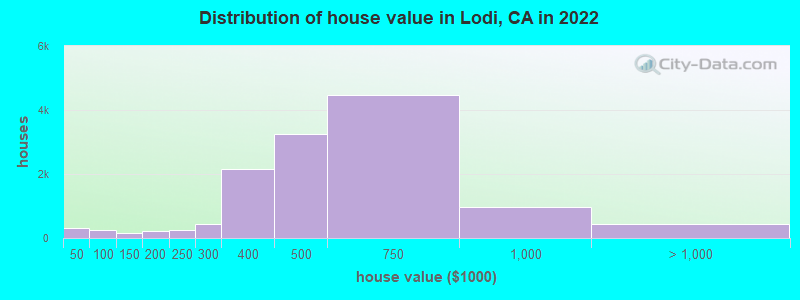
Home value of owner - occupied houses in 2022 in Lodi, CA 124 Less than $10,00056 $10,000 to $14,99910 $15,000 to $19,9996 $20,000 to $24,99926 $30,000 to $34,9997 $35,000 to $39,99968 $40,000 to $49,99948 $50,000 to $59,99922 $60,000 to $69,99970 $70,000 to $79,9998 $80,000 to $89,99921 $90,000 to $99,99987 $100,000 to $124,99967 $125,000 to $149,999120 $150,000 to $174,999106 $175,000 to $199,999255 $200,000 to $249,999450 $250,000 to $299,9992,166 $300,000 to $399,9993,244 $400,000 to $499,9994,475 $500,000 to $749,999953 $750,000 to $999,999286 $1,000,000 to $1,499,99980 $1,500,000 to $1,999,99958 $2,000,000 or moreRent paid by renters in 2022 in Lodi, CA 31 Less than $1009 $100 to $1498 $150 to $19930 $200 to $24924 $250 to $29989 $300 to $3497 $350 to $39966 $450 to $499187 $500 to $549110 $550 to $599196 $600 to $649144 $650 to $699453 $700 to $749311 $750 to $799507 $800 to $899745 $900 to $9991,650 $1,000 to $1,2491,662 $1,250 to $1,4992,118 $1,500 to $1,999609 $2,000 to $2,49991 $2,500 to $2,99959 $3,000 to $3,49972 $3,500 or more244 No cash rent
Percentage of workers working in this county: 88.5%Number of people working at home: 3,366 (10.9% of all workers )
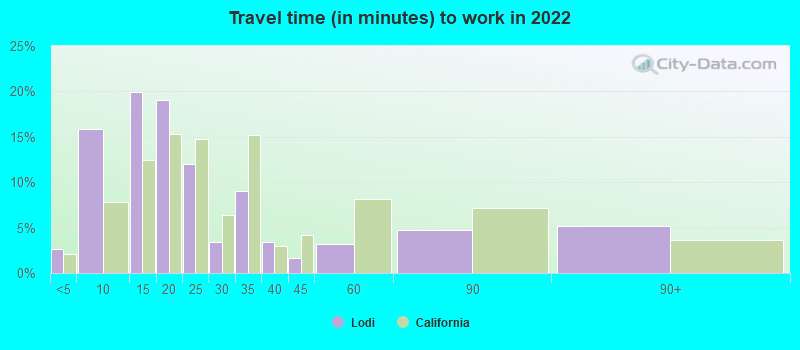
Travel time to work (commute)
Less than 5 minutes: 1,1125 to 9 minutes: 4,53510 to 14 minutes: 3,65515 to 19 minutes: 3,96520 to 24 minutes: 3,43425 to 29 minutes: 1,89730 to 34 minutes: 2,47735 to 39 minutes: 80140 to 44 minutes: 68545 to 59 minutes: 1,39560 to 89 minutes: 86590 or more minutes: 1,499
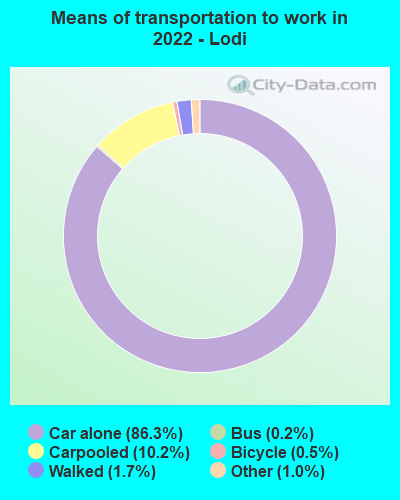
Means of transportation to work:
Drove a car alone: 23,967 (74.2%)Carpooled: 3,703 (11.5%)Bus : 51 (0.2%)Subway or elevated rail : 7 (0.0%)Long-distance train or commuter rail : 3 (0.0%)Taxi: 354 (1.1%)Bicycle: 149 (0.5%)Walked: 434 (1.3%)Worked at home: 3,366 (10.4%)
Unemployment by race in 2022
Unemployment rate for White non-Hispanic residents 4.6% Males5.9% FemalesUnemployment rate for Black residents 8.7% Males15.6% FemalesUnemployment rate for American Indian and Alaska Native residents 25.4% MalesUnemployment rate for Asian residents 6.2% Males9.0% FemalesUnemployment rate for other race residents 8.2% Males7.2% FemalesUnemployment rate for two or more race residents 9.3% Males15.0% FemalesUnemployment rate for Hispanic or Latino residents 11.2% Males6.0% Females
Year of entry for the foreign-born population in Lodi, California
5,150 2010 or later 3,683 2000 to 2009 3,135 1990 to 1999 2,472 1980 to 1989 1,211 1970 to 1979 1,651 Before 1970
First ancestries reported:
English: 2,816 (7.3%)
German: 2,747 (7.1%)
Italian: 1,423 (3.7%)
Irish: 1,210 (3.1%)
European: 1,162 (3.0%)
American: 676 (1.8%)
Dutch: 355 (0.9%)
Portuguese: 309 (0.8%)
Norwegian: 243 (0.6%)
Palestinian: 213 (0.6%)
French: 208 (0.5%)
Scottish: 174 (0.5%)
Polish: 159 (0.4%)
Eastern European: 148 (0.4%)
Danish: 127 (0.3%)
Greek: 118 (0.3%)
British: 97 (0.3%)
Swedish: 73 (0.2%)
Arab: 64 (0.2%)
Russian: 54 (0.1%)
Northern European: 54 (0.1%)
Scotch-Irish: 42 (0.1%)
German Russian: 39 (0.1%)
Egyptian: 37 (0.10%)
Welsh: 36 (0.09%)
Yugoslavian: 34 (0.09%)
Afghan: 33 (0.09%)
Ukrainian: 27 (0.07%)
Lithuanian: 20 (0.05%)
Basque: 20 (0.05%)
Hungarian: 18 (0.05%)
African: 17 (0.04%)
French Canadian: 16 (0.04%)
Austrian: 14 (0.04%)
Scandinavian: 13 (0.03%)
Armenian: 11 (0.03%)
Lebanese: 10 (0.03%)
Barbadian: 9 (0.02%)
Swiss: 8 (0.02%)
Romanian: 7 (0.02%)
Syrian: 7 (0.02%)
Finnish: 6 (0.02%)
Israeli: 6 (0.02%)
Czechoslovakian: 6 (0.02%)
Croatian: 6 (0.02%)
Cajun: 4 (0.01%)
Most common places of birth for foreign-born residents (%): Mexico Lodi:
57.5% (7,666)California:
37.2% (3,881,193)
Pakistan Lodi:
18.4% (2,447)California:
0.5% (49,399)
India Lodi:
5.9% (787)California:
5.2% (539,184)
Philippines Lodi:
3.3% (441)California:
7.8% (818,297)
Place of birth for U.S.-born residents:
This state: 41,549Other state: 8,854Northeast: 534Midwest: 2,373South: 3,749West: 2,198 87.5% of Lodi residents lived in the same house 1 years ago.
Out of people who lived in different houses, 39.5% lived in this county.
Out of people who lived in different counties, 85.1% lived in California.
Lodi:
87.5%State average:
88.9%
Education attainment for males 25 years and older:
No schooling: 1,129Nursery to 4th grade: 4195th and 6th grade: 7177th and 8th grade: 2899th grade: 6710th grade: 12011th grade: 6912th grade, no diploma: 824High school graduate (or equivalency): 6,493Less than 1 year of college: 1,745Some college more than 1 year, no degree: 3,632Associate degree: 1,145Bachelor's degree: 2,900Master's degree: 520Professional school degree: 649Doctorate degree: 175
Education attainment for females 25 years and older:
No schooling: 619Nursery to 4th grade: 2295th and 6th grade: 8857th and 8th grade: 4759th grade: 3610th grade: 6711th grade: 4212th grade, no diploma: 483High school graduate (or equivalency): 5,349Less than 1 year of college: 1,651Some college more than 1 year, no degree: 3,518Associate degree: 3,270Bachelor's degree: 4,075Master's degree: 1,479Professional school degree: 481Doctorate degree: 372
Housing units in structures:
One, detached: 16,029One, attached: 1,794Two: 883 or 4: 1,9335 to 9: 1,71110 to 19: 1,17020 to 49: 63650 or more: 1,579Mobile homes: 304Median worth of mobile homes: $115,600
Housing units lacking complete plumbing facilities in 2022: 0.9%Housing units lacking complete kitchen facilities in 2022: 3.8%House/condo owner moved in on average 10 years ago
Renter moved in on average 4 years ago
Private vs. public school enrollment:
Students in private schools in grades 1 to 8 (elementary and middle school): 672 Here:
8.5%California:
10.5%
Students in private schools in grades 9 to 12 (high school): 369 Students in private undergraduate colleges: 321 Here:
12.3%California:
15.9%