Louisville, GA (Georgia) Houses and Residents
| Louisville: | $147,551 |
| Georgia: | $297,400 |
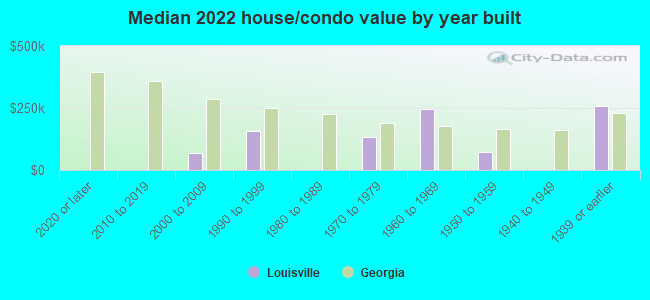
Mean price in 2022:
Detached houses: $169,583
Here: $169,583 State: $376,364 Mobile homes: $221,315
Here: $221,315 State: $102,413
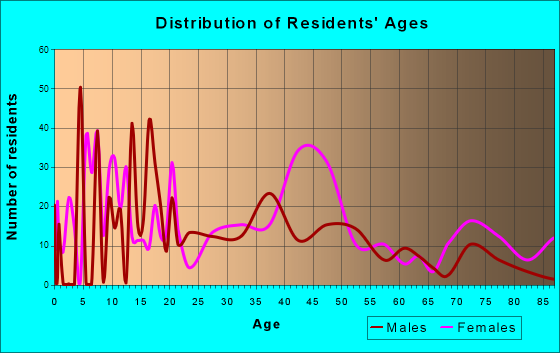
Total population: 2,370 (Urban population: 2,214 (all inside urban clusters), Rural population: 305 (all nonfarm))
Houses: 1,172 (1,001 occupied: 569 owner occupied, 443 renter occupied)
| % of renters here: | 44% |
| State: | 34% |
Housing density: 326 houses/condos per square mile
Median price asked for vacant for-sale houses and condos in 2022 in this county: $157,900.
Median contract rent in 2022: $407 (lower quartile is $246, upper quartile is $504)
Median rent asked for vacant for-rent units in 2022: $377
Median gross rent in Louisville, GA in 2022: $633
Housing units in Louisville with a mortgage: 331 (20 second mortgage, 0 home equity loan, 21 both second mortgage and home equity loan)
Houses without a mortgage: 0
Median household income for houses/condos with a mortgage: $71,072
Median household income for apartments without a mortgage: $35,822
Median monthly housing costs: $695
Compare current foreclosures near Louisville, GA:
| Photo | Address | Area | Beds / Baths | Price | Details |
|---|---|---|---|---|---|

|
#1
School St
Louisville, GA 30434
|
- sq. feet
|
- baths - beds |
$100,000
|
show details |

|
#2
Walnut St
Louisville, GA 30434
|
2,188 sq. feet
|
2 baths 4 beds |
show details | |

|
#3
Oakwood Dr
Louisville, GA 30434
|
1,976 sq. feet
|
2 baths - beds |
show details | |

|
#4
Mcbride St
Louisville, GA 30434
|
1,050 sq. feet
|
1 baths - beds |
show details | |

|
#5
Horseshoe Rd
Louisville, GA 30434
|
1,447 sq. feet
|
1 baths - beds |
show details | |

|
#6
Golf Dr
Louisville, GA 30434
|
1,952 sq. feet
|
2 baths - beds |
show details | |

|
#7
1st St
Louisville, GA 30434
|
1,568 sq. feet
|
2 baths - beds |
show details | |

|
#8
E Peachtree St
Louisville, GA 30434
|
1,475 sq. feet
|
1 baths - beds |
show details | |

|
#9
Bobby Butts Rd
Louisville, GA 30434
|
1,250 sq. feet
|
2 baths - beds |
show details | |

|
#10
Brown Terrace Rd
Louisville, GA 30434
|
1,295 sq. feet
|
1 baths - beds |
show details |
| Photo | Address | Area | Beds / Baths | Price | Details |
|---|---|---|---|---|---|

|
#11
Fairlane Dr
Louisville, GA 30434
|
1,450 sq. feet
|
2 baths - beds |
show details | |

|
#12
Us Highway 1 N
Louisville, GA 30434
|
- sq. feet
|
- baths - beds |
show details | |

|
#13
Ga Highway 171 N
Louisville, GA 30434
|
- sq. feet
|
- baths - beds |
show details | |

|
#14
Sand Valley Rd
Louisville, GA 30434
|
- sq. feet
|
- baths - beds |
show details | |

|
#15
2nd St
Louisville, GA 30434
|
- sq. feet
|
- baths - beds |
show details | |

|
#16
Walnut St
Louisville, GA 30434
|
- sq. feet
|
- baths - beds |
show details | |

|
#17
Middleground Rd Apt C1
Louisville, GA 30434
|
- sq. feet
|
- baths - beds |
show details | |

|
#18
2nd St
Louisville, GA 30434
|
- sq. feet
|
- baths - beds |
show details | |

|
#19
E 7th St
Louisville, GA 30434
|
- sq. feet
|
- baths - beds |
show details | |

|
#20
Saint Claire Rd
Louisville, GA 30434
|
- sq. feet
|
- baths - beds |
show details |
| Photo | Address | Area | Beds / Baths | Price | Details |
|---|---|---|---|---|---|

|
#21
N Thompson St
Wrens, GA 30833
|
1,493 sq. feet
|
2 baths 3 beds |
show details | |

|
#22
Heards Bridge Rd
Bartow, GA 30413
|
2,881 sq. feet
|
2 baths - beds |
show details | |

|
#23
Cobb Rd
Midville, GA 30441
|
1,000 sq. feet
|
2 baths 3 beds |
show details | |

|
#24
Drone Rd
Waynesboro, GA 30830
|
1,000 sq. feet
|
1 baths 3 beds |
show details | |

|
#25
Old Stapleton Rd
Stapleton, GA 30823
|
1,607 sq. feet
|
2 baths - beds |
show details | |

|
#26
N Thompson St
Wrens, GA 30833
|
1,548 sq. feet
|
1 baths - beds |
show details | |

|
#27
Baltimore Dr
Wrens, GA 30833
|
1,275 sq. feet
|
1 baths - beds |
show details | |

|
#28
Cotton St
Wrens, GA 30833
|
1,389 sq. feet
|
1 baths - beds |
show details | |

|
#29
Campground Rd
Wrens, GA 30833
|
1,860 sq. feet
|
2 baths - beds |
show details | |

|
#30
Green Grove Church Rd
Swainsboro, GA 30401
|
980 sq. feet
|
1 baths - beds |
show details |
| Photo | Address | Area | Beds / Baths | Price | Details |
|---|---|---|---|---|---|

|
#31
Donald Cobb Rd
Bartow, GA 30413
|
1,125 sq. feet
|
1 baths - beds |
show details | |

|
#32
N Main St
Wadley, GA 30477
|
1,285 sq. feet
|
2 baths - beds |
show details | |

|
#33
Church St
Bartow, GA 30413
|
1,450 sq. feet
|
1 baths - beds |
show details | |

|
#34
Sargent St
Wadley, GA 30477
|
1,132 sq. feet
|
2 baths - beds |
show details | |

|
#35
Fj Hart Rd
Wadley, GA 30477
|
1,174 sq. feet
|
1 baths - beds |
show details | |

|
#36
Mount Moriah Rd
Matthews, GA 30818
|
1,954 sq. feet
|
2 baths - beds |
show details | |

|
#37
Bartow Dublin Rd
Bartow, GA 30413
|
- sq. feet
|
- baths - beds |
show details | |

|
#38
Georgia 24
Sandersville, GA 31082
|
- sq. feet
|
- baths - beds |
show details | |

|
#39
Ga Highway 24 E
Sandersville, GA 31082
|
- sq. feet
|
- baths - beds |
show details | |

|
#40
Pinetucky Rd
Wadley, GA 30477
|
- sq. feet
|
- baths - beds |
show details |
| Photo | Address | Area | Beds / Baths | Price | Details |
|---|---|---|---|---|---|

|
#41
Spurgon Cir
Wrens, GA 30833
|
- sq. feet
|
- baths - beds |
show details | |

|
#42
Spurgon Rd
Wrens, GA 30833
|
- sq. feet
|
- baths - beds |
show details | |

|
#43
Ga Highway 88
Wrens, GA 30833
|
- sq. feet
|
- baths - beds |
show details | |

|
#44
Farm Lane Rd
Wrens, GA 30833
|
- sq. feet
|
1 baths - beds |
show details | |

|
#45
N Green St
Avera, GA 30803
|
- sq. feet
|
- baths - beds |
show details | |

|
#46
Hoyt Braswell Rd # A
Wrens, GA 30833
|
- sq. feet
|
- baths - beds |
show details | |

|
#47
Kingston Dr
Wrens, GA 30833
|
- sq. feet
|
- baths - beds |
show details | |

|
#48
Sunshine Ct
Avera, GA 30803
|
- sq. feet
|
- baths - beds |
show details | |

|
#49
Sunshine Ct
Avera, GA 30803
|
- sq. feet
|
- baths - beds |
show details | |

|
Check over 1 million property listings on Foreclosure.com!
|
browse all offers | |||

Latest news about housing in Louisville, GA collected exclusively by city-data.com from local newspapers, TV, and radio stations


Median year apartment built: 1967
Household type by relationship:
Households: 2,752- Male householders: 377 (103 living alone), Female householders: 616 (223 living alone)
269 spouses (269 opposite-sex spouses), 44 unmarried partners, (44 opposite-sex unmarried partners), 1,094 children (1,082 natural, 11 adopted, 0 stepchildren), 67 grandchildren, 20 brothers or sisters, 8 parents, 0 foster children, 50 other relatives, 4 non-relatives
- In group quarters: 198
Size of family households: 274 2-persons, 194 3-persons, 137 4-persons, 42 5-persons, 8 7-or-more-persons.
Size of nonfamily households: 328 1-person, 21 2-persons.
288 married couples with children.
352 single-parent households (13 men, 339 women).
93.1% of residents of Louisville speak English at home.
5.9% of residents speak Spanish at home (15% speak English very well, 35% speak English well, 50% speak English not well).
Foreign born population: 117 (4.3%)
(5.1% of them are naturalized citizens)
| Here: | 6.5 |
| State: | 6.8 |
| Here: | 4.8 |
| State: | 4.6 |
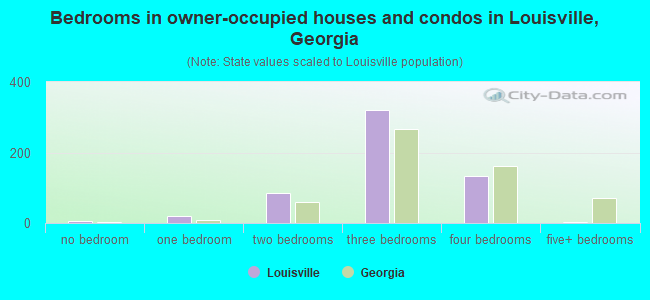
- Bedrooms in owner-occupied houses and condos in Louisville, Georgia
- 6no bedroom
- 211 bedroom
- 862 bedrooms
- 3203 bedrooms
- 1334 bedrooms
- 35+ bedrooms
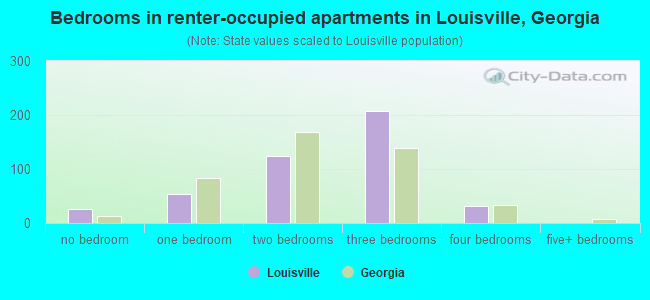
- Bedrooms in renter-occupied apartments in Louisville, Georgia
- 26no bedroom
- 541 bedroom
- 1242 bedrooms
- 2073 bedrooms
- 324 bedrooms
- 05+ bedrooms
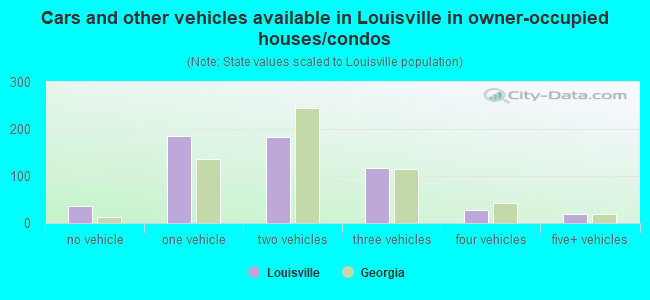
- Cars and other vehicles available in Louisville in owner-occupied houses/condos
- 37no vehicle
- 1861 vehicle
- 1842 vehicles
- 1173 vehicles
- 274 vehicles
- 195+ vehicles
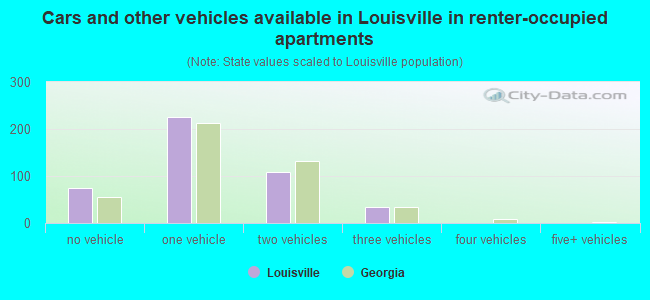
- Cars and other vehicles available in Louisville in renter-occupied apartments
- 75no vehicle
- 2261 vehicle
- 1092 vehicles
- 343 vehicles
- 04 vehicles
- 05+ vehicles
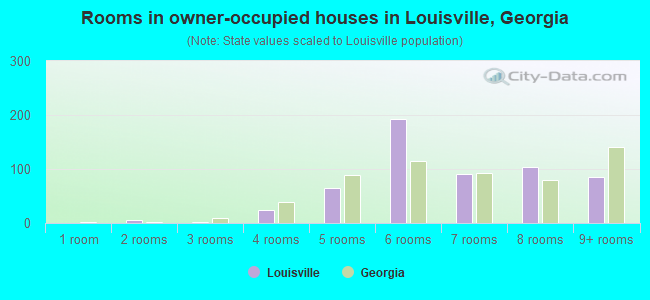
- Rooms in owner-occupied houses in Louisville, Georgia
- 01 room
- 62 rooms
- 23 rooms
- 254 rooms
- 655 rooms
- 1936 rooms
- 907 rooms
- 1038 rooms
- 859+ rooms
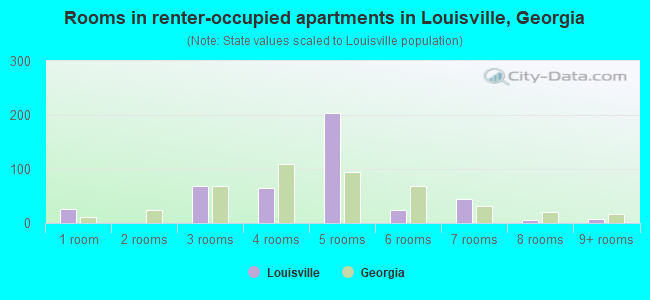
- Rooms in renter-occupied apartments in Louisville, Georgia
- 261 room
- 02 rooms
- 683 rooms
- 654 rooms
- 2035 rooms
- 246 rooms
- 447 rooms
- 58 rooms
- 89+ rooms
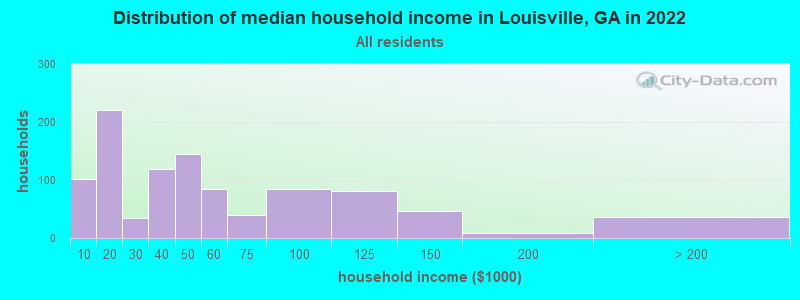
Louisville, GA household income distribution

- 102Less than $10,000
- 221$10,000 to $19,999
- 34$20,000 to $29,999
- 119$30,000 to $39,999
- 144$40,000 to $49,999
- 85$50,000 to $59,999
- 39$60,000 to $74,999
- 84$75,000 to $99,999
- 81$100,000 to $124,999
- 46$125,000 to $149,999
- 9$150,000 to $199,999
- 37$200,000 or more
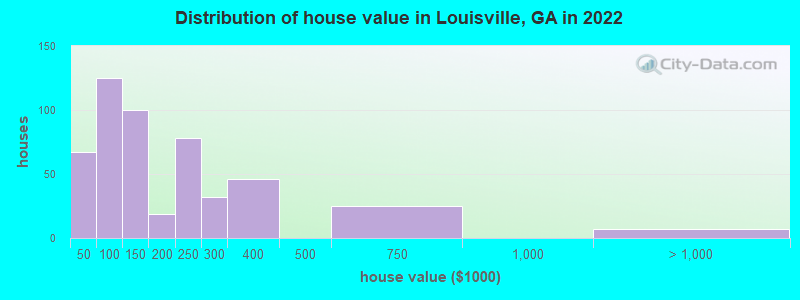
Home value of owner - occupied houses in 2022 in Louisville, GA
-
- 28Less than $10,000
- 19$20,000 to $24,999
- 10$25,000 to $29,999
- 7$30,000 to $34,999
- 53$50,000 to $59,999
- 1$60,000 to $69,999
- 58$70,000 to $79,999
- 10$90,000 to $99,999
- 65$100,000 to $124,999
- 34$125,000 to $149,999
- 5$150,000 to $174,999
- 13$175,000 to $199,999
- 78$200,000 to $249,999
- 32$250,000 to $299,999
- 46$300,000 to $399,999
- 25$500,000 to $749,999
- 7$1,000,000 to $1,499,999
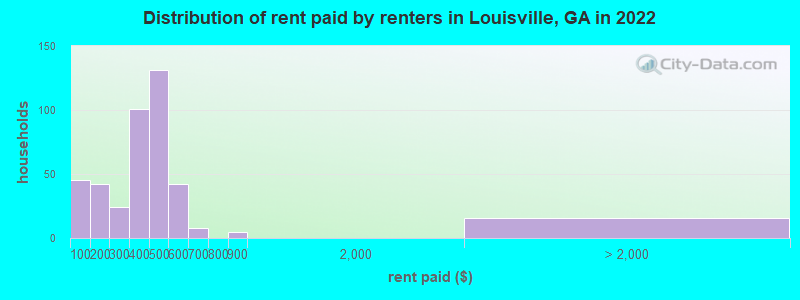
Rent paid by renters in 2022 in Louisville, GA
-
- 45Less than $100
- 41$150 to $199
- 13$200 to $249
- 11$250 to $299
- 46$300 to $349
- 55$350 to $399
- 78$400 to $449
- 52$450 to $499
- 22$500 to $549
- 19$550 to $599
- 8$600 to $649
- 4$800 to $899
- 15No cash rent
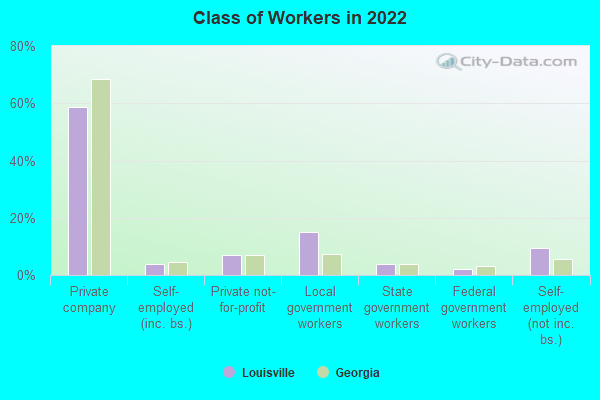
Percentage of workers working in this county: 53.2%
Number of people working at home: 4 (0.4% of all workers)
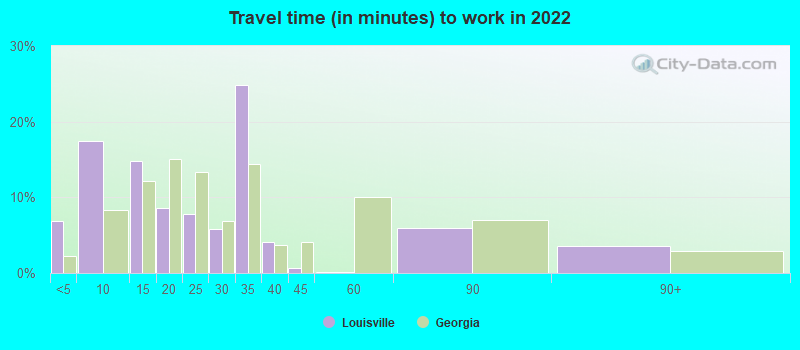
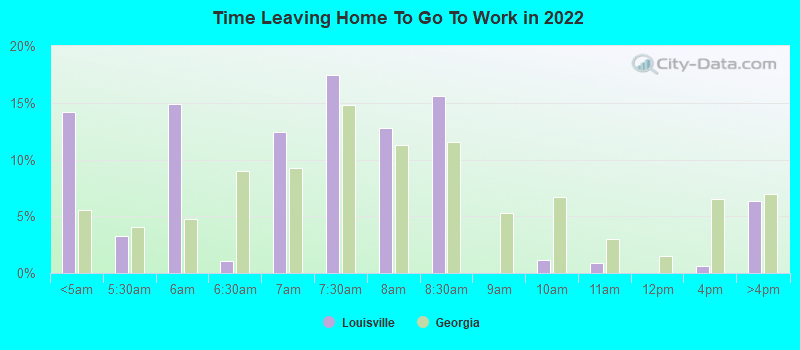
Travel time to work (commute)
- Less than 5 minutes: 4
- 5 to 9 minutes: 154
- 10 to 14 minutes: 116
- 15 to 19 minutes: 127
- 20 to 24 minutes: 82
- 25 to 29 minutes: 11
- 30 to 34 minutes: 192
- 35 to 39 minutes: 5
- 40 to 44 minutes: 21
- 45 to 59 minutes: 149
- 60 to 89 minutes: 70
- 90 or more minutes: 37
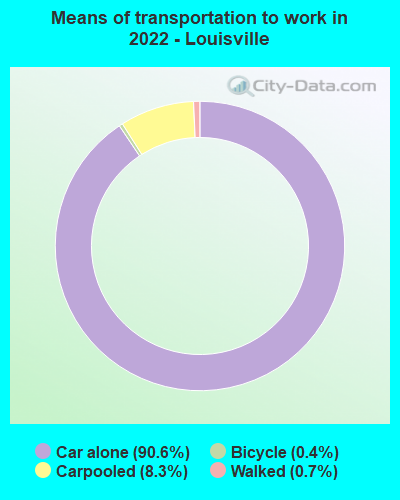
Means of transportation to work:
- Drove a car alone: 1,064 (85.9%)
- Carpooled: 102 (8.2%)
- Bicycle: 4 (0.3%)
- Walked: 8 (0.6%)
- Worked at home: 4 (0.3%)
- Unemployment by race in 2022
- Unemployment rate for White non-Hispanic residents
- 2.7%Males
- Unemployment rate for Black residents
- 5.2%Males
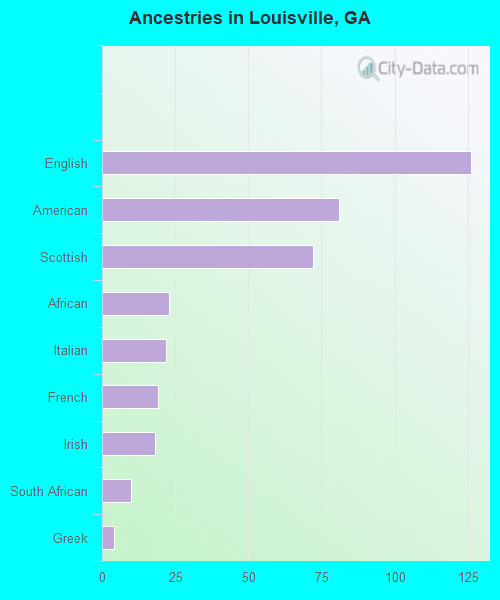
First ancestries reported:
- English: 126 (7.4%)
- American: 81 (4.7%)
- Scottish: 72 (4.2%)
- African: 23 (1.3%)
- Italian: 22 (1.3%)
- French: 19 (1.1%)
- Irish: 18 (1.1%)
- South African: 10 (0.6%)
- Greek: 4 (0.2%)
Most common places of birth for foreign-born residents (%):
| Louisville: | 88.9% (104) |
| Georgia: | 20.0% (223,400) |
| Louisville: | 6.0% (7) |
| Georgia: | 0.5% (6,116) |
Place of birth for U.S.-born residents:
- This state: 2,317
- Other state: 273
- Northeast: 51
- Midwest: 22
- South: 79
- West: 122
93.5% of Louisville residents lived in the same house 1 years ago.
Out of people who lived in different houses, 32.2% lived in this county.
Out of people who lived in different counties, 88.0% lived in Georgia.
| Louisville: | 93.5% |
| State average: | 86.6% |
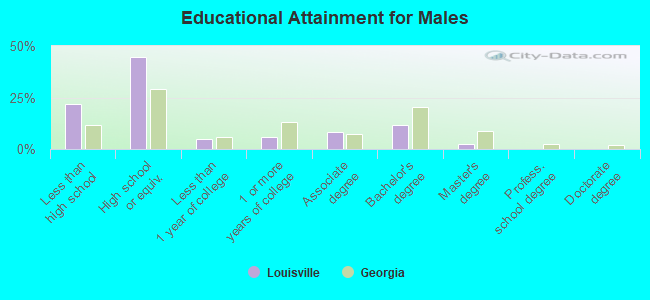
Education attainment for males 25 years and older:
- No schooling: 31
- Nursery to 4th grade: 20
- 5th and 6th grade: 16
- 7th and 8th grade: 7
- 9th grade: 29
- 10th grade: 38
- 11th grade: 43
- 12th grade, no diploma: 10
- High school graduate (or equivalency): 396
- Less than 1 year of college: 44
- Some college more than 1 year, no degree: 53
- Associate degree: 73
- Bachelor's degree: 104
- Master's degree: 22
- Professional school degree: 0
- Doctorate degree: 0
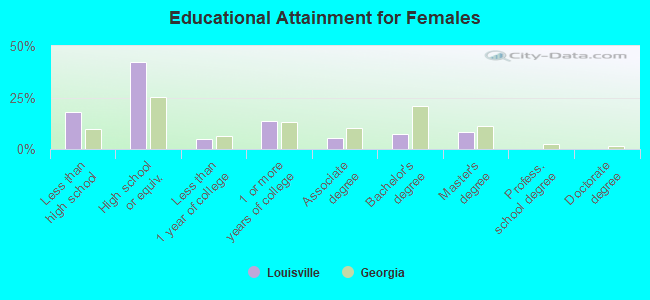
Education attainment for females 25 years and older:
- No schooling: 22
- Nursery to 4th grade: 0
- 5th and 6th grade: 52
- 7th and 8th grade: 23
- 9th grade: 1
- 10th grade: 31
- 11th grade: 6
- 12th grade, no diploma: 25
- High school graduate (or equivalency): 373
- Less than 1 year of college: 44
- Some college more than 1 year, no degree: 121
- Associate degree: 49
- Bachelor's degree: 66
- Master's degree: 71
- Professional school degree: 0
- Doctorate degree: 0
Housing units in structures:
- One, detached: 925
- Two: 127
- 5 to 9: 6
- 20 to 49: 2
- Mobile homes: 110
Housing units lacking complete kitchen facilities in 2022: 5.0%
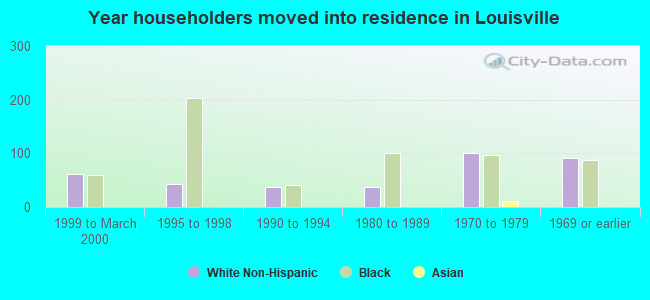
House/condo owner moved in on average 19 years ago
Renter moved in on average 6 years ago
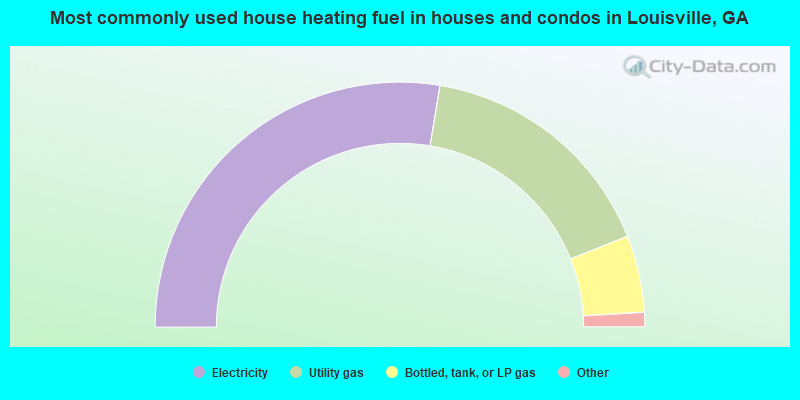
- 55.4%Electricity
- 32.8%Utility gas
- 10.2%Bottled, tank, or LP gas
- 0.9%Wood
- 0.7%No fuel used
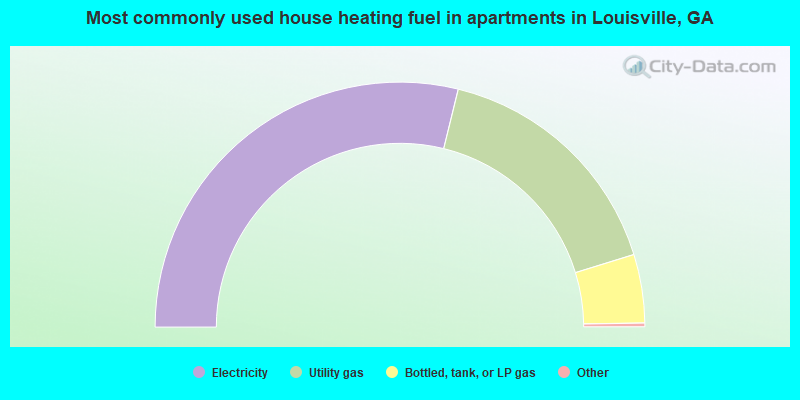
- 57.9%Electricity
- 32.9%Utility gas
- 9.1%Bottled, tank, or LP gas
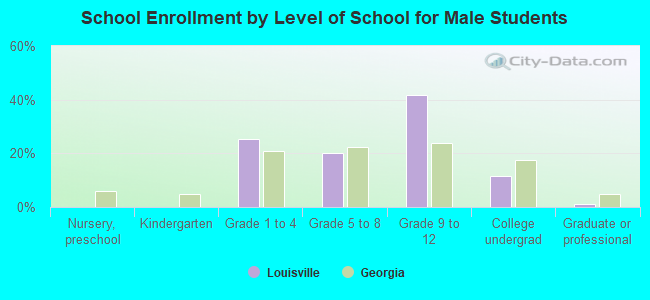
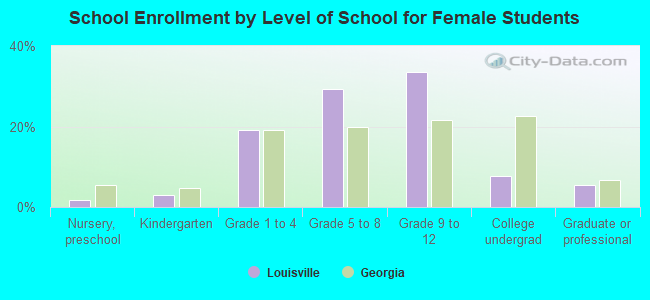
Private vs. public school enrollment:
| Here: | 24.8% |
| Georgia: | 12.1% |
| Here: | 41.5% |
| Georgia: | 10.8% |
| Here: | 19.7% |
| Georgia: | 17.1% |