Ludlow, IL (Illinois) Houses and Residents
| Ludlow: | $67,194 |
| Illinois: | $251,600 |
Mean price in 2022:
Detached houses: $92,442
Here: $92,442 State: $310,164 Mobile homes: $35,579
Here: $35,579 State: $78,855
Total population: 367 (Urban population: 0, Rural population: 297 (all nonfarm))
Houses: 182 (136 occupied: 87 owner occupied, 50 renter occupied)
| % of renters here: | 36% |
| State: | 33% |
Housing density: 524 houses/condos per square mile
Median price asked for vacant for-sale houses and condos in 2022: $250,648.
Median contract rent in 2022: $425 (lower quartile is $353, upper quartile is $653)
Median rent asked for vacant for-rent units in 2022: $5,299
Median gross rent in Ludlow, IL in 2022: $533
Housing units in Ludlow with a mortgage: 46 (0 second mortgage, 0 home equity loan, 0 both second mortgage and home equity loan)
Houses without a mortgage: 0
Median household income for houses/condos with a mortgage: $51,821
Median household income for apartments without a mortgage: $44,123
Median monthly housing costs: $620
Compare current foreclosures near Ludlow, IL:
| Photo | Address | Area | Beds / Baths | Price | Details |
|---|---|---|---|---|---|

|
#1
N Church St
Ludlow, IL 60949
|
- sq. feet
|
- baths - beds |
show details | |

|
#2
W Ludlow St
Ludlow, IL 60949
|
- sq. feet
|
- baths - beds |
show details | |

|
#3
W Weldon St
Roberts, IL 60962
|
1,185 sq. feet
|
1 baths 3 beds |
$145,000
|
show details |

|
#4
S Main St
Gifford, IL 61847
|
2,200 sq. feet
|
2 baths 4 beds |
$165,000
|
show details |

|
#5
N Church St
Gibson City, IL 60936
|
3,507 sq. feet
|
3 baths 4 beds |
$69,900
|
show details |

|
#6
N Lawrence St
Gibson City, IL 60936
|
1,050 sq. feet
|
1 baths 3 beds |
show details | |

|
#7
S Sangamon Ave
Gibson City, IL 60936
|
1,503 sq. feet
|
3 baths 3 beds |
show details | |

|
#8
W Franklin St
Paxton, IL 60957
|
1,990 sq. feet
|
1 baths 4 beds |
show details | |

|
#9
W Center St
Paxton, IL 60957
|
1,782 sq. feet
|
2 baths 3 beds |
show details | |

|
#10
S Main St
Gifford, IL 61847
|
888 sq. feet
|
2 baths - beds |
show details |
| Photo | Address | Area | Beds / Baths | Price | Details |
|---|---|---|---|---|---|

|
#11
Oak Pl
Rantoul, IL 61866
|
2,087 sq. feet
|
2 baths - beds |
show details | |

|
#12
E Willard St
Gifford, IL 61847
|
1,031 sq. feet
|
1 baths - beds |
show details | |

|
#13
E Grove Ave
Rantoul, IL 61866
|
800 sq. feet
|
1 baths - beds |
show details | |

|
#14
Prospect Ave
Paxton, IL 60957
|
- sq. feet
|
2 baths 5 beds |
show details | |

|
#15
S John St
Thomasboro, IL 61878
|
3,100 sq. feet
|
4 baths - beds |
show details | |

|
#16
Collier Ave
Rantoul, IL 61866
|
- sq. feet
|
- baths - beds |
show details | |

|
#17
Abram Dr
Rantoul, IL 61866
|
- sq. feet
|
- baths - beds |
show details | |

|
#18
N Maple St
Loda, IL 60948
|
- sq. feet
|
- baths - beds |
show details | |

|
#19
Kaufman Dr
Loda, IL 60948
|
- sq. feet
|
- baths - beds |
show details | |

|
#20
Saint Andrews Cir
Rantoul, IL 61866
|
- sq. feet
|
- baths - beds |
show details |
| Photo | Address | Area | Beds / Baths | Price | Details |
|---|---|---|---|---|---|

|
#21
Juniper Dr Apt 5
Rantoul, IL 61866
|
- sq. feet
|
- baths - beds |
show details | |

|
#22
Pinoak Ln
Rantoul, IL 61866
|
- sq. feet
|
- baths - beds |
show details | |

|
#23
E Champaign Ave
Rantoul, IL 61866
|
- sq. feet
|
- baths - beds |
show details | |

|
#24
Cr 3500n
Penfield, IL 61862
|
- sq. feet
|
- baths - beds |
show details | |

|
#25
E 7th St Apt 2
Gibson City, IL 60936
|
- sq. feet
|
- baths - beds |
show details | |

|
#26
E Cemetery Rd
Roberts, IL 60962
|
- sq. feet
|
- baths - beds |
show details | |

|
#27
E Sangamon Ave
Rantoul, IL 61866
|
- sq. feet
|
- baths - beds |
show details | |

|
#28
N Drive
Rantoul, IL 61866
|
- sq. feet
|
- baths - beds |
show details | |

|
#29
S Thompson St
Melvin, IL 60952
|
- sq. feet
|
- baths - beds |
show details | |

|
#30
County Road 3300 N
Rantoul, IL 61866
|
- sq. feet
|
- baths - beds |
show details |
| Photo | Address | Area | Beds / Baths | Price | Details |
|---|---|---|---|---|---|

|
#31
Mitchell Ct
Rantoul, IL 61866
|
- sq. feet
|
- baths - beds |
show details | |

|
#32
Arcadia Dr
Rantoul, IL 61866
|
- sq. feet
|
- baths - beds |
show details | |

|
#33
County Road 2600 N
Mahomet, IL 61853
|
- sq. feet
|
- baths - beds |
show details | |

|
#34
North St
Fisher, IL 61843
|
- sq. feet
|
- baths - beds |
show details | |

|
#35
Navaho Ln
Loda, IL 60948
|
- sq. feet
|
- baths - beds |
show details | |

|
#36
County Road 3500 N
Penfield, IL 61862
|
- sq. feet
|
- baths - beds |
show details | |

|
#37
E 100n Rd
Gibson City, IL 60936
|
- sq. feet
|
- baths - beds |
show details | |

|
#38
E 700 North Rd
Buckley, IL 60918
|
- sq. feet
|
- baths - beds |
show details | |

|
#39
3rd St
Foosland, IL 61845
|
- sq. feet
|
- baths - beds |
show details | |

|
#40
W Champaign Ave
Rantoul, IL 61866
|
- sq. feet
|
- baths - beds |
show details |
| Photo | Address | Area | Beds / Baths | Price | Details |
|---|---|---|---|---|---|

|
#41
Arends Blvd
Rantoul, IL 61866
|
- sq. feet
|
- baths - beds |
show details | |

|
#42
W Center St
Paxton, IL 60957
|
- sq. feet
|
- baths - beds |
show details | |

|
#43
North Dr
Rantoul, IL 61866
|
- sq. feet
|
- baths - beds |
show details | |

|
#44
Steven Dr
Rantoul, IL 61866
|
- sq. feet
|
- baths - beds |
show details | |

|
#45
Englewood Dr
Rantoul, IL 61866
|
- sq. feet
|
- baths - beds |
show details | |

|
#46
Illinois Dr
Rantoul, IL 61866
|
- sq. feet
|
- baths - beds |
show details | |

|
#47
W Orleans St
Paxton, IL 60957
|
- sq. feet
|
- baths - beds |
show details | |

|
#48
S Fall St
Paxton, IL 60957
|
- sq. feet
|
- baths - beds |
show details | |

|
#49
E Sangamon Ave
Rantoul, IL 61866
|
- sq. feet
|
- baths - beds |
show details | |

|
Check over 1 million property listings on Foreclosure.com!
|
browse all offers | |||

Latest news about housing in Ludlow, IL collected exclusively by city-data.com from local newspapers, TV, and radio stations

 | Job in Rantoul. WHERE DO I LIVE? URGENT!! HELP!! (7 replies) |

Median year apartment built: 1954
Household type by relationship:
Households: 338- Male householders: 74 (23 living alone), Female householders: 60 (29 living alone)
28 spouses (28 opposite-sex spouses), 25 unmarried partners, (25 opposite-sex unmarried partners), 76 children (65 natural, 9 adopted, 2 stepchildren), 19 grandchildren, 14 brothers or sisters, 11 parents, 0 foster children, 9 other relatives, 22 non-relatives
Size of family households: 35 2-persons, 5 3-persons, 15 4-persons, 4 5-persons, 2 7-or-more-persons.
Size of nonfamily households: 55 1-person, 7 2-persons, 12 3-persons.
13 married couples with children.
38 single-parent households (32 men, 6 women).
88.5% of residents of Ludlow speak English at home.
7.7% of residents speak Spanish at home (29% speak English very well, 71% speak English well).
2.2% of residents speak other Indo-European language at home (100% speak English very well).
0.6% of residents speak Asian or Pacific Island language at home (100% speak English very well).
Foreign born population: 2 (0.6%)
(100.0% of them are naturalized citizens)
| Here: | 6.6 |
| State: | 6.4 |
| Here: | 5.2 |
| State: | 4.1 |

- Bedrooms in owner-occupied houses and condos in Ludlow, Illinois
- 0no bedroom
- 11 bedroom
- 242 bedrooms
- 503 bedrooms
- 114 bedrooms
- 15+ bedrooms

- Bedrooms in renter-occupied apartments in Ludlow, Illinois
- 0no bedroom
- 51 bedroom
- 142 bedrooms
- 253 bedrooms
- 24 bedrooms
- 45+ bedrooms

- Cars and other vehicles available in Ludlow in owner-occupied houses/condos
- 8no vehicle
- 351 vehicle
- 302 vehicles
- 133 vehicles
- 14 vehicles
- 05+ vehicles

- Cars and other vehicles available in Ludlow in renter-occupied apartments
- 4no vehicle
- 281 vehicle
- 62 vehicles
- 103 vehicles
- 24 vehicles
- 05+ vehicles

- Rooms in owner-occupied houses in Ludlow, Illinois
- 01 room
- 02 rooms
- 03 rooms
- 24 rooms
- 235 rooms
- 186 rooms
- 187 rooms
- 48 rooms
- 229+ rooms

- Rooms in renter-occupied apartments in Ludlow, Illinois
- 01 room
- 12 rooms
- 03 rooms
- 144 rooms
- 145 rooms
- 56 rooms
- 67 rooms
- 28 rooms
- 79+ rooms


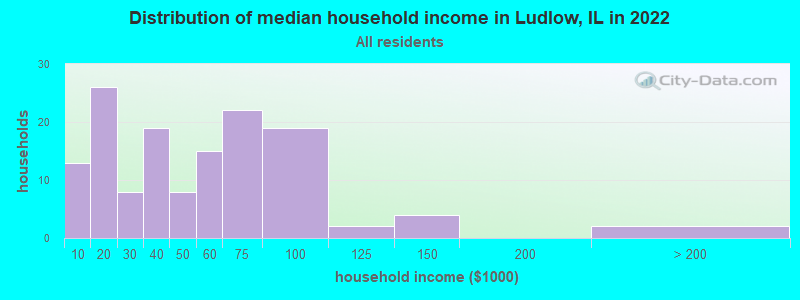
Ludlow, IL household income distribution

- 13Less than $10,000
- 26$10,000 to $19,999
- 8$20,000 to $29,999
- 19$30,000 to $39,999
- 8$40,000 to $49,999
- 15$50,000 to $59,999
- 22$60,000 to $74,999
- 19$75,000 to $99,999
- 2$100,000 to $124,999
- 4$125,000 to $149,999
- 2$200,000 or more
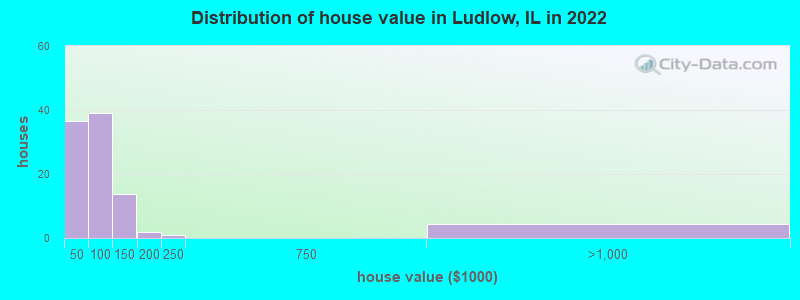
Home value of owner - occupied houses in 2022 in Ludlow, IL
-
- 1Less than $10,000
- 12$10,000 to $14,999
- 2$20,000 to $24,999
- 1$30,000 to $34,999
- 10$35,000 to $39,999
- 8$40,000 to $49,999
- 3$50,000 to $59,999
- 14$60,000 to $69,999
- 6$70,000 to $79,999
- 3$80,000 to $89,999
- 1$90,000 to $99,999
- 1$100,000 to $124,999
- 12$125,000 to $149,999
- 1$150,000 to $174,999
- 0$175,000 to $199,999
- 0$200,000 to $249,999
- 4$750,000 to $999,999
Rent paid by renters in 2022 in Ludlow, IL
-
- 16$300 to $349
- 6$350 to $399
- 19$400 to $449
- 0$450 to $499
- 4$500 to $549
- 1$550 to $599
- 6$650 to $699
- 3$800 to $899
- 2$900 to $999
- 1$1,250 to $1,499
- 2No cash rent


Percentage of workers working in this county: 88.5%
Number of people working at home: 4 (2.6% of all workers)
Travel time to work (commute)
- Less than 5 minutes: 0
- 5 to 9 minutes: 0
- 10 to 14 minutes: 30
- 15 to 19 minutes: 24
- 20 to 24 minutes: 11
- 25 to 29 minutes: 3
- 30 to 34 minutes: 36
- 35 to 39 minutes: 2
- 40 to 44 minutes: 6
- 45 to 59 minutes: 19
- 60 to 89 minutes: 0
- 90 or more minutes: 0
Means of transportation to work:
- Drove a car alone: 127 (77.9%)
- Carpooled: 27 (16.6%)
- Taxi: 2 (1.2%)
- Walked: 4 (2.5%)
- Other means: 3 (1.8%)

- Unemployment by race in 2022
- Unemployment rate for White non-Hispanic residents
- 25.4%Males
- 4.7%Females

- Year of entry for the foreign-born population in Ludlow, Illinois
- 02010 or later
- 02000 to 2009
- 11990 to 1999
- 01980 to 1989
- 31970 to 1979
- 2Before 1970

First ancestries reported:
- Italian: 15 (16.8%)
- Irish: 13 (14.6%)
- Polish: 11 (12.3%)
- German: 6 (6.7%)
- English: 3 (3.4%)
- American: 2 (2.2%)
- Swedish: 2 (2.2%)
- Czech: 1 (1.1%)
Most common places of birth for foreign-born residents (%):
Place of birth for U.S.-born residents:
- This state: 241
- Other state: 72
- Northeast: 13
- Midwest: 20
- South: 23
- West: 14
87.7% of Ludlow residents lived in the same house 1 years ago.
Out of people who lived in different houses, 45.3% lived in this county.
Out of people who lived in different counties, 0.0% lived in Illinois.
| Ludlow: | 87.7% |
| State average: | 88.3% |
Education attainment for males 25 years and older:
- No schooling: 0
- Nursery to 4th grade: 0
- 5th and 6th grade: 0
- 7th and 8th grade: 0
- 9th grade: 2
- 10th grade: 2
- 11th grade: 3
- 12th grade, no diploma: 0
- High school graduate (or equivalency): 46
- Less than 1 year of college: 6
- Some college more than 1 year, no degree: 18
- Associate degree: 1
- Bachelor's degree: 3
- Master's degree: 0
- Professional school degree: 0
- Doctorate degree: 0

Education attainment for females 25 years and older:
- No schooling: 0
- Nursery to 4th grade: 0
- 5th and 6th grade: 0
- 7th and 8th grade: 0
- 9th grade: 0
- 10th grade: 3
- 11th grade: 1
- 12th grade, no diploma: 13
- High school graduate (or equivalency): 49
- Less than 1 year of college: 4
- Some college more than 1 year, no degree: 16
- Associate degree: 6
- Bachelor's degree: 1
- Master's degree: 0
- Professional school degree: 0
- Doctorate degree: 7


Housing units in structures:
- One, detached: 132
- Two: 6
- 3 or 4: 4
- 10 to 19: 2
- Mobile homes: 37
Housing units lacking complete kitchen facilities in 2022: 5.0%
House/condo owner moved in on average 17 years ago
Renter moved in on average 6 years ago

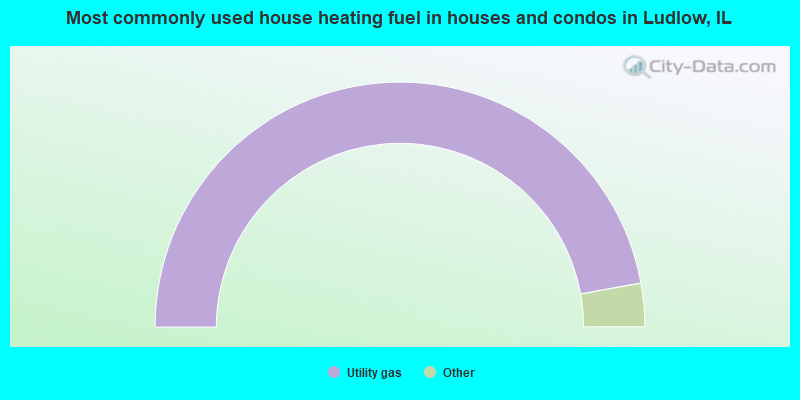
- 95.3%Utility gas
- 3.5%Bottled, tank, or LP gas
- 1.2%Electricity
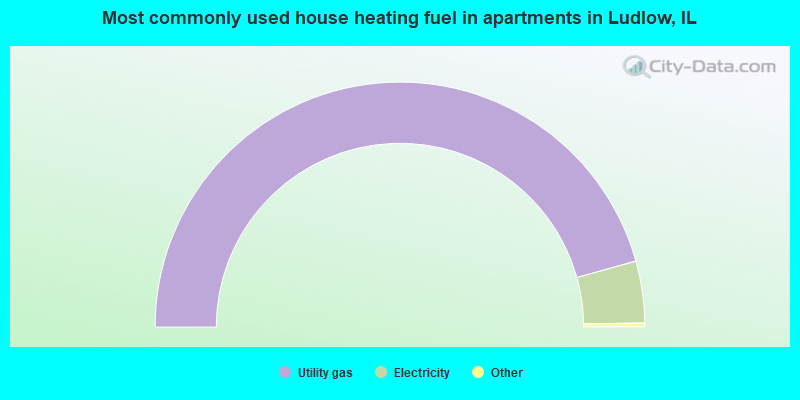
- 91.8%Utility gas
- 8.2%Electricity
Private vs. public school enrollment:
| Here: | 7.3% |
| Illinois: | 13.3% |
| Here: | 100.0% |
| Illinois: | 9.9% |
| Here: | 22.2% |
| Illinois: | 27.4% |


