Lyman, NH (New Hampshire) Houses and Residents
| Lyman: | $316,746 |
| New Hampshire: | $384,700 |
Total population: 533 (Urban population: 0, Rural population: 480 (22 farm, 458 nonfarm))
Houses: 272 (206 occupied: 188 owner occupied, 18 renter occupied)
| % of renters here: | 9% |
| State: | 28% |
Housing density: 10 houses/condos per square mile
Median price asked for vacant for-sale houses and condos in 2022 in this county: $210,911.
Median contract rent in 2022: $790 (lower quartile is $702, upper quartile is $1,236)
Median gross rent in Lyman, NH in 2022: $926
Housing units in Lyman with a mortgage: 56 (6 second mortgage, 7 home equity loan, 0 both second mortgage and home equity loan)
Houses without a mortgage: 43


Household type by relationship:
Households: 82,117- In family households: 63,633 (15,537 male householders, 6,537 female householders)
17,631 spouses, 19,508 children (17,981 natural, 564 adopted, 963 stepchildren), 929 grandchildren, 338 brothers or sisters, 482 parents, foster children, 353 other relatives, 1,921 non-relatives
- In nonfamily households: 18,484 (6,671 male householders (4,834 living alone)), 7,241 female householders (5,759 living alone)), 4,572 nonrelatives
- In group quarters: 7,001 (674 institutionalized population)
12,855 married couples with children.
3,805 single-parent households (1,075 men, 2,730 women).
99.6% of residents of Lyman speak English at home.
0.4% of residents speak other Indo-European language at home (100% speak English very well).
Foreign born population: 19 (3.6%)
(63.2% of them are naturalized citizens)
| Here: | 5.3 |
| State: | 6.4 |
| Here: | 3.9 |
| State: | 4.0 |

- Bedrooms in owner-occupied houses and condos in Lyman, New Hampshire
- 0no bedroom
- 121 bedroom
- 562 bedrooms
- 1043 bedrooms
- 114 bedrooms
- 55+ bedrooms

- Bedrooms in renter-occupied apartments in Lyman, New Hampshire
- 0no bedroom
- 71 bedroom
- 92 bedrooms
- 23 bedrooms
- 04 bedrooms
- 05+ bedrooms

- Cars and other vehicles available in Lyman in owner-occupied houses/condos
- 3no vehicle
- 521 vehicle
- 1022 vehicles
- 243 vehicles
- 74 vehicles
- 05+ vehicles

- Cars and other vehicles available in Lyman in renter-occupied apartments
- 2no vehicle
- 91 vehicle
- 72 vehicles
- 03 vehicles
- 04 vehicles
- 05+ vehicles

- Rooms in owner-occupied houses in Lyman, New Hampshire
- 01 room
- 02 rooms
- 83 rooms
- 264 rooms
- 585 rooms
- 666 rooms
- 217 rooms
- 08 rooms
- 99+ rooms

- Rooms in renter-occupied apartments in Lyman, New Hampshire
- 01 room
- 02 rooms
- 53 rooms
- 44 rooms
- 95 rooms
- 06 rooms
- 07 rooms
- 08 rooms
- 09+ rooms


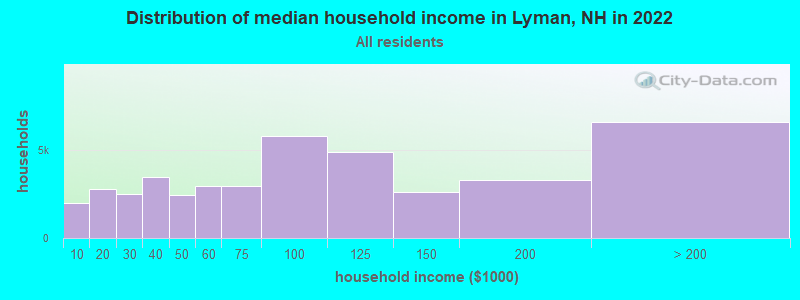
Lyman, NH household income distribution

- 2,003Less than $10,000
- 2,748$10,000 to $19,999
- 2,498$20,000 to $29,999
- 3,469$30,000 to $39,999
- 2,426$40,000 to $49,999
- 2,918$50,000 to $59,999
- 2,910$60,000 to $74,999
- 5,737$75,000 to $99,999
- 4,886$100,000 to $124,999
- 2,621$125,000 to $149,999
- 3,268$150,000 to $199,999
- 6,554$200,000 or more
Percentage of workers working in this county: 91.8%
Number of people working at home: 55 (17.5% of all workers)
Travel time to work (commute)
- Less than 5 minutes: 4
- 5 to 9 minutes: 17
- 10 to 14 minutes: 31
- 15 to 19 minutes: 47
- 20 to 24 minutes: 62
- 25 to 29 minutes: 24
- 30 to 34 minutes: 31
- 35 to 39 minutes: 3
- 40 to 44 minutes: 4
- 45 to 59 minutes: 4
- 60 to 89 minutes: 10
- 90 or more minutes: 18
Means of transportation to work:
- Drove a car alone: 212 (78.2%)
- Carpooled: 39 (14.4%)
- Walked: 4 (1.5%)
- Worked at home: 16 (5.9%)


- Year of entry for the foreign-born population in Lyman, New Hampshire
- 21995 to March 2000
- 21990 to 1994
- 01985 to 1989
- 31980 to 1984
- 01975 to 1979
- 01970 to 1974
- 01965 to 1969
- 4Before 1965

First ancestries reported:
- English: 92 (18.5%)
- Irish: 77 (15.5%)
- French: 67 (13.5%)
- Other: 53 (10.7%)
- French Canadian: 37 (7.5%)
- German: 35 (7.1%)
- United States: 35 (7.1%)
- Scottish: 19 (3.8%)
- Italian: 18 (3.6%)
- Scotch-Irish: 15 (3.0%)
- Polish: 11 (2.2%)
- Portuguese: 7 (1.4%)
- Danish: 6 (1.2%)
- Norwegian: 6 (1.2%)
- Russian: 4 (0.8%)
- Dutch: 3 (0.6%)
- Arab: 2 (0.4%)
- Hungarian: 2 (0.4%)
- Lithuanian: 2 (0.4%)
- Swedish: 2 (0.4%)
- West Indian: 2 (0.4%)
- Czech: 1 (0.2%)
Most common places of birth for foreign-born residents (%):
| Lyman: | 45.5% (5) |
| New Hampshire: | 8.1% (4,396) |
| Lyman: | 18.2% (2) |
| New Hampshire: | 0.6% (307) |
| Lyman: | 18.2% (2) |
| New Hampshire: | 0.8% (414) |
| Lyman: | 18.2% (2) |
| New Hampshire: | 22.9% (12,397) |
Place of birth for U.S.-born residents:
- This state: 232
- Other state: 237
- Northeast: 212
- Midwest: 12
- South: 7
- West: 6
67% of Lyman residents lived in the same house 5 years ago.
Out of people who lived in different houses, 47% lived in this county.
Out of people who lived in different counties, 28% lived in New Hampshire.
Education attainment for males 25 years and older:
- No schooling: 0
- Nursery to 4th grade: 0
- 5th and 6th grade: 0
- 7th and 8th grade: 13
- 9th grade: 0
- 10th grade: 6
- 11th grade: 8
- 12th grade, no diploma: 6
- High school graduate (or equivalency): 66
- Less than 1 year of college: 6
- Some college more than 1 year, no degree: 31
- Associate degree: 9
- Bachelor's degree: 28
- Master's degree: 2
- Professional school degree: 2
- Doctorate degree: 4

Education attainment for females 25 years and older:
- No schooling: 2
- Nursery to 4th grade: 0
- 5th and 6th grade: 0
- 7th and 8th grade: 6
- 9th grade: 0
- 10th grade: 6
- 11th grade: 4
- 12th grade, no diploma: 5
- High school graduate (or equivalency): 56
- Less than 1 year of college: 15
- Some college more than 1 year, no degree: 19
- Associate degree: 16
- Bachelor's degree: 39
- Master's degree: 4
- Professional school degree: 4
- Doctorate degree: 5


Housing units in structures:
- One, detached: 238
- One, attached: 2
- Mobile homes: 29
- Boats, RVs, vans, etc.: 3
Median worth of mobile homes: $165,810
Housing units lacking complete kitchen facilities: 1.1%

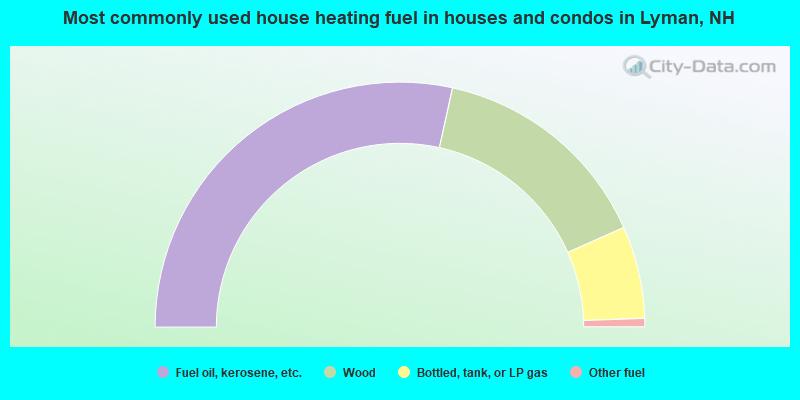
- 56.9%Fuel oil, kerosene, etc.
- 29.8%Wood
- 12.2%Bottled, tank, or LP gas
- 1.1%Other fuel
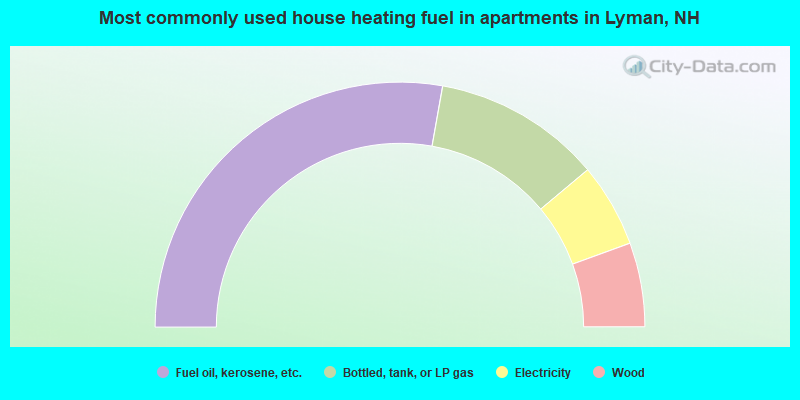
- 55.6%Fuel oil, kerosene, etc.
- 22.2%Bottled, tank, or LP gas
- 11.1%Electricity
- 11.1%Wood
Private vs. public school enrollment:
| Here: | 0.0% |
| New Hampshire: | 8.9% |
| Here: | 10.0% |
| New Hampshire: | 10.7% |
| Here: | 0.0% |
| New Hampshire: | 36.4% |


