Lyndonville, NY (New York) Houses and Residents
| Lyndonville: | $109,560 |
| New York: | $400,400 |
Mean price in 2022:
Detached houses: $134,744
Here: $134,744 State: $476,719 In 2-unit structures: $211,553
Here: $211,553 State: $713,077
Total population: 812 (Urban population: 0, Rural population: 861 (all nonfarm))
Houses: 402 (356 occupied: 264 owner occupied, 96 renter occupied)
| % of renters here: | 27% |
| State: | 46% |
Housing density: 393 houses/condos per square mile
Median price asked for vacant for-sale houses and condos in 2022 in this county: $217,580.
Median contract rent in 2022: $588 (lower quartile is $513, upper quartile is $668)
Median rent asked for vacant for-rent units in 2022: $280
Median gross rent in Lyndonville, NY in 2022: $741
Housing units in Lyndonville with a mortgage: 180 (9 second mortgage, 0 home equity loan, 9 both second mortgage and home equity loan)
Houses without a mortgage: 18
Median household income for houses/condos with a mortgage: $97,360
Median household income for apartments without a mortgage: $43,531
Median monthly housing costs: $901
Compare current foreclosures near Lyndonville, NY:
| Photo | Address | Area | Beds / Baths | Price | Details |
|---|---|---|---|---|---|

|
#1
S Main St
Lyndonville, NY 14098
|
1,966 sq. feet
|
2 baths 3 beds |
show details | |

|
#2
Eagle St
Lyndonville, NY 14098
|
992 sq. feet
|
1 baths 3 beds |
show details | |

|
#3
Millers Rd
Lyndonville, NY 14098
|
1,008 sq. feet
|
1 baths 3 beds |
show details | |

|
#4
E Yates Center Rd
Lyndonville, NY 14098
|
- sq. feet
|
- baths - beds |
show details | |

|
#5
W State St
Albion, NY 14411
|
2,701 sq. feet
|
2 baths 3 beds |
show details | |

|
#6
Ridge Rd
Gasport, NY 14067
|
2,152 sq. feet
|
1 baths 2 beds |
show details | |

|
#7
Mcclelland St
Albion, NY 14411
|
1,169 sq. feet
|
1 baths 3 beds |
show details | |

|
#8
Ingersoll St
Albion, NY 14411
|
1,536 sq. feet
|
1 baths 3 beds |
show details | |

|
#9
E County House Rd
Albion, NY 14411
|
1,952 sq. feet
|
1 baths 4 beds |
show details | |

|
#10
Lydun Dr
Albion, NY 14411
|
1,296 sq. feet
|
1 baths 4 beds |
show details |
| Photo | Address | Area | Beds / Baths | Price | Details |
|---|---|---|---|---|---|

|
#11
Bishop Rd
Appleton, NY 14008
|
1,248 sq. feet
|
1 baths 3 beds |
show details | |

|
#12
E State St
Albion, NY 14411
|
2,080 sq. feet
|
2 baths 4 beds |
show details | |

|
#13
Moore St
Albion, NY 14411
|
1,597 sq. feet
|
1 baths 3 beds |
show details | |

|
#14
Ridge Rd
Gasport, NY 14067
|
1,260 sq. feet
|
2 baths 3 beds |
show details | |

|
#15
Lakeshore Rd
Kent, NY 14477
|
2,260 sq. feet
|
2 baths 3 beds |
show details | |

|
#16
Orangeport Rd
Gasport, NY 14067
|
1,152 sq. feet
|
1 baths 3 beds |
show details | |

|
#17
Ridge Rd W
Albion, NY 14411
|
2,364 sq. feet
|
2 baths 4 beds |
show details | |

|
#18
Charlotteville Rd
Newfane, NY 14108
|
2,352 sq. feet
|
3 baths 4 beds |
show details | |

|
#19
Mill Rd
Gasport, NY 14067
|
2,208 sq. feet
|
4 baths 6 beds |
show details | |

|
#20
W Academy St
Albion, NY 14411
|
1,749 sq. feet
|
2 baths 3 beds |
show details |
| Photo | Address | Area | Beds / Baths | Price | Details |
|---|---|---|---|---|---|

|
#21
E Lee Rd
Albion, NY 14411
|
1,024 sq. feet
|
1 baths 1 beds |
show details | |

|
#22
Hatter Rd
Newfane, NY 14108
|
1,070 sq. feet
|
1 baths 3 beds |
show details | |

|
#23
Dale Rd
Newfane, NY 14108
|
1,490 sq. feet
|
2 baths 3 beds |
show details | |

|
#24
Royalton Center Rd
Gasport, NY 14067
|
1,352 sq. feet
|
2 baths 4 beds |
show details | |

|
#25
Fuller Rd
Burt, NY 14028
|
1,300 sq. feet
|
2 baths 3 beds |
show details | |

|
#26
Mann Rd
Akron, NY 14001
|
1,260 sq. feet
|
1 baths 3 beds |
show details | |

|
#27
Rounds Rd
Newfane, NY 14108
|
1,248 sq. feet
|
2 baths 3 beds |
show details | |

|
#28
W Kendall Rd
Kendall, NY 14476
|
2,516 sq. feet
|
2 baths 3 beds |
show details | |

|
#29
Ridge Rd
Holley, NY 14470
|
1,008 sq. feet
|
1 baths 3 beds |
show details | |

|
#30
Fisk Rd
Akron, NY 14001
|
1,408 sq. feet
|
1 baths 3 beds |
show details |
| Photo | Address | Area | Beds / Baths | Price | Details |
|---|---|---|---|---|---|

|
#31
Lockport Olcott Rd
Lockport, NY 14094
|
2,650 sq. feet
|
3 baths 5 beds |
show details | |

|
#32
Michelle Dr
Lockport, NY 14094
|
1,706 sq. feet
|
2 baths 3 beds |
show details | |

|
#33
Franklin St
Burt, NY 14028
|
592 sq. feet
|
1 baths 3 beds |
show details | |

|
#34
W Academy St
Albion, NY 14411
|
1,404 sq. feet
|
2 baths 3 beds |
show details | |

|
#35
W County House Rd
Albion, NY 14411
|
980 sq. feet
|
1 baths 2 beds |
show details | |

|
#36
Day Rd
Lockport, NY 14094
|
2,916 sq. feet
|
3 baths 4 beds |
show details | |

|
#37
Johnson Creek Rd
Middleport, NY 14105
|
1,696 sq. feet
|
1 baths 4 beds |
show details | |

|
#38
Townline Rd
Medina, NY 14103
|
1,444 sq. feet
|
1 baths 4 beds |
show details | |

|
#39
Seaman Rd
Middleport, NY 14105
|
1,632 sq. feet
|
2 baths 3 beds |
show details | |

|
#40
Roosevelt Hwy
Waterport, NY 14571
|
1,822 sq. feet
|
1 baths 4 beds |
show details |
| Photo | Address | Area | Beds / Baths | Price | Details |
|---|---|---|---|---|---|

|
#41
Roseland Ave
Medina, NY 14103
|
1,572 sq. feet
|
1 baths 3 beds |
show details | |

|
#42
Lake Rd
Barker, NY 14012
|
1,392 sq. feet
|
1 baths 3 beds |
show details | |

|
#43
Orient St
Medina, NY 14103
|
1,440 sq. feet
|
2 baths 3 beds |
show details | |

|
#44
Carmen Rd
Middleport, NY 14105
|
1,560 sq. feet
|
1 baths 2 beds |
show details | |

|
#45
Oak Orchard Rd
Albion, NY 14411
|
3,614 sq. feet
|
1 baths 3 beds |
show details | |

|
#46
W Oak Orchard St
Medina, NY 14103
|
2,920 sq. feet
|
2 baths 6 beds |
show details | |

|
#47
William St
Medina, NY 14103
|
1,132 sq. feet
|
1 baths 2 beds |
show details | |

|
#48
North Ave
Medina, NY 14103
|
1,546 sq. feet
|
1 baths 4 beds |
show details | |

|
#49
Mill Rd
Gasport, NY 14067
|
1,536 sq. feet
|
1 baths 2 beds |
show details | |

|
Check over 1 million property listings on Foreclosure.com!
|
browse all offers | |||

Latest news about housing in Lyndonville, NY collected exclusively by city-data.com from local newspapers, TV, and radio stations


Median year apartment built: 1941
Household type by relationship:
Households: 815- Male householders: 167 (44 living alone), Female householders: 180 (56 living alone)
147 spouses (147 opposite-sex spouses), 32 unmarried partners, (29 opposite-sex unmarried partners), 240 children (219 natural, 14 adopted, 5 stepchildren), 17 grandchildren, 2 brothers or sisters, 8 parents, 0 foster children, 0 other relatives, 18 non-relatives
Size of family households: 93 2-persons, 73 3-persons, 42 4-persons, 20 5-persons, 1 6-persons, 3 7-or-more-persons.
Size of nonfamily households: 107 1-person, 16 2-persons.
104 married couples with children.
65 single-parent households (37 men, 28 women).
95.7% of residents of Lyndonville speak English at home.
3.3% of residents speak Spanish at home (84% speak English very well, 16% speak English well).
0.3% of residents speak other Indo-European language at home (100% speak English very well).
Foreign born population: 24 (2.9%)
(91.7% of them are naturalized citizens)
| Here: | 7.2 |
| State: | 6.3 |
| Here: | 4.7 |
| State: | 3.8 |

- Bedrooms in owner-occupied houses and condos in Lyndonville, New York
- 0no bedroom
- 01 bedroom
- 312 bedrooms
- 1233 bedrooms
- 1024 bedrooms
- 95+ bedrooms

- Bedrooms in renter-occupied apartments in Lyndonville, New York
- 2no bedroom
- 341 bedroom
- 342 bedrooms
- 93 bedrooms
- 144 bedrooms
- 35+ bedrooms

- Cars and other vehicles available in Lyndonville in owner-occupied houses/condos
- 2no vehicle
- 631 vehicle
- 1312 vehicles
- 623 vehicles
- 54 vehicles
- 15+ vehicles

- Cars and other vehicles available in Lyndonville in renter-occupied apartments
- 20no vehicle
- 481 vehicle
- 282 vehicles
- 03 vehicles
- 04 vehicles
- 05+ vehicles

- Rooms in owner-occupied houses in Lyndonville, New York
- 01 room
- 02 rooms
- 03 rooms
- 144 rooms
- 245 rooms
- 636 rooms
- 387 rooms
- 738 rooms
- 539+ rooms

- Rooms in renter-occupied apartments in Lyndonville, New York
- 21 room
- 22 rooms
- 253 rooms
- 164 rooms
- 205 rooms
- 76 rooms
- 77 rooms
- 108 rooms
- 69+ rooms


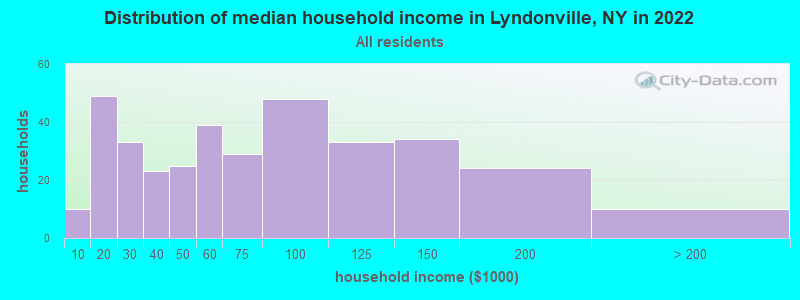
Lyndonville, NY household income distribution

- 10Less than $10,000
- 49$10,000 to $19,999
- 33$20,000 to $29,999
- 23$30,000 to $39,999
- 25$40,000 to $49,999
- 39$50,000 to $59,999
- 29$60,000 to $74,999
- 48$75,000 to $99,999
- 33$100,000 to $124,999
- 34$125,000 to $149,999
- 24$150,000 to $199,999
- 10$200,000 or more
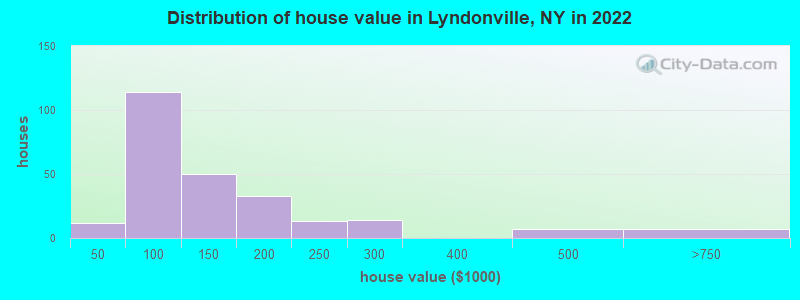
Home value of owner - occupied houses in 2022 in Lyndonville, NY
-
- 2$15,000 to $19,999
- 9$40,000 to $49,999
- 17$50,000 to $59,999
- 14$60,000 to $69,999
- 28$70,000 to $79,999
- 18$80,000 to $89,999
- 25$90,000 to $99,999
- 20$100,000 to $124,999
- 29$125,000 to $149,999
- 21$150,000 to $174,999
- 10$175,000 to $199,999
- 13$200,000 to $249,999
- 14$250,000 to $299,999
- 6$400,000 to $499,999
- 6$500,000 to $749,999
Rent paid by renters in 2022 in Lyndonville, NY
-
- 5$200 to $249
- 2$250 to $299
- 2$400 to $449
- 5$450 to $499
- 8$500 to $549
- 14$550 to $599
- 3$600 to $649
- 32$650 to $699
- 6$700 to $749
- 13No cash rent

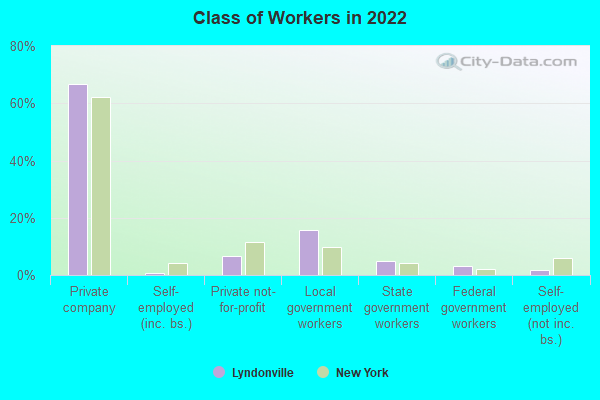
Percentage of workers working in this county: 68.6%
Number of people working at home: 21 (5.5% of all workers)
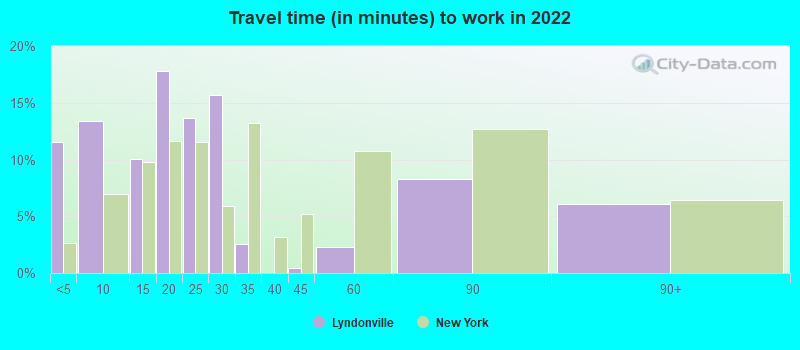
Travel time to work (commute)
- Less than 5 minutes: 32
- 5 to 9 minutes: 36
- 10 to 14 minutes: 18
- 15 to 19 minutes: 79
- 20 to 24 minutes: 42
- 25 to 29 minutes: 37
- 30 to 34 minutes: 26
- 35 to 39 minutes: 6
- 40 to 44 minutes: 1
- 45 to 59 minutes: 43
- 60 to 89 minutes: 29
- 90 or more minutes: 0
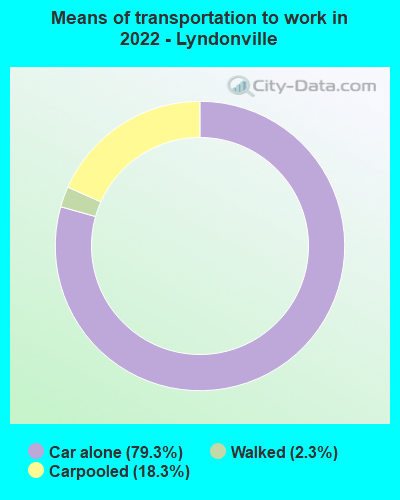
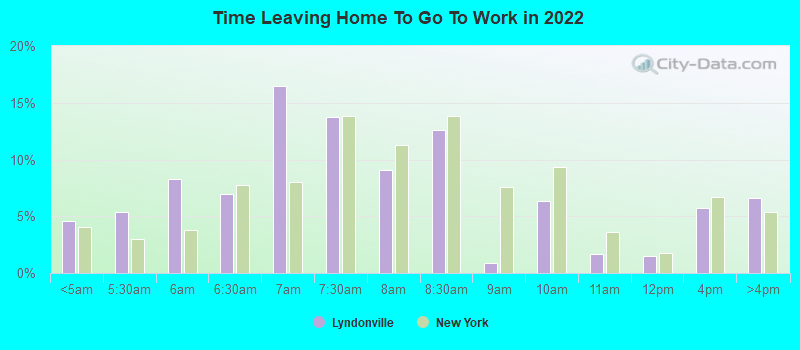
Means of transportation to work:
- Drove a car alone: 526 (75.4%)
- Carpooled: 129 (18.5%)
- Walked: 15 (2.1%)
- Worked at home: 21 (3.0%)
- Unemployment by race in 2022
- Unemployment rate for White non-Hispanic residents
- 7.7%Males
- 4.5%Females

- Year of entry for the foreign-born population in Lyndonville, New York
- 02010 or later
- 02000 to 2009
- 01990 to 1999
- 31980 to 1989
- 01970 to 1979
- 5Before 1970
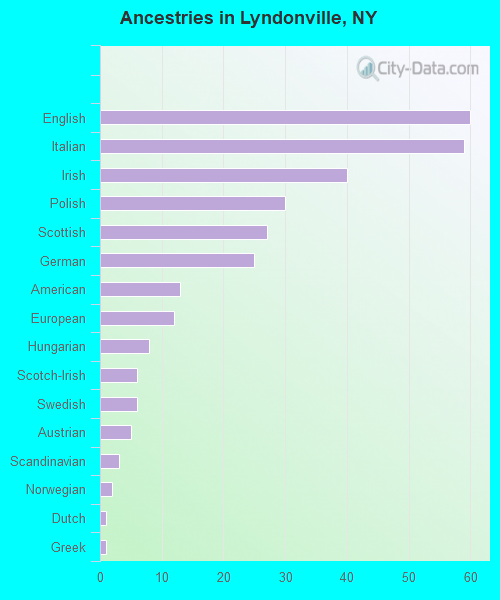
First ancestries reported:
- English: 60 (17.8%)
- Italian: 59 (17.5%)
- Irish: 40 (11.8%)
- Polish: 30 (8.9%)
- Scottish: 27 (8.0%)
- German: 25 (7.4%)
- American: 13 (3.8%)
- European: 12 (3.6%)
- Hungarian: 8 (2.4%)
- Scotch-Irish: 6 (1.8%)
- Swedish: 6 (1.8%)
- Austrian: 5 (1.5%)
- Scandinavian: 3 (0.9%)
- Norwegian: 2 (0.6%)
- Dutch: 1 (0.3%)
- Greek: 1 (0.3%)
Most common places of birth for foreign-born residents (%):
| Lyndonville: | 75.0% (18) |
| New York: | 0.2% (9,534) |
| Lyndonville: | 16.7% (4) |
| New York: | 0.1% (2,334) |
Place of birth for U.S.-born residents:
- This state: 677
- Other state: 101
- Northeast: 19
- Midwest: 26
- South: 43
- West: 11
84.0% of Lyndonville residents lived in the same house 1 years ago.
Out of people who lived in different houses, 29.3% lived in this county.
Out of people who lived in different counties, 67.6% lived in New York.
| Lyndonville: | 84.0% |
| State average: | 89.6% |
Education attainment for males 25 years and older:
- No schooling: 0
- Nursery to 4th grade: 0
- 5th and 6th grade: 0
- 7th and 8th grade: 1
- 9th grade: 13
- 10th grade: 0
- 11th grade: 0
- 12th grade, no diploma: 3
- High school graduate (or equivalency): 84
- Less than 1 year of college: 30
- Some college more than 1 year, no degree: 43
- Associate degree: 35
- Bachelor's degree: 36
- Master's degree: 12
- Professional school degree: 2
- Doctorate degree: 7

Education attainment for females 25 years and older:
- No schooling: 0
- Nursery to 4th grade: 1
- 5th and 6th grade: 0
- 7th and 8th grade: 3
- 9th grade: 0
- 10th grade: 1
- 11th grade: 1
- 12th grade, no diploma: 0
- High school graduate (or equivalency): 105
- Less than 1 year of college: 16
- Some college more than 1 year, no degree: 49
- Associate degree: 31
- Bachelor's degree: 53
- Master's degree: 10
- Professional school degree: 2
- Doctorate degree: 0


Housing units in structures:
- One, detached: 296
- One, attached: 9
- Two: 45
- 3 or 4: 7
- 5 to 9: 27
- 10 to 19: 7
- 50 or more: 10
Housing units lacking complete kitchen facilities in 2022: 3.8%
House/condo owner moved in on average 13 years ago
Renter moved in on average 3 years ago

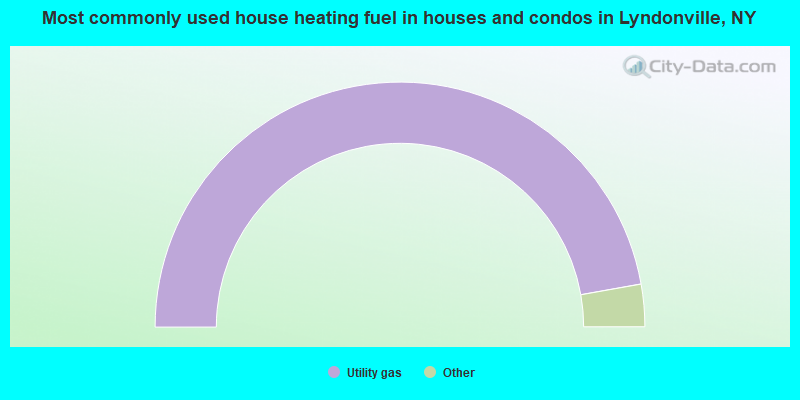
- 94.6%Utility gas
- 2.7%Fuel oil, kerosene, etc.
- 2.7%Wood
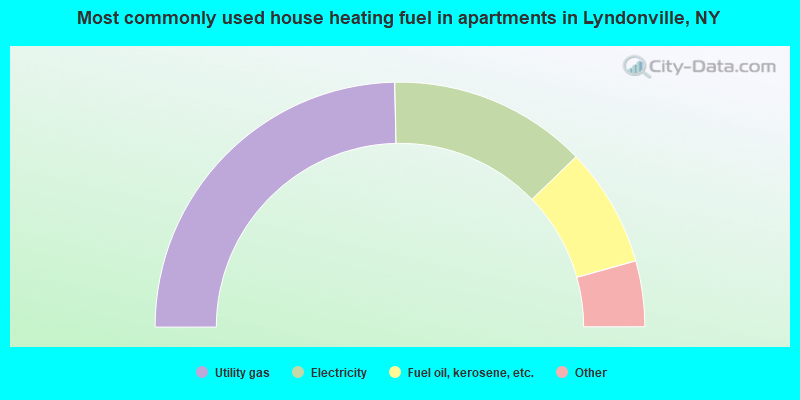
- 50.0%Utility gas
- 26.6%Electricity
- 16.0%Fuel oil, kerosene, etc.
- 3.2%Other fuel
- 2.1%Bottled, tank, or LP gas
- 2.1%Wood
Private vs. public school enrollment:
| Here: | 8.6% |
| New York: | 15.6% |
| Here: | 6.5% |
| New York: | 15.0% |
| Here: | 0.0% |
| New York: | 39.2% |


