Magnolia, DE (Delaware) Houses and Residents
| Magnolia: | $207,399 |
| Delaware: | $337,200 |
Mean price in 2022:
Detached houses: $186,021
Here: $186,021 State: $419,599
Total population: 233 (All urban)
Houses: 115 (98 occupied: 74 owner occupied, 25 renter occupied)
| % of renters here: | 25% |
| State: | 26% |
Housing density: 600 houses/condos per square mile
Median price asked for vacant for-sale houses and condos in 2022: $198,460.
Median contract rent in 2022: $969
Median gross rent in Magnolia, DE in 2022: $1,373
Housing units in Magnolia with a mortgage: 66 (0 second mortgage, 0 home equity loan, 0 both second mortgage and home equity loan)
Houses without a mortgage: 0
Median household income for houses/condos with a mortgage: $114,111
Median monthly housing costs: $1,325
Compare current foreclosures near Magnolia, DE:
| Photo | Address | Area | Beds / Baths | Price | Details |
|---|---|---|---|---|---|

|
#1
Winners Cir
Magnolia, DE 19962
|
2,552 sq. feet
|
2 baths 4 beds |
show details | |

|
#2
Olde Field Dr
Magnolia, DE 19962
|
- sq. feet
|
- baths - beds |
show details | |

|
#3
Phillips Dr
Magnolia, DE 19962
|
- sq. feet
|
- baths - beds |
show details | |

|
#4
Vollkorn Rd
Magnolia, DE 19962
|
- sq. feet
|
- baths - beds |
show details | |

|
#5
Foxtail Ln
Magnolia, DE 19962
|
- sq. feet
|
- baths - beds |
show details | |

|
#6
S Main St # 2
Magnolia, DE 19962
|
- sq. feet
|
- baths - beds |
show details | |

|
#7
Cilento Dr
Magnolia, DE 19962
|
- sq. feet
|
- baths - beds |
show details | |

|
#8
Chestnut Ridge Dr
Magnolia, DE 19962
|
- sq. feet
|
- baths - beds |
show details | |

|
#9
Medal Way
Magnolia, DE 19962
|
- sq. feet
|
- baths - beds |
show details | |

|
#10
Fox Run Dr
Magnolia, DE 19962
|
- sq. feet
|
- baths - beds |
show details |
| Photo | Address | Area | Beds / Baths | Price | Details |
|---|---|---|---|---|---|

|
#11
Vollkorn Rd
Magnolia, DE 19962
|
- sq. feet
|
- baths - beds |
show details | |

|
#12
Cherry Dr
Magnolia, DE 19962
|
- sq. feet
|
- baths - beds |
show details | |

|
#13
Deerberry Dr
Magnolia, DE 19962
|
- sq. feet
|
- baths - beds |
show details | |

|
#14
Abbotts Pond Rd
Milford, DE 19963
|
1,920 sq. feet
|
2 baths 4 beds |
$149,900
|
show details |

|
#15
Milford Harrington H
Milford, DE 19963
|
1,348 sq. feet
|
1 baths 3 beds |
$210,000
|
show details |

|
#16
Applecross Ln
Magnolia, DE 19962
|
- sq. feet
|
- baths - beds |
show details | |

|
#17
Quaker Hill Rd
Magnolia, DE 19962
|
- sq. feet
|
- baths - beds |
show details | |

|
#18
Misty Ridge Dr
Magnolia, DE 19962
|
- sq. feet
|
- baths - beds |
show details | |

|
#19
Shadywood Ln
Magnolia, DE 19962
|
- sq. feet
|
- baths - beds |
show details | |

|
#20
Henry Dr
Magnolia, DE 19962
|
- sq. feet
|
- baths - beds |
show details |
| Photo | Address | Area | Beds / Baths | Price | Details |
|---|---|---|---|---|---|

|
#21
Wildflower Cir E
Magnolia, DE 19962
|
- sq. feet
|
- baths - beds |
show details | |

|
#22
Petition Ln
Magnolia, DE 19962
|
- sq. feet
|
- baths - beds |
show details | |

|
#23
Dogwood Dr
Magnolia, DE 19962
|
- sq. feet
|
- baths - beds |
show details | |

|
#24
Bay Hill Ln
Magnolia, DE 19962
|
- sq. feet
|
- baths - beds |
show details | |

|
#25
Douglas Fir Rd
Magnolia, DE 19962
|
- sq. feet
|
- baths - beds |
show details | |

|
#26
Kenton Rd
Dover, DE 19904
|
928 sq. feet
|
1 baths 2 beds |
show details | |

|
#27
Forrest Ave
Dover, DE 19904
|
1,176 sq. feet
|
1 baths 3 beds |
show details | |

|
#28
Bryn Zion Rd
Smyrna, DE 19977
|
3,228 sq. feet
|
4 baths 3 beds |
show details | |

|
#29
New Castle Ave
Felton, DE 19943
|
920 sq. feet
|
1 baths 3 beds |
show details | |

|
#30
Main St
Dover, DE 19901
|
- sq. feet
|
1 baths 2 beds |
show details |
| Photo | Address | Area | Beds / Baths | Price | Details |
|---|---|---|---|---|---|

|
#31
Marvel Road
Marydel, MD 21649
|
2,475 sq. feet
|
2 baths 4 beds |
show details | |

|
#32
Greenbriar Rd
Hartly, DE 19953
|
1,464 sq. feet
|
1 baths 3 beds |
show details | |

|
#33
Alonzo Dr
Dover, DE 19904
|
1,578 sq. feet
|
1 baths 3 beds |
show details | |

|
#34
Seacroft Dr
Dover, DE 19904
|
1,519 sq. feet
|
2 baths 3 beds |
show details | |

|
#35
John Clark Rd
Dover, DE 19904
|
1,080 sq. feet
|
1 baths 3 beds |
show details | |

|
#36
Bluecoat St
Dover, DE 19901
|
1,932 sq. feet
|
2 baths 4 beds |
show details | |

|
#37
Apoorva Ln
Smyrna, DE 19977
|
3,300 sq. feet
|
2 baths 4 beds |
show details | |

|
#38
Joshua Clayton Rd
Dover, DE 19904
|
1,232 sq. feet
|
1 baths 4 beds |
show details | |

|
#39
Nimitz Rd
Dover, DE 19901
|
1,777 sq. feet
|
1 baths 4 beds |
show details | |

|
#40
Garfield Dr
Dover, DE 19901
|
1,810 sq. feet
|
1 baths 4 beds |
show details |
| Photo | Address | Area | Beds / Baths | Price | Details |
|---|---|---|---|---|---|

|
#41
Red Maple Rd
Smyrna, DE 19977
|
2,557 sq. feet
|
1 baths 3 beds |
show details | |

|
#42
Heritage Dr
Dover, DE 19904
|
1,980 sq. feet
|
2 baths 3 beds |
show details | |

|
#43
Midessa Ct
Dover, DE 19904
|
2,404 sq. feet
|
2 baths 3 beds |
show details | |

|
#44
Cannon Mill Dr
Dover, DE 19904
|
1,619 sq. feet
|
2 baths 4 beds |
show details | |

|
#45
N West St
Dover, DE 19904
|
1,543 sq. feet
|
2 baths 2 beds |
show details | |

|
#46
Garrisons Lake Blvd
Smyrna, DE 19977
|
1,722 sq. feet
|
2 baths 3 beds |
show details | |

|
#47
N West St
Dover, DE 19904
|
1,148 sq. feet
|
1 baths 3 beds |
show details | |

|
#48
Acorn Ln
Dover, DE 19901
|
1,170 sq. feet
|
2 baths 3 beds |
show details | |

|
#49
Mahogany Pl
Dover, DE 19901
|
1,587 sq. feet
|
2 baths 3 beds |
show details | |

|
Check over 1 million property listings on Foreclosure.com!
|
browse all offers | |||

Latest news about housing in Magnolia, DE collected exclusively by city-data.com from local newspapers, TV, and radio stations

 | Linkside Townhomes in Magnolia, DE (0 replies) |
| If I work in Dover, where is the nicest newest apartments or townhome to live in? (2 replies) |
| magnolia Linkside Town Homes Opinion (2 replies) |
| Connecting to county water in Magnolia (0 replies) |
| Town houses in Sussex county? (2 replies) |
| What can you tell me about.... (9 replies) |

Median year apartment built: 1945
Household type by relationship:
Households: 269- Male householders: 54 (18 living alone), Female householders: 42 (1 living alone)
39 spouses (39 opposite-sex spouses), 9 unmarried partners, (9 opposite-sex unmarried partners), 70 children (66 natural, 4 adopted, 0 stepchildren), 27 grandchildren, 3 brothers or sisters, 4 parents, 7 foster children, 5 other relatives, 6 non-relatives
Size of family households: 44 2-persons, 2 3-persons, 2 4-persons, 7 6-persons, 18 7-or-more-persons.
Size of nonfamily households: 20 1-person, 5 2-persons.
2 married couples with children.
50 single-parent households (0 men, 50 women).
95.8% of residents of Magnolia speak English at home.
4.2% of residents speak Spanish at home (100% speak English very well).
| Here: | 7.9 |
| State: | 6.9 |
| Here: | 4.6 |
| State: | 4.4 |

- Bedrooms in owner-occupied houses and condos in Magnolia, Delaware
- 0no bedroom
- 01 bedroom
- 112 bedrooms
- 273 bedrooms
- 364 bedrooms
- 15+ bedrooms

- Bedrooms in renter-occupied apartments in Magnolia, Delaware
- 0no bedroom
- 91 bedroom
- 62 bedrooms
- 63 bedrooms
- 44 bedrooms
- 05+ bedrooms

- Cars and other vehicles available in Magnolia in owner-occupied houses/condos
- 0no vehicle
- 131 vehicle
- 512 vehicles
- 53 vehicles
- 24 vehicles
- 35+ vehicles

- Cars and other vehicles available in Magnolia in renter-occupied apartments
- 9no vehicle
- 71 vehicle
- 102 vehicles
- 03 vehicles
- 04 vehicles
- 05+ vehicles

- Rooms in owner-occupied houses in Magnolia, Delaware
- 01 room
- 02 rooms
- 03 rooms
- 24 rooms
- 135 rooms
- 26 rooms
- 177 rooms
- 128 rooms
- 299+ rooms

- Rooms in renter-occupied apartments in Magnolia, Delaware
- 01 room
- 12 rooms
- 03 rooms
- 134 rooms
- 55 rooms
- 16 rooms
- 07 rooms
- 18 rooms
- 49+ rooms


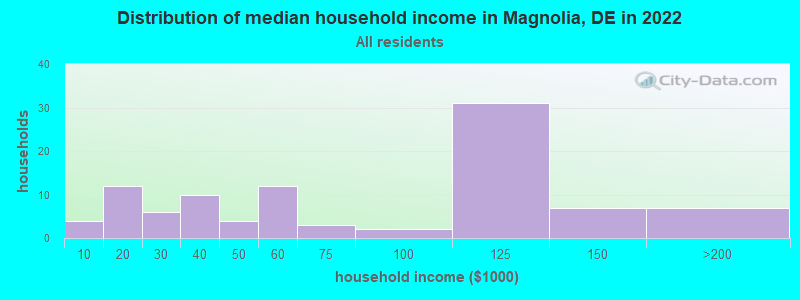
Magnolia, DE household income distribution

- 4Less than $10,000
- 12$10,000 to $19,999
- 6$20,000 to $29,999
- 10$30,000 to $39,999
- 4$40,000 to $49,999
- 12$50,000 to $59,999
- 3$60,000 to $74,999
- 2$75,000 to $99,999
- 31$100,000 to $124,999
- 7$125,000 to $149,999
- 7$150,000 to $199,999
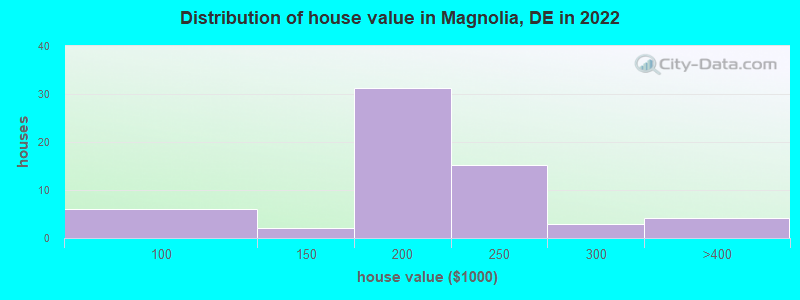
Home value of owner - occupied houses in 2022 in Magnolia, DE
-
- 6$70,000 to $79,999
- 2$125,000 to $149,999
- 16$150,000 to $174,999
- 14$175,000 to $199,999
- 15$200,000 to $249,999
- 2$250,000 to $299,999
- 4$300,000 to $399,999
Rent paid by renters in 2022 in Magnolia, DE
-
- 5$100 to $149
- 1$500 to $549
- 0$550 to $599
- 2$800 to $899
- 5$900 to $999
- 3$1,250 to $1,499
- 4$1,500 to $1,999


Percentage of workers working in this county: 89.2%
Number of people working at home: 19 (20.4% of all workers)
Travel time to work (commute)
- Less than 5 minutes: 0
- 5 to 9 minutes: 9
- 10 to 14 minutes: 4
- 15 to 19 minutes: 16
- 20 to 24 minutes: 21
- 25 to 29 minutes: 6
- 30 to 34 minutes: 1
- 35 to 39 minutes: 6
- 40 to 44 minutes: 0
- 45 to 59 minutes: 1
- 60 to 89 minutes: 3
- 90 or more minutes: 0
Means of transportation to work:
- Drove a car alone: 78 (68.4%)
- Carpooled: 4 (3.5%)
- Motorcycle: 1 (0.9%)
- Walked: 7 (6.1%)
- Worked at home: 24 (21.1%)

- Unemployment by race in 2022
- Unemployment rate for White non-Hispanic residents
- 7.3%Males
- Unemployment rate for Black residents
- 48.1%Males
- Unemployment rate for two or more race residents
- 100.0%Males

- Year of entry for the foreign-born population in Magnolia, Delaware
- 01995 to March 2000
- 01990 to 1994
- 01985 to 1989
- 01980 to 1984
- 01975 to 1979
- 01970 to 1974
- 01965 to 1969
- 4Before 1965

First ancestries reported:
- Italian: 25 (15.9%)
- Polish: 17 (10.8%)
- English: 10 (6.4%)
- Irish: 10 (6.4%)
- British: 8 (5.1%)
- German: 6 (3.8%)
- American: 5 (3.2%)
Most common places of birth for foreign-born residents (%):
| Magnolia: | 100.0% (4) |
| Delaware: | 5.6% (2,521) |
Place of birth for U.S.-born residents:
- This state: 139
- Other state: 127
- Northeast: 58
- Midwest: 14
- South: 45
- West: 4
91.8% of Magnolia residents lived in the same house 1 years ago.
Out of people who lived in different houses, 8.7% lived in this county.
Out of people who lived in different counties, 21.4% lived in Delaware.
| Magnolia: | 91.8% |
| State average: | 89.2% |
Education attainment for males 25 years and older:
- No schooling: 0
- Nursery to 4th grade: 0
- 5th and 6th grade: 0
- 7th and 8th grade: 4
- 9th grade: 0
- 10th grade: 0
- 11th grade: 1
- 12th grade, no diploma: 0
- High school graduate (or equivalency): 34
- Less than 1 year of college: 4
- Some college more than 1 year, no degree: 1
- Associate degree: 2
- Bachelor's degree: 7
- Master's degree: 25
- Professional school degree: 0
- Doctorate degree: 0

Education attainment for females 25 years and older:
- No schooling: 0
- Nursery to 4th grade: 0
- 5th and 6th grade: 0
- 7th and 8th grade: 0
- 9th grade: 0
- 10th grade: 0
- 11th grade: 0
- 12th grade, no diploma: 0
- High school graduate (or equivalency): 20
- Less than 1 year of college: 2
- Some college more than 1 year, no degree: 29
- Associate degree: 0
- Bachelor's degree: 9
- Master's degree: 10
- Professional school degree: 6
- Doctorate degree: 0


Housing units in structures:
- One, detached: 91
- One, attached: 4
- Two: 11
- 3 or 4: 8
Housing units lacking complete kitchen facilities in 2022: 3.6%
House/condo owner moved in on average 20 years ago
Renter moved in on average 1 years ago

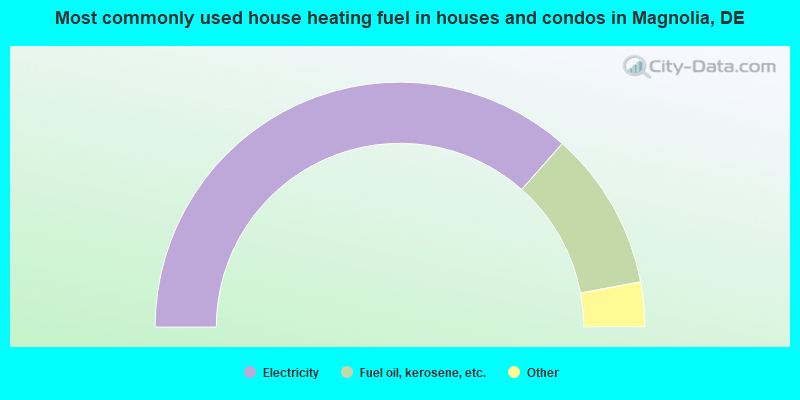
- 74.3%Electricity
- 21.4%Fuel oil, kerosene, etc.
- 2.9%Bottled, tank, or LP gas
- 1.4%Wood
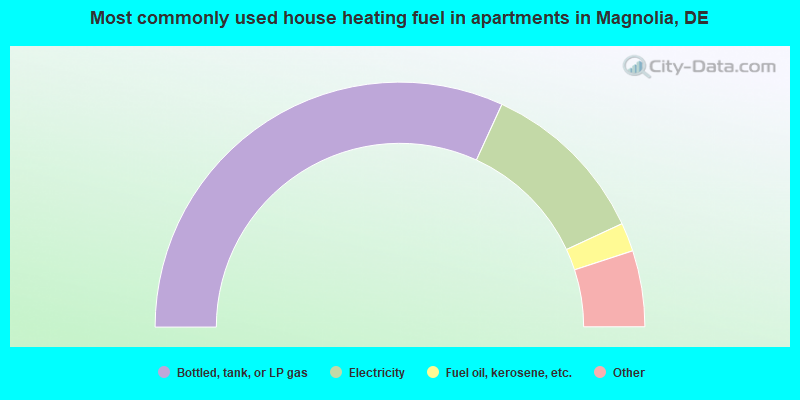
- 70.8%Bottled, tank, or LP gas
- 25.0%Electricity
- 4.2%Fuel oil, kerosene, etc.
Private vs. public school enrollment:
| Here: | 29.4% |
| Delaware: | 11.5% |
| Here: | 0.0% |
| Delaware: | 12.1% |
| Here: | 0.0% |
| Delaware: | 19.2% |


