Maple Park, IL (Illinois) Houses and Residents
| Maple Park: | $269,852 |
| Illinois: | $251,600 |
Mean price in 2022:
Detached houses: $267,482
Here: $267,482 State: $310,164 Townhouses or other attached units: $222,184
Here: $222,184 State: $286,230
Total population: 1,313 (Urban population: 0, Rural population: 765 (3 farm, 762 nonfarm))
Houses: 569 (552 occupied: 433 owner occupied, 119 renter occupied)
| % of renters here: | 22% |
| State: | 33% |
Housing density: 958 houses/condos per square mile
Median price asked for vacant for-sale houses and condos in 2022 in this county: $350,134.
Median contract rent in 2022: $1,337 (lower quartile is $1,217, upper quartile is $1,443)
Median gross rent in Maple Park, IL in 2022: $1,515
Housing units in Maple Park with a mortgage: 312 (27 second mortgage, 0 home equity loan, 30 both second mortgage and home equity loan)
Houses without a mortgage: 0
Median household income for houses/condos with a mortgage: $119,856
Median household income for apartments without a mortgage: $94,098
Median monthly housing costs: $1,534
Compare current foreclosures near Maple Park, IL:
| Photo | Address | Area | Beds / Baths | Price | Details |
|---|---|---|---|---|---|

|
#1
Country Life Dr
Maple Park, IL 60151
|
- sq. feet
|
- baths - beds |
show details | |

|
#2
S Inverness St
Maple Park, IL 60151
|
- sq. feet
|
- baths - beds |
show details | |

|
#3
Settlement Dr
Maple Park, IL 60151
|
- sq. feet
|
- baths - beds |
show details | |

|
#4
Leonard Ave
Dekalb, IL 60115
|
1,295 sq. feet
|
2 baths 3 beds |
$245,000
|
show details |

|
#5
Corron Rd
Elgin, IL 60124
|
3,352 sq. feet
|
3 baths 4 beds |
$685,000
|
show details |

|
#6
W809 Bending Ln
Elgin, IL 60124
|
4,100 sq. feet
|
3 baths 4 beds |
$589,900
|
show details |

|
#7
Kathleen Cir
Montgomery, IL 60538
|
920 sq. feet
|
1 baths 2 beds |
$285,000
|
show details |

|
#8
S Elizabeth St
Maple Park, IL 60151
|
- sq. feet
|
- baths - beds |
show details | |

|
#9
Farrier Point Lane
Saint Charles, IL 60175
|
- sq. feet
|
3 baths 5 beds |
$561,600
|
show details |

|
#10
Cottonwood Dr
Elgin, IL 60123
|
1,751 sq. feet
|
3 baths 3 beds |
show details |
| Photo | Address | Area | Beds / Baths | Price | Details |
|---|---|---|---|---|---|

|
#11
Crystal Ave
South Elgin, IL 60177
|
720 sq. feet
|
1 baths 2 beds |
show details | |

|
#12
Monroe St
Genoa, IL 60135
|
1,412 sq. feet
|
2 baths 3 beds |
show details | |

|
#13
S Peace Rd
Sycamore, IL 60178
|
763 sq. feet
|
1 baths 2 beds |
show details | |

|
#14
N May St
Aurora, IL 60506
|
822 sq. feet
|
1 baths 2 beds |
show details | |

|
#15
Pine St
Sugar Grove, IL 60554
|
2,840 sq. feet
|
4 baths 4 beds |
show details | |

|
#16
N Shady Ln.
Elgin, IL 60124
|
2,544 sq. feet
|
2 baths 3 beds |
show details | |

|
#17
Blume Dr
Elgin, IL 60124
|
3,373 sq. feet
|
3 baths 5 beds |
show details | |

|
#18
Laurel Dr
Aurora, IL 60506
|
1,600 sq. feet
|
2 baths 4 beds |
show details | |

|
#19
Foran Ln
Aurora, IL 60506
|
864 sq. feet
|
1 baths 3 beds |
show details | |

|
#20
E State St
North Aurora, IL 60542
|
2,070 sq. feet
|
1 baths 5 beds |
show details |
| Photo | Address | Area | Beds / Baths | Price | Details |
|---|---|---|---|---|---|

|
#21
Collins Dr
Elburn, IL 60119
|
2,669 sq. feet
|
2 baths 4 beds |
show details | |

|
#22
Big Rock Ave
Plano, IL 60545
|
2,021 sq. feet
|
2 baths 3 beds |
show details | |

|
#23
Kate Dr
Montgomery, IL 60538
|
2,667 sq. feet
|
3 baths 4 beds |
show details | |

|
#24
Willoughby Ct Unit D
Yorkville, IL 60560
|
1,590 sq. feet
|
2 baths 3 beds |
show details | |

|
#25
Meadow View Dr
Saint Charles, IL 60175
|
3,560 sq. feet
|
2 baths 4 beds |
show details | |

|
#26
Candlelight Cir
Montgomery, IL 60538
|
- sq. feet
|
2 baths 2 beds |
show details | |

|
#27
Easy St
Sycamore, IL 60178
|
- sq. feet
|
1 baths 4 beds |
show details | |

|
#28
Clark St
Dekalb, IL 60115
|
1,105 sq. feet
|
2 baths 2 beds |
show details | |

|
#29
Exposition Ave
Aurora, IL 60506
|
- sq. feet
|
2 baths 4 beds |
show details | |

|
#30
Tilton Park Dr
Dekalb, IL 60115
|
1,400 sq. feet
|
1 baths 3 beds |
show details |
| Photo | Address | Area | Beds / Baths | Price | Details |
|---|---|---|---|---|---|

|
#31
Ayres Dr
Aurora, IL 60506
|
- sq. feet
|
- baths - beds |
show details | |

|
#32
Briar Glen Ct
Hampshire, IL 60140
|
- sq. feet
|
- baths - beds |
show details | |

|
#33
Nicole Dr Unit E
South Elgin, IL 60177
|
- sq. feet
|
- baths - beds |
show details | |

|
#34
S Raddant Rd
Batavia, IL 60510
|
- sq. feet
|
- baths - beds |
show details | |

|
#35
W Wilson St # 588
Batavia, IL 60510
|
- sq. feet
|
- baths - beds |
show details | |

|
#36
Linn Ct Apt D
North Aurora, IL 60542
|
- sq. feet
|
- baths - beds |
show details | |

|
#37
Windsor Cir
Saint Charles, IL 60175
|
- sq. feet
|
- baths - beds |
show details | |

|
#38
Upland Rd
Hampshire, IL 60140
|
- sq. feet
|
- baths - beds |
show details | |

|
#39
S 11th Ave, Lowr Level
Saint Charles, IL 60174
|
- sq. feet
|
- baths - beds |
show details | |

|
#40
David Dr
Elgin, IL 60123
|
- sq. feet
|
- baths - beds |
show details |
| Photo | Address | Area | Beds / Baths | Price | Details |
|---|---|---|---|---|---|

|
#41
W Meadowdale Cir
Hampshire, IL 60140
|
- sq. feet
|
- baths - beds |
show details | |

|
#42
Bowes Rd
Elgin, IL 60123
|
- sq. feet
|
- baths - beds |
show details | |

|
#43
S 1st St
Geneva, IL 60134
|
- sq. feet
|
- baths - beds |
show details | |

|
#44
Windsor Ct Unit A
South Elgin, IL 60177
|
- sq. feet
|
- baths - beds |
show details | |

|
#45
Redtail Rdg Apt F
Elgin, IL 60123
|
- sq. feet
|
- baths - beds |
show details | |

|
#46
Winding Trl
Genoa, IL 60135
|
- sq. feet
|
- baths - beds |
show details | |

|
#47
Cumberland Green Dr Unit 374
Saint Charles, IL 60174
|
- sq. feet
|
- baths - beds |
show details | |

|
#48
S 10th Ave
Saint Charles, IL 60174
|
- sq. feet
|
- baths - beds |
show details | |

|
#49
Dempsey Cir
Hampshire, IL 60140
|
- sq. feet
|
- baths - beds |
show details | |

|
Check over 1 million property listings on Foreclosure.com!
|
browse all offers | |||


 | Talk to me about Aurora? (45 replies) |
| Looking for Naperville Apartment Recommendations/Reviews (5 replies) |
| Wilmette vs. Evanston - are there parts of Wilmette similar to Evanston? (64 replies) |
| NYC family of 6. Evanston, Winnetka...other places? (63 replies) |
| Pet Friendly Suburbs near the city (10 replies) |
| Potentially Moving to NIU (4 replies) |
Median year apartment built: 1972
Household type by relationship:
Households: 1,625- Male householders: 245 (39 living alone), Female householders: 298 (58 living alone)
340 spouses (334 opposite-sex spouses), 61 unmarried partners, (61 opposite-sex unmarried partners), 560 children (543 natural, 3 adopted, 12 stepchildren), 17 grandchildren, 0 brothers or sisters, 38 parents, 0 foster children, 13 other relatives, 47 non-relatives
Size of family households: 174 2-persons, 99 3-persons, 73 4-persons, 34 5-persons, 23 6-persons.
Size of nonfamily households: 99 1-person, 42 2-persons, 6 5-persons.
228 married couples with children.
97 single-parent households (8 men, 89 women).
94.2% of residents of Maple Park speak English at home.
3.5% of residents speak Spanish at home (65% speak English very well, 35% speak English well).
1.2% of residents speak other Indo-European language at home (22% speak English very well, 17% speak English well, 61% speak English not well).
0.1% of residents speak other language at home (100% speak English very well).
Foreign born population: 40 (2.5%)
(87.5% of them are naturalized citizens)
| Here: | 6.2 |
| State: | 6.4 |
| Here: | 5.1 |
| State: | 4.1 |

- Bedrooms in owner-occupied houses and condos in Maple Park, Illinois
- 0no bedroom
- 31 bedroom
- 532 bedrooms
- 2643 bedrooms
- 1084 bedrooms
- 65+ bedrooms

- Bedrooms in renter-occupied apartments in Maple Park, Illinois
- 0no bedroom
- 01 bedroom
- 652 bedrooms
- 243 bedrooms
- 304 bedrooms
- 05+ bedrooms

- Cars and other vehicles available in Maple Park in owner-occupied houses/condos
- 0no vehicle
- 931 vehicle
- 1832 vehicles
- 1263 vehicles
- 254 vehicles
- 65+ vehicles

- Cars and other vehicles available in Maple Park in renter-occupied apartments
- 0no vehicle
- 381 vehicle
- 702 vehicles
- 43 vehicles
- 74 vehicles
- 05+ vehicles

- Rooms in owner-occupied houses in Maple Park, Illinois
- 01 room
- 02 rooms
- 33 rooms
- 274 rooms
- 965 rooms
- 1166 rooms
- 607 rooms
- 748 rooms
- 589+ rooms

- Rooms in renter-occupied apartments in Maple Park, Illinois
- 01 room
- 02 rooms
- 03 rooms
- 324 rooms
- 355 rooms
- 176 rooms
- 177 rooms
- 108 rooms
- 79+ rooms


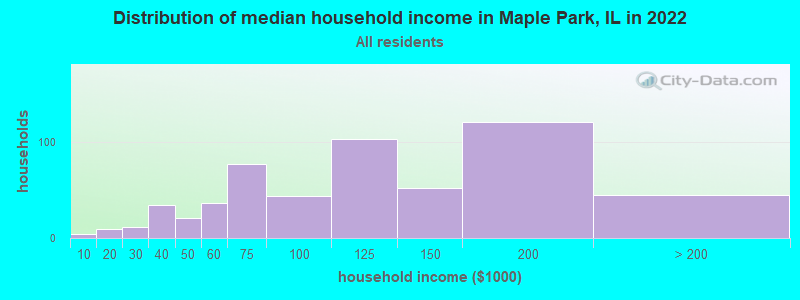
Maple Park, IL household income distribution

- 4Less than $10,000
- 9$10,000 to $19,999
- 11$20,000 to $29,999
- 34$30,000 to $39,999
- 21$40,000 to $49,999
- 36$50,000 to $59,999
- 77$60,000 to $74,999
- 44$75,000 to $99,999
- 103$100,000 to $124,999
- 52$125,000 to $149,999
- 121$150,000 to $199,999
- 45$200,000 or more
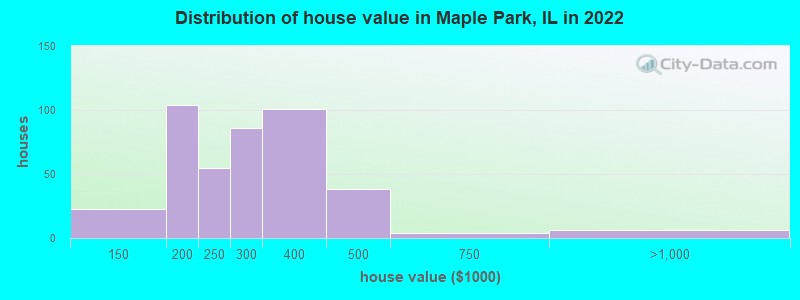
Home value of owner - occupied houses in 2022 in Maple Park, IL
-
- 19$100,000 to $124,999
- 3$125,000 to $149,999
- 52$150,000 to $174,999
- 51$175,000 to $199,999
- 54$200,000 to $249,999
- 85$250,000 to $299,999
- 100$300,000 to $399,999
- 37$400,000 to $499,999
- 3$500,000 to $749,999
- 6$750,000 to $999,999
Rent paid by renters in 2022 in Maple Park, IL
-
- 2$550 to $599
- 9$800 to $899
- 15$1,000 to $1,249
- 60$1,250 to $1,499
- 10$1,500 to $1,999
- 10$2,000 to $2,499


Percentage of workers working in this county: 36.8%
Number of people working at home: 80 (9.2% of all workers)
Travel time to work (commute)
- Less than 5 minutes: 1
- 5 to 9 minutes: 45
- 10 to 14 minutes: 85
- 15 to 19 minutes: 76
- 20 to 24 minutes: 79
- 25 to 29 minutes: 33
- 30 to 34 minutes: 216
- 35 to 39 minutes: 28
- 40 to 44 minutes: 66
- 45 to 59 minutes: 72
- 60 to 89 minutes: 77
- 90 or more minutes: 13
Means of transportation to work:
- Drove a car alone: 327 (88.1%)
- Carpooled: 19 (5.1%)
- Railroad: 3 (0.8%)
- Ferryboat: 1 (0.3%)
- Walked: 4 (1.1%)
- Worked at home: 17 (4.6%)

- Unemployment by race in 2022
- Unemployment rate for White non-Hispanic residents
- 3.7%Males
- 2.4%Females
- Unemployment rate for two or more race residents
- 2.2%Males
- Unemployment rate for Hispanic or Latino residents
- 19.6%Males

- Year of entry for the foreign-born population in Maple Park, Illinois
- 02010 or later
- 32000 to 2009
- 31990 to 1999
- 01980 to 1989
- 31970 to 1979
- 0Before 1970

First ancestries reported:
- German: 254 (37.3%)
- Eastern European: 40 (5.9%)
- American: 38 (5.6%)
- Irish: 32 (4.7%)
- Scottish: 28 (4.1%)
- Italian: 27 (4.0%)
- Polish: 26 (3.8%)
- European: 24 (3.5%)
- French: 7 (1.0%)
- Norwegian: 5 (0.7%)
- Swedish: 5 (0.7%)
- Lebanese: 3 (0.4%)
- Belgian: 2 (0.3%)
- Welsh: 2 (0.3%)
Most common places of birth for foreign-born residents (%):
| Maple Park: | 41.0% (16) |
| Illinois: | 34.7% (626,958) |
| Maple Park: | 15.4% (6) |
| Illinois: | 6.9% (124,474) |
| Maple Park: | 12.8% (5) |
| Illinois: | 1.0% (18,753) |
| Maple Park: | 7.7% (3) |
| Illinois: | 0.2% (3,080) |
| Maple Park: | 7.7% (3) |
| Illinois: | 5.2% (93,003) |
| Maple Park: | 5.1% (2) |
| Illinois: | 2.2% (40,393) |
Place of birth for U.S.-born residents:
- This state: 1,338
- Other state: 241
- Northeast: 19
- Midwest: 139
- South: 50
- West: 28
90.7% of Maple Park residents lived in the same house 1 years ago.
Out of people who lived in different houses, 30.7% lived in this county.
Out of people who lived in different counties, 92.7% lived in Illinois.
| Maple Park: | 90.7% |
| State average: | 88.3% |
Education attainment for males 25 years and older:
- No schooling: 0
- Nursery to 4th grade: 0
- 5th and 6th grade: 4
- 7th and 8th grade: 0
- 9th grade: 4
- 10th grade: 2
- 11th grade: 0
- 12th grade, no diploma: 6
- High school graduate (or equivalency): 181
- Less than 1 year of college: 45
- Some college more than 1 year, no degree: 56
- Associate degree: 84
- Bachelor's degree: 124
- Master's degree: 27
- Professional school degree: 7
- Doctorate degree: 0

Education attainment for females 25 years and older:
- No schooling: 0
- Nursery to 4th grade: 0
- 5th and 6th grade: 0
- 7th and 8th grade: 0
- 9th grade: 12
- 10th grade: 6
- 11th grade: 0
- 12th grade, no diploma: 4
- High school graduate (or equivalency): 151
- Less than 1 year of college: 49
- Some college more than 1 year, no degree: 62
- Associate degree: 33
- Bachelor's degree: 145
- Master's degree: 48
- Professional school degree: 0
- Doctorate degree: 1

Housing units in structures:
- One, detached: 426
- One, attached: 84
- Two: 37
- 3 or 4: 9
- 5 to 9: 12
Housing units lacking complete kitchen facilities in 2022: 1.8%

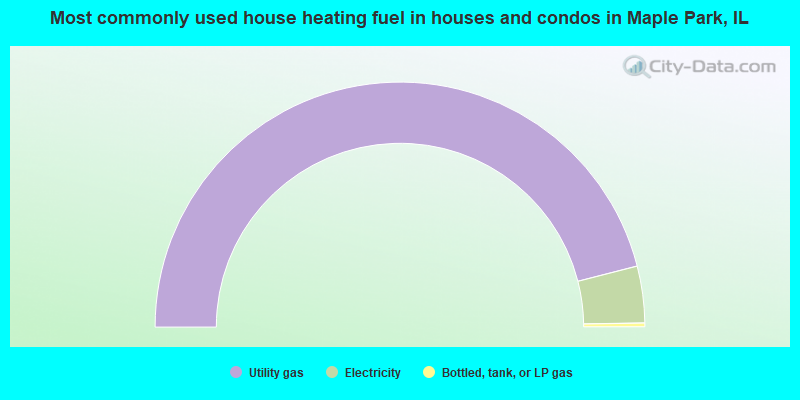
- 92.1%Utility gas
- 7.5%Electricity
- 0.5%Bottled, tank, or LP gas
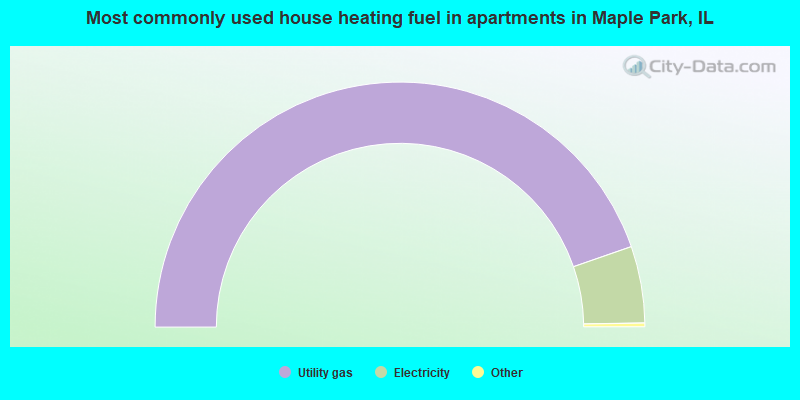
- 89.8%Utility gas
- 10.2%Electricity
Private vs. public school enrollment:
| Here: | 7.4% |
| Illinois: | 13.3% |
| Here: | 2.9% |
| Illinois: | 9.9% |
| Here: | 65.4% |
| Illinois: | 27.4% |


