Maricopa, AZ (Arizona) Houses and Residents
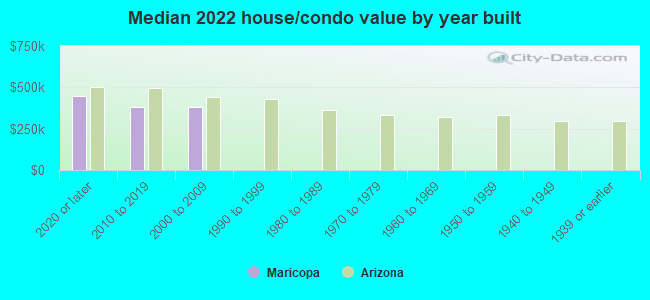
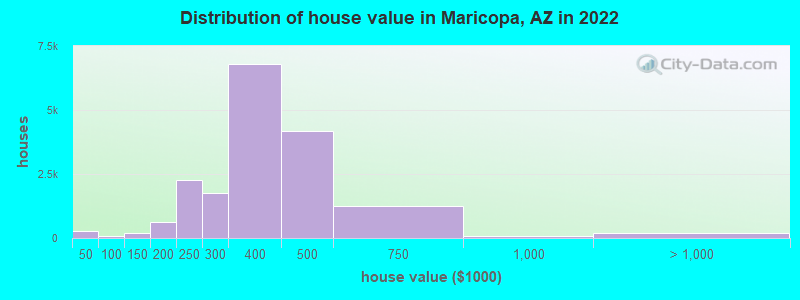
Estimated median house or condo value in 2022: $382,900 (it was $75,500 in 2000 )
Maricopa:
$382,900Arizona:
$402,800
Lower value quartile - upper value quartile: $323,700 - $460,300Mean price in 2022: Detached houses: $243,050 Here:
$243,050State:
$521,408
Townhouses or other attached units: $474,198 Here:
$474,198State:
$387,465
Mobile homes: $74,143 Here:
$74,143State:
$141,516
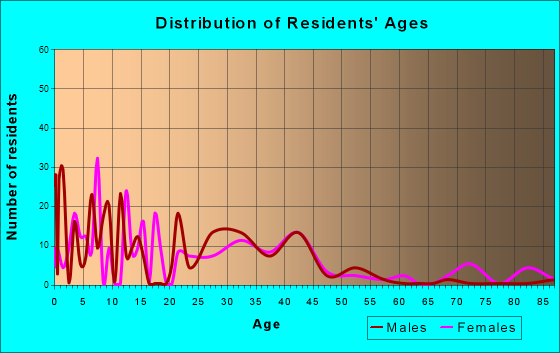
Total population: 47,442 (Urban population: 0, Rural population: 1,080 (all nonfarm) )
Houses: 24,398 (21,730 occupied: 17,706 owner occupied, 4,024 renter occupied )
% of renters here:
19%State:
33%
Housing density: 6,044 houses/condos per square mile
Median price asked for vacant for-sale houses and condos in 2022: $402,131.
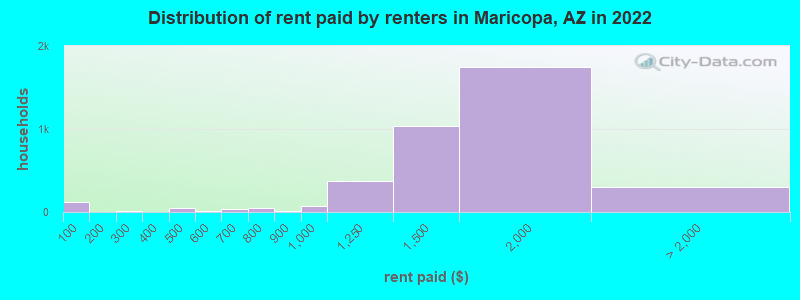
Median contract rent in 2022: $1,518 (lower quartile is $1,323, upper quartile is $1,852)
Median rent asked for vacant for-rent units in 2022: $990
Median gross rent in Maricopa, AZ in 2022: $1,862
Housing units in Maricopa with a mortgage: 15,026 (827 second mortgage, 0 home equity loan, 566 both second mortgage and home equity loan )Houses without a mortgage: 0
Median household income for houses/condos with a mortgage: $105,347
Median household income for apartments without a mortgage: $70,208
Median monthly housing costs: $1,553
Data:
Median house or condo value ($)
Median house or condo value ($ change since 2000)
Median house or condo value ($) - White
Median house or condo value ($) - Black or African American
Median house or condo value ($) - Asian
Median house or condo value ($) - Hispanic or Latino
Median house or condo value ($) - American Indian and Alaska Native
Median house or condo value ($) - Multirace
Median house or condo value ($) - Other Race
Median price asked for mobile homes ($)
Household density (households per square mile)
Mean house or condo value by units in structure - 1, detached ($)
Mean house or condo value by units in structure - 1, attached ($)
Mean house or condo value by units in structure - 2 ($)
Mean house or condo value by units in structure by units in structure - 3 or 4 ($)
Mean house or condo value by units in structure - 5 or more ($)
Mean house or condo value by units in structure - Boat, RV, van, etc. ($)
Mean house or condo value by units in structure - Mobile home ($)
Median contract rent ($)
Median contract rent - Lower quartile ($)
Median contract rent - Upper quartile ($)
Median gross rent ($)
Urban houses (%)
Rural houses (%)
Houses occupied (%)
Houses occupied (% change since 2000)
Houses owner occupied (%)
Houses owner occupied (% change since 2000)
Houses renter occupied (%)
Houses renter occupied (% change since 2000)
Vacant housing units - For rent (%)
Vacant housing units - For rent (% change since 2000)
Vacant housing units - For sale only (%)
Vacant housing units - For sale only (% change since 2000)
Vacant housing units - Rented or sold, not occupied (%)
Vacant housing units - Rented or sold, not occupied (% change since 2000)
Vacant housing units - For seasonal, recreational, or occasional use (%)
Vacant housing units - For seasonal, recreational, or occasional use (% change since 2000)
Vacant housing units - For migrant workers (%)
Vacant housing units - For migrant workers (% change since 2000)
Vacant housing units - Other vacant (%)
Vacant housing units - Other vacant (% change since 2000)
Median monthly housing costs ($)
Median household income for houses/condos with a mortgage ($)
Median household income for houses/condos without a mortgage ($)
Median household income ($)
Median household income ($) - White
Median household income ($) - Black or African American
Median household income ($) - Asian
Median household income ($) - Hispanic or Latino
Median household income ($) - American Indian and Alaska Native
Median household income ($) - Multirace
Median household income ($) - Other Race
Mortgage status - with mortgage (%)
Mortgage status - with second mortgage (%)
Mortgage status - with home equity loan (%)
Mortgage status - with both second mortgage and home equity loan (%)
Mortgage status - without a mortgage (%)
Median year house/condo built
Median year apartment built
Household type by relationship - Male householder living alone (%)
Household type by relationship - Male householder not living alone (%)
Household type by relationship - Female householder living alone (%)
Household type by relationship - Female householder not living alone (%)
Household type by relationship - Opposite-Sex spouse (%)
Household type by relationship - Same-Sex spouse (%)
Household type by relationship - Opposite-Sex unmarried partner (%)
Household type by relationship - Same-Sex unmarried partner (%)
Household type by relationship - In group quarters (%)
Size of family households - 2-person household (%)
Size of family households - 3-person household (%)
Size of family households - 4-person household (%)
Size of family households - 5-person household (%)
Size of family households - 6-person household (%)
Size of family households - 7-or-more-person household (%)
Size of nonfamily households - 1-person household (%)
Size of nonfamily households - 2-person household (%)
Size of nonfamily households - 3-person household (%)
Size of nonfamily households - 4-person household (%)
Size of nonfamily households - 5-person household (%)
Size of nonfamily households - 6-person household (%)
Size of nonfamily households - 7-or-moreperson household (%)
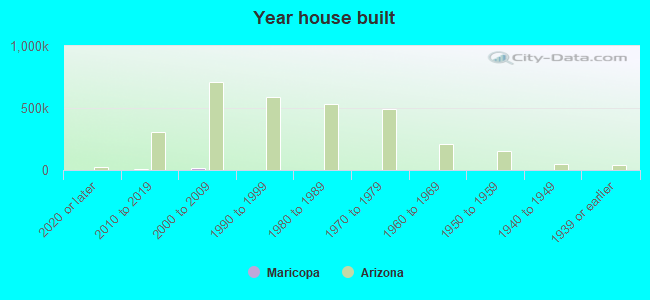
Year house built - Built 2010 or later (%)
Year house built - Built 2000 to 2009 (%)
Year house built - Built 1990 to 1999 (%)
Year house built - Built 1980 to 1989 (%)
Year house built - Built 1970 to 1979 (%)
Year house built - Built 1960 to 1969 (%)
Year house built - Built 1950 to 1959 (%)
Year house built - Built 1940 to 1949 (%)
Year house built - Built 1939 or earlier (%)
Median number of rooms in houses and condos
Median number of rooms in apartments
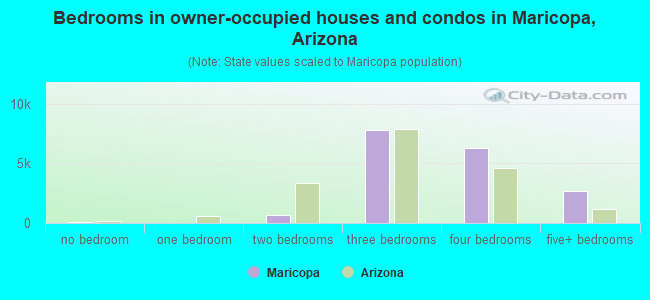
Median number of bedrooms in owner occupied houses
Mean number of bedrooms in owner occupied houses
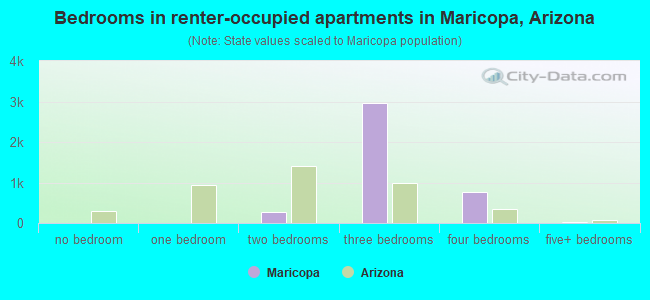
Median number of bedrooms in renter occupied houses
Mean number of bedrooms in renter occupied houses
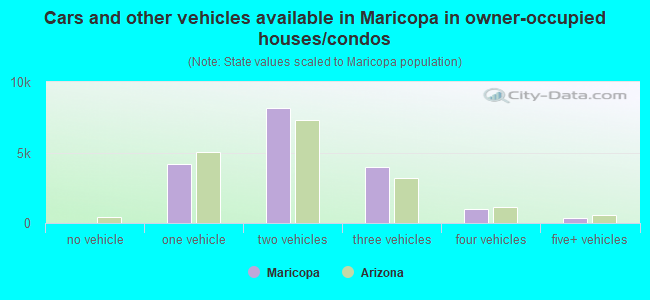
Median number of vehichles in owner occupied houses
Mean number of vehichles in owner occupied houses
Median number of vehichles in renter occupied houses
Mean number of vehichles in renter occupied houses
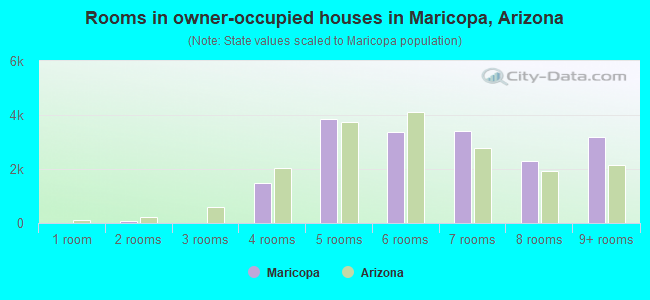
Rooms in owner-occupied houses - 1 room (%)
Rooms in owner-occupied houses - 2 rooms (%)
Rooms in owner-occupied houses - 3 rooms (%)
Rooms in owner-occupied houses - 4 rooms (%)
Rooms in owner-occupied houses - 5 rooms (%)
Rooms in owner-occupied houses - 6 rooms (%)
Rooms in owner-occupied houses - 7 rooms (%)
Rooms in owner-occupied houses - 8 rooms (%)
Rooms in owner-occupied houses - 9+ rooms (%)
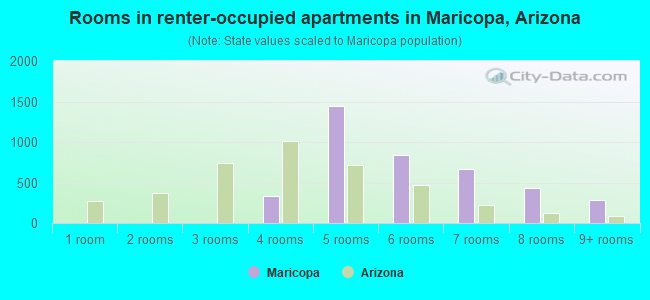
Rooms in renter-occupied houses - 1 room (%)
Rooms in renter-occupied houses - 2 rooms (%)
Rooms in renter-occupied houses - 3 rooms (%)
Rooms in renter-occupied houses - 4 rooms (%)
Rooms in renter-occupied houses - 5 rooms (%)
Rooms in renter-occupied houses - 6 rooms (%)
Rooms in renter-occupied houses - 7 rooms (%)
Rooms in renter-occupied houses - 8 rooms (%)
Rooms in renter-occupied houses - 9+ rooms (%)
Bedrooms in owner-occupied houses - no bedrooms (%)
Bedrooms in owner-occupied houses - 1 bedroom (%)
Bedrooms in owner-occupied houses - 2 bedrooms (%)
Bedrooms in owner-occupied houses - 3 bedrooms (%)
Bedrooms in owner-occupied houses - 4 bedrooms (%)
Bedrooms in owner-occupied houses - 5+ bedrooms (%)
Bedrooms in renter-occupied houses - no bedrooms (%)
Bedrooms in renter-occupied houses - 1 bedroom (%)
Bedrooms in renter-occupied houses - 2 bedrooms (%)
Bedrooms in renter-occupied houses - 3 bedrooms (%)
Bedrooms in renter-occupied houses - 4 bedrooms (%)
Bedrooms in renter-occupied houses - 5+ bedrooms (%)
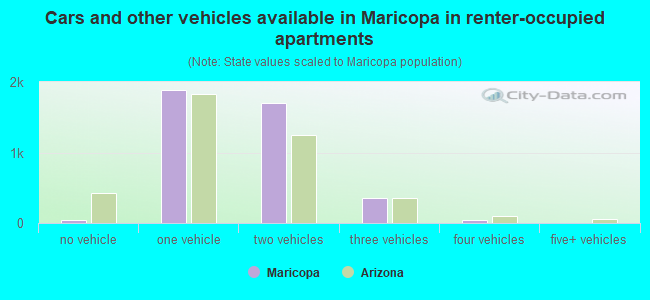
Vehicles available in owner-occupied houses - no vehicle available (%)
Vehicles available in owner-occupied houses - 1 vehicle available(%)
Vehicles available in owner-occupied houses - 2 Vehicles available (%)
Vehicles available in owner-occupied houses - 3 Vehicles available (%)
Vehicles available in owner-occupied houses - 4 Vehicles available (%)
Vehicles available in owner-occupied houses - 5+ Vehicles available (%)
Vehicles available in renter-occupied houses - no vehicle available (%)
Vehicles available in renter-occupied houses - 1 vehicle available (%)
Vehicles available in renter-occupied houses - 2 Vehicles available (%)
Vehicles available in renter-occupied houses - 3 Vehicles available (%)
Vehicles available in renter-occupied houses - 4 Vehicles available (%)
Vehicles available in renter-occupied houses - 5+ Vehicles available (%)
Housing units in structures - 1, detached (%)
Housing units in structures - 1, attached (%)
Housing units in structures - 2 (%)
Housing units in structures - 3 or 4 (%)
Housing units in structures - 5 to 9 (%)
Housing units in structures - 10 to 19 (%)
Housing units in structures - 20 to 49 (%)
Housing units in structures - 50 or more (%)
Housing units in structures - Mobile home (%)
Housing units in structures - Boat, RV, van, etc. (%)
Housing units in structures - Owners - 1, detached (%)
Housing units in structures - Owners - 1, attached (%)
Housing units in structures - Owners - 2 (%)
Housing units in structures - Owners - 3 or 4 (%)
Housing units in structures - Owners - 5 to 9 (%)
Housing units in structures - Owners - 10 to 19 (%)
Housing units in structures - Owners - 20 to 49 (%)
Housing units in structures - Owners - 50 or more (%)
Housing units in structures - Owners - Mobile home (%)
Housing units in structures - Owners - Boat, RV, van, etc. (%)
Housing units in structures - Renters - 1, detached (%)
Housing units in structures - Renters - 1, attached (%)
Housing units in structures - Renters - 2 (%)
Housing units in structures - Renters - 3 or 4 (%)
Housing units in structures - Renters - 5 to 9 (%)
Housing units in structures - Renters - 10 to 19 (%)
Housing units in structures - Renters - 20 to 49 (%)
Housing units in structures - Renters - 50 or more (%)
Housing units in structures - Renters - Mobile home (%)
Housing units in structures - Renters - Boat, RV, van, etc. (%)
House/condo owner moved in on average (years ago)
Renter moved in on average (years ago)
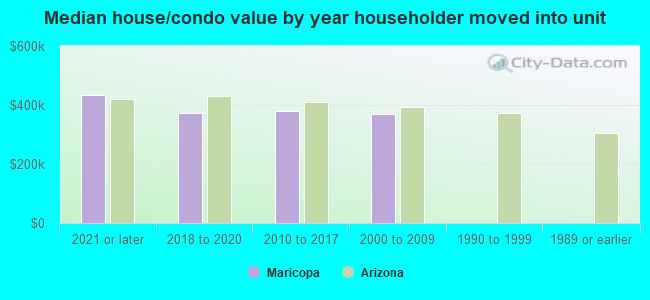
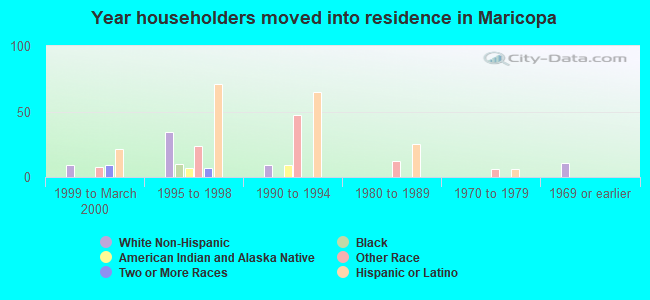
Year householder moved into unit - Moved in 1999 to March 2000 (%)
Year householder moved into unit - Moved in 1999 to March 2000 (%) - White
Year householder moved into unit - Moved in 1999 to March 2000 (%) - Black or African American
Year householder moved into unit - Moved in 1999 to March 2000 (%) - Asian
Year householder moved into unit - Moved in 1999 to March 2000 (%) - Hispanic or Latino
Year householder moved into unit - Moved in 1999 to March 2000 (%) - American Indian and Alaska Native
Year householder moved into unit - Moved in 1999 to March 2000 (%) - Multirace
Year householder moved into unit - Moved in 1999 to March 2000 (%) - Other Race
Year householder moved into unit - Moved in 1995 to 1998 (%)
Year householder moved into unit - Moved in 1995 to 1998 (%) - White
Year householder moved into unit - Moved in 1995 to 1998 (%) - Black or African American
Year householder moved into unit - Moved in 1995 to 1998 (%) - Asian
Year householder moved into unit - Moved in 1995 to 1998 (%) - Hispanic or Latino
Year householder moved into unit - Moved in 1995 to 1998 (%) - American Indian and Alaska Native
Year householder moved into unit - Moved in 1995 to 1998 (%) - Multirace
Year householder moved into unit - Moved in 1995 to 1998 (%) - Other Race
Year householder moved into unit - Moved in 1990 to 1994 (%)
Year householder moved into unit - Moved in 1990 to 1994 (%) - White
Year householder moved into unit - Moved in 1990 to 1994 (%) - Black or African American
Year householder moved into unit - Moved in 1990 to 1994 (%) - Asian
Year householder moved into unit - Moved in 1990 to 1994 (%) - Hispanic or Latino
Year householder moved into unit - Moved in 1990 to 1994 (%) - American Indian and Alaska Native
Year householder moved into unit - Moved in 1990 to 1994 (%) - Multirace
Year householder moved into unit - Moved in 1990 to 1994 (%) - Other Race
Year householder moved into unit - Moved in 1980 to 1989 (%)
Year householder moved into unit - Moved in 1980 to 1989 (%) - White
Year householder moved into unit - Moved in 1980 to 1989 (%) - Black or African American
Year householder moved into unit - Moved in 1980 to 1989 (%) - Asian
Year householder moved into unit - Moved in 1980 to 1989 (%) - Hispanic or Latino
Year householder moved into unit - Moved in 1980 to 1989 (%) - American Indian and Alaska Native
Year householder moved into unit - Moved in 1980 to 1989 (%) - Multirace
Year householder moved into unit - Moved in 1980 to 1989 (%) - Other Race
Year householder moved into unit - Moved in 1970 to 1979 (%)
Year householder moved into unit - Moved in 1970 to 1979 (%) - White
Year householder moved into unit - Moved in 1970 to 1979 (%) - Black or African American
Year householder moved into unit - Moved in 1970 to 1979 (%) - Asian
Year householder moved into unit - Moved in 1970 to 1979 (%) - Hispanic or Latino
Year householder moved into unit - Moved in 1970 to 1979 (%) - American Indian and Alaska Native
Year householder moved into unit - Moved in 1970 to 1979 (%) - Multirace
Year householder moved into unit - Moved in 1970 to 1979 (%) - Other Race
Year householder moved into unit - Moved in 1969 or earlier (%)
Year householder moved into unit - Moved in 1969 or earlier (%) - White
Year householder moved into unit - Moved in 1969 or earlier (%) - Black or African American
Year householder moved into unit - Moved in 1969 or earlier (%) - Asian
Year householder moved into unit - Moved in 1969 or earlier (%) - Hispanic or Latino
Year householder moved into unit - Moved in 1969 or earlier (%) - American Indian and Alaska Native
Year householder moved into unit - Moved in 1969 or earlier (%) - Multirace
Year householder moved into unit - Moved in 1969 or earlier (%) - Other Race
Housing units lacking complete plumbing facilities (%)
Housing units lacking complete kitchen facilities (%)
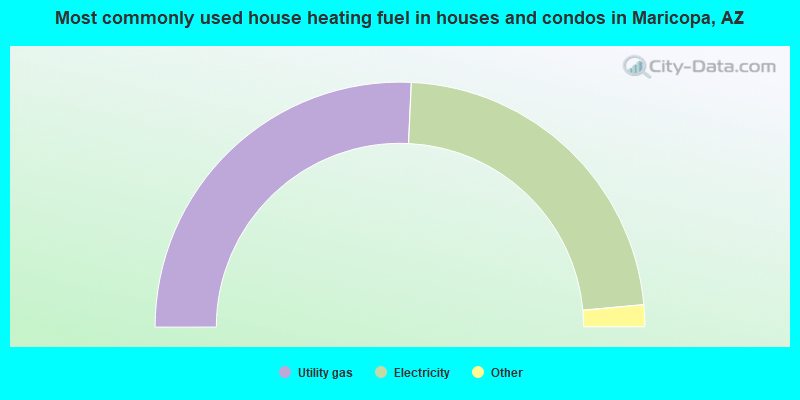
House heating fuel used in houses and condos - Utility gas (%)
House heating fuel used in houses and condos - Bottled, tank, or LP gas (%)
House heating fuel used in houses and condos - Electricity (%)
House heating fuel used in houses and condos - Fuel oil, kerosene, etc. (%)
House heating fuel used in houses and condos - Coal or coke (%)
House heating fuel used in houses and condos - Wood (%)
House heating fuel used in houses and condos - Solar energy (%)
House heating fuel used in houses and condos - Other fuel (%)
House heating fuel used in houses and condos - No fuel used (%)
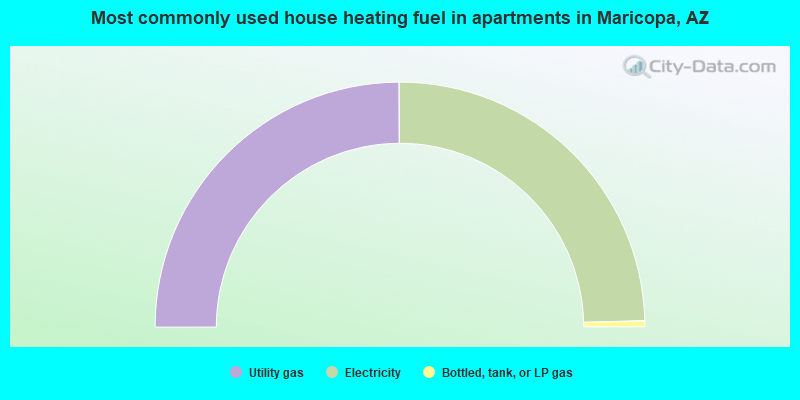
House heating fuel used in apartments - Utility gas (%)
House heating fuel used in apartments - Bottled, tank, or LP gas (%)
House heating fuel used in apartments - Electricity (%)
House heating fuel used in apartments - Fuel oil, kerosene, etc. (%)
House heating fuel used in apartments - Coal or coke (%)
House heating fuel used in apartments - Wood (%)
House heating fuel used in apartments - Solar energy (%)
House heating fuel used in apartments - Other fuel (%)
House heating fuel used in apartments - No fuel used (%)
Latest news about housing in Maricopa, AZ collected exclusively by city-data.com from local newspapers, TV, and radio stations
Median year house/condo built: 2007Median year apartment built: 2006Household type by relationship:
Households: 66,287
Male householders: 11,004 (1,969 living alone ), Female householders: 10,726 (1,518 living alone )12,528 spouses (12,468 opposite-sex spouses ), 2,095 unmarried partners , (1,835 opposite-sex unmarried partners ), 22,283 children (21,087 natural , 464 adopted , 732 stepchildren ), 2,183 grandchildren , 618 brothers or sisters , 1,333 parents , 1,075 foster children , 699 other relatives , 1,738 non-relatives In group quarters: 5
Size of family households: 6,527 2-persons , 3,795 3-persons , 1,972 4-persons , 1,908 5-persons , 1,089 6-persons , 1,229 7-or-more-persons .
Size of nonfamily households: 3,487 1-person , 1,570 2-persons , 153 5-persons .
11,300 married couples with children. single-parent households (2,025 men , 2,172 women ).
79.8% of residents of Maricopa speak English at home. of residents speak Spanish at home (77% speak English very well , 11% speak English well , 8% speak English not well , 4% don't speak English at all ).of residents speak other Indo-European language at home (58% speak English very well , 23% speak English well , 7% speak English not well , 12% don't speak English at all ).of residents speak Asian or Pacific Island language at home (68% speak English very well , 29% speak English well , 3% speak English not well ).of residents speak other language at home (94% speak English very well , 3% speak English well , 3% speak English not well ).
Foreign born population: 7,042 (10.6%)of them are naturalized citizens )
Median number of rooms in houses and condos:
Median number of rooms in apartments
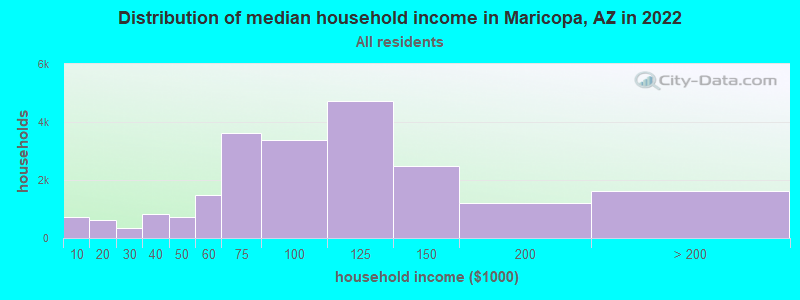
Maricopa, AZ household income distribution 731 Less than $10,000609 $10,000 to $19,999328 $20,000 to $29,999833 $30,000 to $39,999712 $40,000 to $49,9991,497 $50,000 to $59,9993,611 $60,000 to $74,9993,380 $75,000 to $99,9994,709 $100,000 to $124,9992,485 $125,000 to $149,9991,223 $150,000 to $199,9991,612 $200,000 or more
Home value of owner - occupied houses in 2022 in Maricopa, AZ 83 Less than $10,0003 $15,000 to $19,99920 $20,000 to $24,99911 $25,000 to $29,99957 $30,000 to $34,99940 $35,000 to $39,99940 $40,000 to $49,99911 $50,000 to $59,9993 $70,000 to $79,9998 $80,000 to $89,99915 $90,000 to $99,999122 $100,000 to $124,99971 $125,000 to $149,999137 $150,000 to $174,999498 $175,000 to $199,9992,271 $200,000 to $249,9991,752 $250,000 to $299,9996,787 $300,000 to $399,9994,163 $400,000 to $499,9991,246 $500,000 to $749,99990 $750,000 to $999,99927 $1,000,000 to $1,499,999143 $1,500,000 to $1,999,99926 $2,000,000 or moreRent paid by renters in 2022 in Maricopa, AZ 114 Less than $10012 $200 to $24947 $400 to $4497 $550 to $59933 $650 to $69914 $700 to $74927 $750 to $79918 $800 to $89969 $900 to $999378 $1,000 to $1,2491,038 $1,250 to $1,4991,742 $1,500 to $1,999133 $2,000 to $2,49979 $2,500 to $2,99986 No cash rent
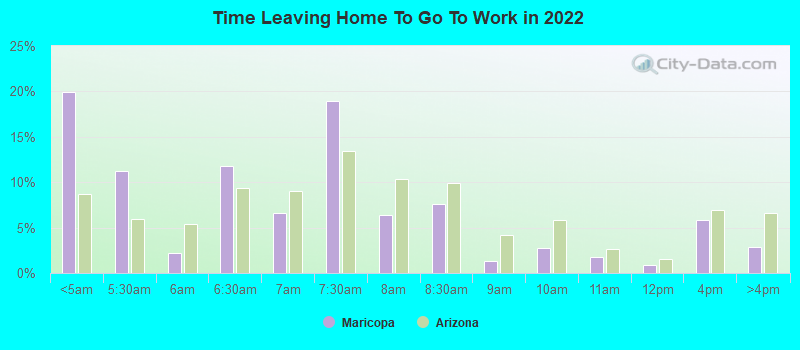
Percentage of workers working in this county: 47.7%Number of people working at home: 6,936 (22.0% of all workers )
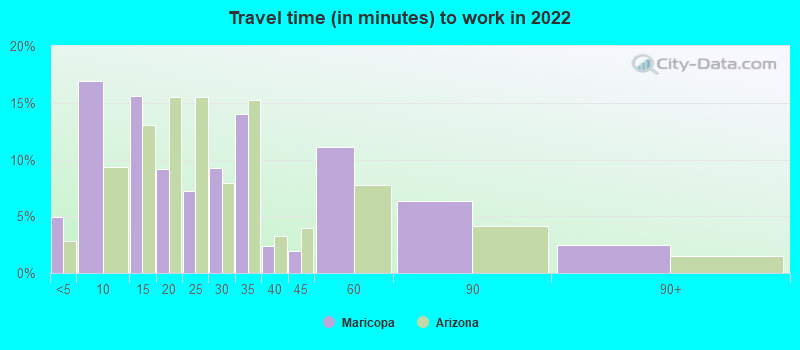
Travel time to work (commute)
Less than 5 minutes: 6615 to 9 minutes: 2,39910 to 14 minutes: 90215 to 19 minutes: 1,37020 to 24 minutes: 26725 to 29 minutes: 1,35530 to 34 minutes: 4,89035 to 39 minutes: 1,12940 to 44 minutes: 1,95745 to 59 minutes: 6,02460 to 89 minutes: 3,02390 or more minutes: 348
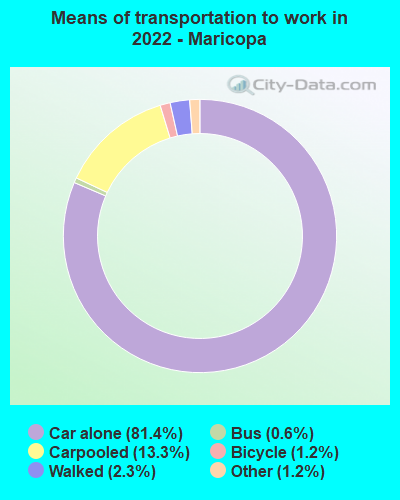
Means of transportation to work:
Drove a car alone: 7,848 (52.0%)Carpooled: 1,350 (9.0%)Bus : 37 (0.2%)Taxi: 136 (0.9%)Bicycle: 101 (0.7%)Walked: 240 (1.6%)Worked at home: 6,440 (42.7%)
Unemployment by race in 2022
Unemployment rate for White non-Hispanic residents 2.9% Males2.5% FemalesUnemployment rate for Black residents 6.9% Males10.2% FemalesUnemployment rate for American Indian and Alaska Native residents 7.2% FemalesUnemployment rate for Asian residents 4.1% FemalesUnemployment rate for other race residents 1.6% Males0.7% FemalesUnemployment rate for two or more race residents 0.6% Males2.6% FemalesUnemployment rate for Hispanic or Latino residents 1.7% Males1.1% Females
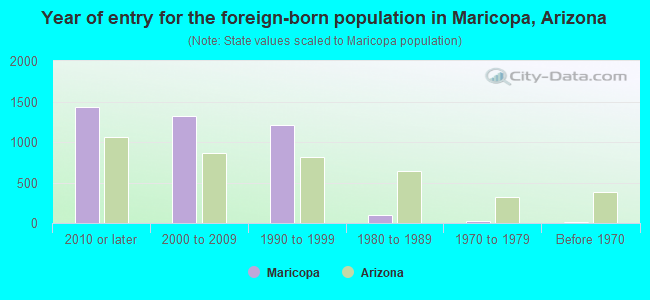
Year of entry for the foreign-born population in Maricopa, Arizona
1,436 2010 or later 1,316 2000 to 2009 1,206 1990 to 1999 95 1980 to 1989 30 1970 to 1979 8 Before 1970
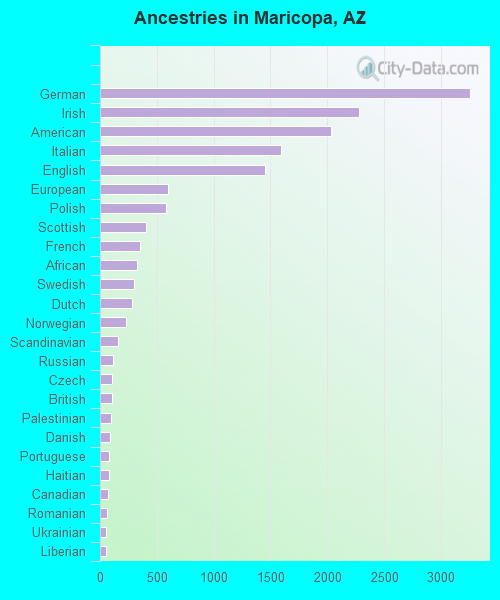
First ancestries reported:
German: 3,261 (8.9%)
Irish: 2,280 (6.2%)
American: 2,029 (5.5%)
Italian: 1,596 (4.4%)
English: 1,454 (4.0%)
European: 598 (1.6%)
Polish: 577 (1.6%)
Scottish: 401 (1.1%)
French: 349 (1.0%)
African: 327 (0.9%)
Swedish: 295 (0.8%)
Dutch: 286 (0.8%)
Norwegian: 233 (0.6%)
Scandinavian: 158 (0.4%)
Russian: 117 (0.3%)
Czech: 105 (0.3%)
British: 104 (0.3%)
Palestinian: 95 (0.3%)
Danish: 91 (0.2%)
Portuguese: 79 (0.2%)
Haitian: 76 (0.2%)
Canadian: 69 (0.2%)
Romanian: 65 (0.2%)
Ukrainian: 57 (0.2%)
Liberian: 56 (0.2%)
Nigerian: 55 (0.2%)
Hungarian: 54 (0.1%)
Finnish: 47 (0.1%)
Serbian: 33 (0.09%)
Macedonian: 31 (0.08%)
Jamaican: 30 (0.08%)
Iraqi: 29 (0.08%)
Scotch-Irish: 23 (0.06%)
Swiss: 23 (0.06%)
Arab: 22 (0.06%)
Czechoslovakian: 21 (0.06%)
Belizean: 21 (0.06%)
Welsh: 20 (0.05%)
Lebanese: 18 (0.05%)
Syrian: 16 (0.04%)
Eastern European: 15 (0.04%)
Israeli: 14 (0.04%)
Iranian: 14 (0.04%)
Northern European: 13 (0.04%)
French Canadian: 11 (0.03%)
Australian: 11 (0.03%)
Austrian: 10 (0.03%)
Kenyan: 10 (0.03%)
Lithuanian: 9 (0.02%)
Slovene: 8 (0.02%)
Latvian: 8 (0.02%)
Belgian: 8 (0.02%)
Brazilian: 5 (0.01%)
Most common places of birth for foreign-born residents (%): Mexico Maricopa:
47.9% (2,590)Arizona:
53.4% (500,086)
Philippines Maricopa:
5.9% (319)Arizona:
3.2% (30,378)
Cuba Maricopa:
4.1% (224)Arizona:
1.0% (8,899)
Canada Maricopa:
4.0% (216)Arizona:
4.3% (40,102)
Guatemala Maricopa:
3.5% (189)Arizona:
1.6% (14,556)
India Maricopa:
3.0% (161)Arizona:
4.5% (41,719)
Haiti Maricopa:
2.8% (151)Arizona:
0.2% (1,684)
Jamaica Maricopa:
2.7% (148)Arizona:
0.3% (2,710)
Ecuador Maricopa:
2.6% (140)Arizona:
0.2% (1,911)
Korea Maricopa:
2.2% (119)Arizona:
1.2% (11,275)
Liberia Maricopa:
1.7% (94)Arizona:
0.1% (1,015)
Oceania, n.e.c. Maricopa:
1.7% (92)Arizona:
0.1% (1,069)
Vietnam Maricopa:
1.6% (88)Arizona:
2.1% (19,199)
Place of birth for U.S.-born residents:
This state: 21,043Other state: 36,051Northeast: 3,085Midwest: 14,444South: 5,462West: 13,060 85.9% of Maricopa residents lived in the same house 1 years ago.
Out of people who lived in different houses, 22.5% lived in this county.
Out of people who lived in different counties, 56.5% lived in Arizona.
Maricopa:
85.9%State average:
86.0%
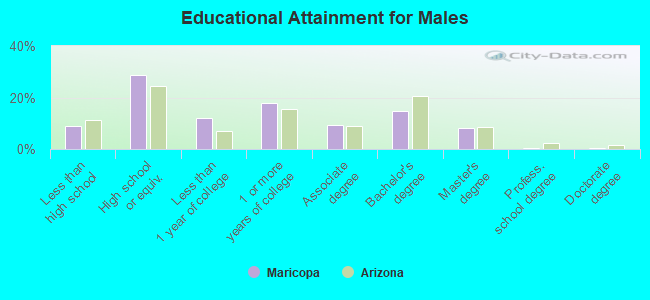
Education attainment for males 25 years and older:
No schooling: 272Nursery to 4th grade: 05th and 6th grade: 3147th and 8th grade: 4009th grade: 4410th grade: 13511th grade: 11212th grade, no diploma: 657High school graduate (or equivalency): 6,187Less than 1 year of college: 2,599Some college more than 1 year, no degree: 3,897Associate degree: 1,984Bachelor's degree: 3,157Master's degree: 1,783Professional school degree: 43Doctorate degree: 52
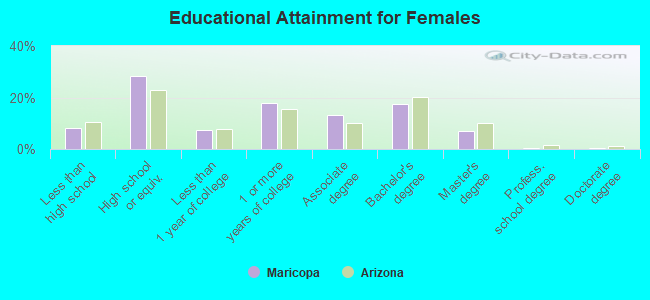
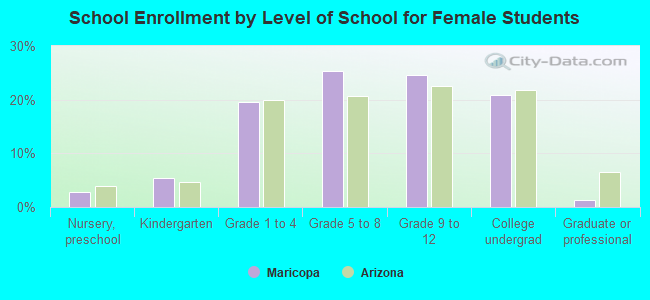
Education attainment for females 25 years and older:
No schooling: 419Nursery to 4th grade: 05th and 6th grade: 3717th and 8th grade: 2479th grade: 010th grade: 15811th grade: 8512th grade, no diploma: 456High school graduate (or equivalency): 5,966Less than 1 year of college: 1,543Some college more than 1 year, no degree: 3,721Associate degree: 2,796Bachelor's degree: 3,642Master's degree: 1,451Professional school degree: 61Doctorate degree: 108
Housing units in structures:
One, detached: 21,655One, attached: 440Two: 865 to 9: 1510 to 19: 650 or more: 47Mobile homes: 177Boats, RVs, vans, etc.: 11House/condo owner moved in on average 4 years ago
Renter moved in on average 1 years ago
Private vs. public school enrollment:
Students in private schools in grades 1 to 8 (elementary and middle school): 1,164 Students in private schools in grades 9 to 12 (high school): 274 Students in private undergraduate colleges: 393