Marion, VA (Virginia) Houses and Residents
| Marion: | $162,725 |
| Virginia: | $365,700 |
Total population: 5,875 (All urban)
Houses: 2,812 (2,424 occupied: 1,229 owner occupied, 1,221 renter occupied)
| % of renters here: | 50% |
| State: | 33% |
Housing density: 677 houses/condos per square mile
Median price asked for vacant for-sale houses and condos in 2022 in this county: $476,139.
Median contract rent in 2022: $514 (lower quartile is $349, upper quartile is $613)
Median rent asked for vacant for-rent units in 2022: $652
Median gross rent in Marion, VA in 2022: $683
Housing units in Marion with a mortgage: 591 (37 second mortgage, 0 home equity loan, 28 both second mortgage and home equity loan)
Houses without a mortgage: 10
Median household income for houses/condos with a mortgage: $78,894
Median household income for apartments without a mortgage: $49,016
Median monthly housing costs: $656
Compare current foreclosures near Marion, VA:
| Photo | Address | Area | Beds / Baths | Price | Details |
|---|---|---|---|---|---|

|
#1
Williams Rd
Marion, VA 24354
|
1,578 sq. feet
|
1 baths 2 beds |
show details | |

|
#2
Goolsby St
Marion, VA 24354
|
1,148 sq. feet
|
1 baths 3 beds |
show details | |

|
#3
Spruce St
Marion, VA 24354
|
2,120 sq. feet
|
1 baths 2 beds |
show details | |

|
#4
Windmere Ln
Marion, VA 24354
|
1,713 sq. feet
|
2 baths 3 beds |
show details | |

|
#5
W Coyner Ave
Marion, VA 24354
|
1,405 sq. feet
|
1 baths 4 beds |
show details | |

|
#6
North Dr
Marion, VA 24354
|
1,160 sq. feet
|
2 baths 3 beds |
show details | |

|
#7
Riverside Rd
Marion, VA 24354
|
1,589 sq. feet
|
1 baths 2 beds |
show details | |

|
#8
Henry St
Marion, VA 24354
|
1,306 sq. feet
|
1 baths 3 beds |
show details | |

|
#9
Harris Ln
Marion, VA 24354
|
2,464 sq. feet
|
1 baths 3 beds |
show details | |

|
#10
Candy Ln
Marion, VA 24354
|
1,304 sq. feet
|
2 baths 3 beds |
show details |
| Photo | Address | Area | Beds / Baths | Price | Details |
|---|---|---|---|---|---|

|
#11
Seven Mile Ford Rd
Marion, VA 24354
|
846 sq. feet
|
1 baths 2 beds |
show details | |

|
#12
Hockett St
Marion, VA 24354
|
1,506 sq. feet
|
2 baths 3 beds |
show details | |

|
#13
Holston Hills Ln
Marion, VA 24354
|
- sq. feet
|
- baths - beds |
show details | |

|
#14
Pond Hollow Rd
Marion, VA 24354
|
- sq. feet
|
- baths - beds |
show details | |

|
#15
Lee Hwy
Marion, VA 24354
|
- sq. feet
|
- baths - beds |
show details | |

|
#16
Blake Rd
Marion, VA 24354
|
- sq. feet
|
- baths - beds |
show details | |

|
#17
Mulberry Ln
Atkins, VA 24311
|
972 sq. feet
|
1 baths 2 beds |
$22,500
|
show details |

|
#18
Allis Chalmer Rd
Rural Retreat, VA 24368
|
- sq. feet
|
2 baths 3 beds |
show details | |

|
#19
Rush Creek Rd
Glade Spring, VA 24340
|
864 sq. feet
|
1 baths 2 beds |
show details | |

|
#20
Davis Valley Rd
Rural Retreat, VA 24368
|
2,356 sq. feet
|
3 baths 4 beds |
show details |
| Photo | Address | Area | Beds / Baths | Price | Details |
|---|---|---|---|---|---|

|
#21
Haynes Ave
Chilhowie, VA 24319
|
2,078 sq. feet
|
2 baths 3 beds |
show details | |

|
#22
Overlook Dr
Chilhowie, VA 24319
|
720 sq. feet
|
1 baths 2 beds |
show details | |

|
#23
Wet Springs Rd
Chilhowie, VA 24319
|
1,603 sq. feet
|
2 baths 4 beds |
show details | |

|
#24
Austin Ln
Chilhowie, VA 24319
|
1,404 sq. feet
|
2 baths 3 beds |
show details | |

|
#25
Teas Rd
Sugar Grove, VA 24375
|
1,616 sq. feet
|
2 baths 3 beds |
show details | |

|
#26
Teas Rd
Sugar Grove, VA 24375
|
1,189 sq. feet
|
1 baths 3 beds |
show details | |

|
#27
Bonham Ave
Chilhowie, VA 24319
|
- sq. feet
|
- baths - beds |
show details | |

|
#28
Four Seasons Rd
Rural Retreat, VA 24368
|
- sq. feet
|
- baths - beds |
show details | |

|
#29
Spring Garden Dr
Glade Spring, VA 24340
|
- sq. feet
|
- baths - beds |
show details | |

|
#30
E Buck Ave
Rural Retreat, VA 24368
|
- sq. feet
|
- baths - beds |
show details |
| Photo | Address | Area | Beds / Baths | Price | Details |
|---|---|---|---|---|---|

|
#31
Azalea Dr
Glade Spring, VA 24340
|
- sq. feet
|
- baths - beds |
show details | |

|
#32
Varnelle Ave
Rural Retreat, VA 24368
|
- sq. feet
|
- baths - beds |
show details | |

|
#33
Hartspring Rd
Saltville, VA 24370
|
- sq. feet
|
- baths - beds |
show details | |

|
#34
Hilton Ln
Rural Retreat, VA 24368
|
- sq. feet
|
- baths - beds |
show details | |

|
#35
Saltville Hwy
Saltville, VA 24370
|
- sq. feet
|
- baths - beds |
show details | |

|
#36
Cedar Springs Rd
Sugar Grove, VA 24375
|
- sq. feet
|
- baths - beds |
show details | |

|
#37
Chaparral Ln
Chilhowie, VA 24319
|
- sq. feet
|
- baths - beds |
show details | |

|
#38
Rocky Hollow Rd
Troutdale, VA 24378
|
- sq. feet
|
- baths - beds |
show details | |

|
#39
Maple Leaf Ln
Sugar Grove, VA 24375
|
- sq. feet
|
- baths - beds |
show details | |

|
#40
Citizens Rd
Rural Retreat, VA 24368
|
- sq. feet
|
- baths - beds |
show details |
| Photo | Address | Area | Beds / Baths | Price | Details |
|---|---|---|---|---|---|

|
#41
Kiawana Rd
Atkins, VA 24311
|
- sq. feet
|
- baths - beds |
show details | |

|
#42
Needmore Rd
Chilhowie, VA 24319
|
- sq. feet
|
- baths - beds |
show details | |

|
#43
Rocky Hollow Rd
Atkins, VA 24311
|
- sq. feet
|
- baths - beds |
show details | |

|
#44
Saint Clairs Creek Rd
Chilhowie, VA 24319
|
- sq. feet
|
- baths - beds |
show details | |

|
#45
Rocky Hollow Rd
Atkins, VA 24311
|
- sq. feet
|
- baths - beds |
show details | |

|
#46
Haven Ridge Rd
Ceres, VA 24318
|
- sq. feet
|
- baths - beds |
show details | |

|
#47
Hidden Hollow Ln
Troutdale, VA 24378
|
- sq. feet
|
- baths - beds |
show details | |

|
#48
Cedar Springs Rd
Rural Retreat, VA 24368
|
- sq. feet
|
- baths - beds |
show details | |

|
#49
Crescent Dr
Glade Spring, VA 24340
|
- sq. feet
|
- baths - beds |
show details | |

|
Check over 1 million property listings on Foreclosure.com!
|
browse all offers | |||

Latest news about housing in Marion, VA collected exclusively by city-data.com from local newspapers, TV, and radio stations

 | Virginia's history is being erased right before our eyes (78 replies) |
| Marion Va area-need info on weather, horse events, homes (12 replies) |
| The 599-ish ft elevation (25 replies) |
| Virginia-Best Cities that would work (11 replies) |
| Harrisonburg Staunton info please! (11 replies) |
| HUD waiting list (5 replies) |
Median year apartment built: 1966
Household type by relationship:
Households: 5,761- Male householders: 1,032 (342 living alone), Female householders: 1,369 (540 living alone)
867 spouses (861 opposite-sex spouses), 152 unmarried partners, (122 opposite-sex unmarried partners), 1,180 children (1,094 natural, 4 adopted, 81 stepchildren), 200 grandchildren, 13 brothers or sisters, 60 parents, 0 foster children, 49 other relatives, 334 non-relatives
- In group quarters: 502
Size of family households: 720 2-persons, 323 3-persons, 147 4-persons, 75 5-persons, 77 6-persons, 19 7-or-more-persons.
Size of nonfamily households: 908 1-person, 148 2-persons, 41 3-persons.
472 married couples with children.
392 single-parent households (113 men, 279 women).
97.5% of residents of Marion speak English at home.
2.2% of residents speak Spanish at home (68% speak English very well, 4% speak English well, 28% speak English not well).
0.3% of residents speak other language at home (100% speak English very well).
Foreign born population: 57 (1.0%)
(56.1% of them are naturalized citizens)
| Here: | 6.4 |
| State: | 7.0 |
| Here: | 4.5 |
| State: | 4.3 |

- Bedrooms in owner-occupied houses and condos in Marion, Virginia
- 4no bedroom
- 91 bedroom
- 2222 bedrooms
- 6663 bedrooms
- 2434 bedrooms
- 855+ bedrooms

- Bedrooms in renter-occupied apartments in Marion, Virginia
- 82no bedroom
- 2001 bedroom
- 4882 bedrooms
- 3903 bedrooms
- 254 bedrooms
- 365+ bedrooms

- Cars and other vehicles available in Marion in owner-occupied houses/condos
- 41no vehicle
- 2721 vehicle
- 4572 vehicles
- 2963 vehicles
- 1584 vehicles
- 45+ vehicles

- Cars and other vehicles available in Marion in renter-occupied apartments
- 138no vehicle
- 7361 vehicle
- 2642 vehicles
- 443 vehicles
- 284 vehicles
- 125+ vehicles

- Rooms in owner-occupied houses in Marion, Virginia
- 01 room
- 02 rooms
- 103 rooms
- 874 rooms
- 2565 rooms
- 2966 rooms
- 2457 rooms
- 698 rooms
- 2669+ rooms

- Rooms in renter-occupied apartments in Marion, Virginia
- 821 room
- 252 rooms
- 1593 rooms
- 3084 rooms
- 2725 rooms
- 1946 rooms
- 1167 rooms
- 298 rooms
- 369+ rooms


Marion, VA household income distribution

- 276Less than $10,000
- 348$10,000 to $19,999
- 363$20,000 to $29,999
- 353$30,000 to $39,999
- 139$40,000 to $49,999
- 213$50,000 to $59,999
- 158$60,000 to $74,999
- 217$75,000 to $99,999
- 102$100,000 to $124,999
- 116$125,000 to $149,999
- 97$150,000 to $199,999
- 105$200,000 or more

Home value of owner - occupied houses in 2022 in Marion, VA
-
- 8Less than $10,000
- 4$15,000 to $19,999
- 7$20,000 to $24,999
- 16$25,000 to $29,999
- 5$30,000 to $34,999
- 58$40,000 to $49,999
- 39$50,000 to $59,999
- 19$60,000 to $69,999
- 35$70,000 to $79,999
- 78$80,000 to $89,999
- 31$90,000 to $99,999
- 130$100,000 to $124,999
- 92$125,000 to $149,999
- 155$150,000 to $174,999
- 116$175,000 to $199,999
- 172$200,000 to $249,999
- 31$250,000 to $299,999
- 70$300,000 to $399,999
- 9$400,000 to $499,999

Rent paid by renters in 2022 in Marion, VA
-
- 49Less than $100
- 6$100 to $149
- 36$150 to $199
- 45$200 to $249
- 52$250 to $299
- 82$300 to $349
- 40$350 to $399
- 206$400 to $449
- 40$450 to $499
- 205$500 to $549
- 86$550 to $599
- 116$600 to $649
- 20$650 to $699
- 28$700 to $749
- 33$750 to $799
- 45$800 to $899
- 13$900 to $999
- 34$1,000 to $1,249
- 6$1,250 to $1,499
- 17$1,500 to $1,999
- 50No cash rent


Percentage of workers working in this county: 81.5%
Number of people working at home: 250 (11.1% of all workers)

Travel time to work (commute)
- Less than 5 minutes: 126
- 5 to 9 minutes: 687
- 10 to 14 minutes: 404
- 15 to 19 minutes: 208
- 20 to 24 minutes: 137
- 25 to 29 minutes: 105
- 30 to 34 minutes: 98
- 35 to 39 minutes: 18
- 40 to 44 minutes: 71
- 45 to 59 minutes: 34
- 60 to 89 minutes: 59
- 90 or more minutes: 27

Means of transportation to work:
- Drove a car alone: 3,805 (78.9%)
- Carpooled: 517 (10.7%)
- Bus: 17 (0.4%)
- Taxi: 31 (0.6%)
- Walked: 47 (1.0%)
- Worked at home: 250 (5.2%)

- Unemployment by race in 2022
- Unemployment rate for White non-Hispanic residents
- 7.8%Males
- 1.5%Females
- Unemployment rate for Hispanic or Latino residents
- 13.4%Males

- Year of entry for the foreign-born population in Marion, Virginia
- 212010 or later
- 82000 to 2009
- 81990 to 1999
- 131980 to 1989
- 201970 to 1979
- 0Before 1970
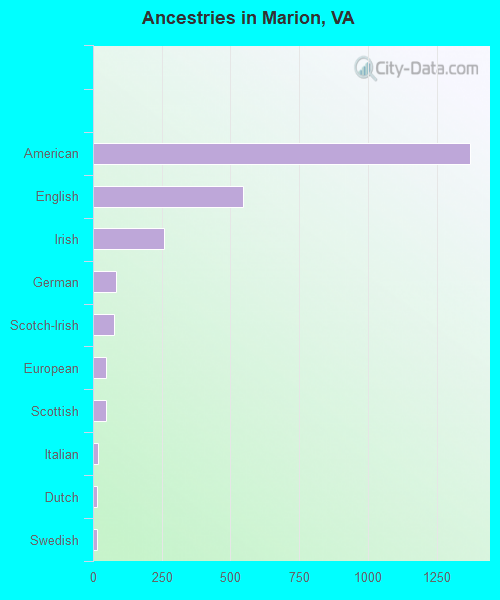
First ancestries reported:
- American: 1,372 (46.1%)
- English: 547 (18.4%)
- Irish: 260 (8.7%)
- German: 84 (2.8%)
- Scotch-Irish: 78 (2.6%)
- European: 49 (1.6%)
- Scottish: 47 (1.6%)
- Italian: 20 (0.7%)
- Dutch: 15 (0.5%)
- Swedish: 13 (0.4%)
- Assyrian: 12 (0.4%)
- African: 10 (0.3%)
- Welsh: 9 (0.3%)
- Northern European: 7 (0.2%)
- Greek: 6 (0.2%)
- French: 5 (0.2%)
- French Canadian: 5 (0.2%)
- British: 4 (0.1%)
Most common places of birth for foreign-born residents (%):
| Marion: | 33.3% (19) |
| Virginia: | 0.6% (6,916) |
| Marion: | 29.8% (17) |
| Virginia: | 3.0% (32,892) |
| Marion: | 14.0% (8) |
| Virginia: | 1.3% (14,435) |
| Marion: | 10.5% (6) |
| Virginia: | 0.2% (2,246) |
| Marion: | 8.8% (5) |
| Virginia: | 5.3% (57,498) |
| Marion: | 3.5% (2) |
| Virginia: | 0.3% (3,713) |
Place of birth for U.S.-born residents:
- This state: 4,245
- Other state: 1,411
- Northeast: 133
- Midwest: 130
- South: 986
- West: 160
83.7% of Marion residents lived in the same house 1 years ago.
Out of people who lived in different houses, 33.5% lived in this county.
Out of people who lived in different counties, 62.8% lived in Virginia.
| Marion: | 83.7% |
| State average: | 86.6% |
Education attainment for males 25 years and older:
- No schooling: 20
- Nursery to 4th grade: 22
- 5th and 6th grade: 38
- 7th and 8th grade: 87
- 9th grade: 26
- 10th grade: 162
- 11th grade: 34
- 12th grade, no diploma: 14
- High school graduate (or equivalency): 721
- Less than 1 year of college: 131
- Some college more than 1 year, no degree: 184
- Associate degree: 143
- Bachelor's degree: 265
- Master's degree: 73
- Professional school degree: 30
- Doctorate degree: 6

Education attainment for females 25 years and older:
- No schooling: 18
- Nursery to 4th grade: 29
- 5th and 6th grade: 0
- 7th and 8th grade: 61
- 9th grade: 29
- 10th grade: 65
- 11th grade: 41
- 12th grade, no diploma: 50
- High school graduate (or equivalency): 692
- Less than 1 year of college: 111
- Some college more than 1 year, no degree: 272
- Associate degree: 250
- Bachelor's degree: 329
- Master's degree: 121
- Professional school degree: 35
- Doctorate degree: 30

Housing units in structures:
- One, detached: 1,904
- One, attached: 24
- Two: 64
- 3 or 4: 217
- 5 to 9: 179
- 10 to 19: 299
- 20 to 49: 60
- 50 or more: 7
- Mobile homes: 53
Housing units lacking complete kitchen facilities in 2022: 1.3%
House/condo owner moved in on average 15 years ago
Renter moved in on average 5 years ago


- 58.5%Electricity
- 26.4%Utility gas
- 10.8%Fuel oil, kerosene, etc.
- 3.5%Wood
- 0.8%Bottled, tank, or LP gas

- 64.7%Electricity
- 28.1%Utility gas
- 4.2%Wood
- 1.9%Fuel oil, kerosene, etc.
- 1.2%Bottled, tank, or LP gas
Private vs. public school enrollment:
| Here: | 9.4% |
| Virginia: | 13.2% |
| Here: | 18.9% |
| Virginia: | 10.2% |
| Here: | 9.2% |
| Virginia: | 18.7% |


