Mechanicstown, NY (New York) Houses and Residents
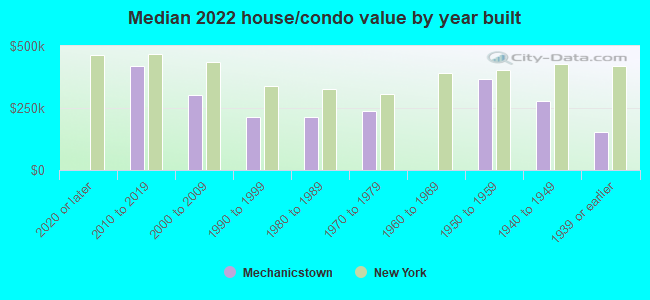
| Mechanicstown: | $270,175 |
| New York: | $400,400 |
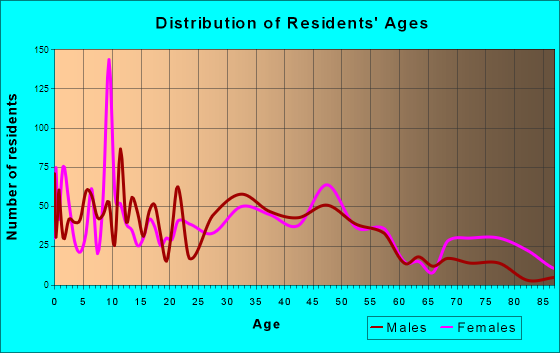
Total population: 6,858 (Urban population: 6,146, Rural population: 0)
Houses: 3,745 (3,562 occupied: 1,777 owner occupied, 1,838 renter occupied)
| % of renters here: | 51% |
| State: | 46% |
Housing density: 1,126 houses/condos per square mile
Median price asked for vacant for-sale houses and condos in 2022 in this county: $283,793.
Median contract rent in 2022: $1,457 (lower quartile is $1,076, upper quartile is $1,812)
Median rent asked for vacant for-rent units in 2022: $6,632
Median gross rent in Mechanicstown, NY in 2022: $1,534
Housing units in Mechanicstown with a mortgage: 1,156 (87 second mortgage, 0 home equity loan, 89 both second mortgage and home equity loan)
Houses without a mortgage: 24
Median household income for houses/condos with a mortgage: $108,912
Median household income for apartments without a mortgage: $64,055
Median monthly housing costs: $1,460
Compare current foreclosures near Mechanicstown, NY:
| Photo | Address | Area | Beds / Baths | Price | Details |
|---|---|---|---|---|---|

|
#1
Phlox Ter
Glenwood, NJ 07418
|
2,448 sq. feet
|
2 baths 3 beds |
$374,900
|
show details |

|
#2
State St
Middletown, NY 10940
|
1,000 sq. feet
|
1 baths 3 beds |
$365,000
|
show details |

|
#3
Maiden Ln
Maybrook, NY 12543
|
770 sq. feet
|
1 baths 2 beds |
$345,000
|
show details |

|
#4
Lake Shore Dr E
Rock Hill, NY 12775
|
2,820 sq. feet
|
3 baths 4 beds |
$439,900
|
show details |

|
#5
Orchard St
Walden, NY 12586
|
1,236 sq. feet
|
1 baths 2 beds |
$89,900
|
show details |

|
#6
Wickham Dr
Warwick, NY 10990
|
925 sq. feet
|
1 baths 3 beds |
show details | |

|
#7
Dolsontown Rd
Middletown, NY 10940
|
- sq. feet
|
1 baths 2 beds |
show details | |

|
#8
Wedgewood Dr
Goshen, NY 10924
|
1,284 sq. feet
|
1 baths 3 beds |
show details | |

|
#9
Rd B
Cragsmoor, NY 12420
|
960 sq. feet
|
1 baths 3 beds |
show details | |

|
#10
River Rd
Walden, NY 12586
|
2,534 sq. feet
|
3 baths 3 beds |
show details |
| Photo | Address | Area | Beds / Baths | Price | Details |
|---|---|---|---|---|---|

|
#11
Scotchtown Collabar Rd
Middletown, NY 10941
|
2,887 sq. feet
|
3 baths 4 beds |
show details | |

|
#12
Howard Dr
Middletown, NY 10941
|
1,892 sq. feet
|
2 baths 3 beds |
show details | |

|
#13
Lincoln Dr
Washingtonville, NY 10992
|
960 sq. feet
|
1 baths 3 beds |
show details | |

|
#14
Sagamore Dr
Otisville, NY 10963
|
1,710 sq. feet
|
1 baths 3 beds |
show details | |

|
#15
Birch St
Bloomingburg, NY 12721
|
2,604 sq. feet
|
2 baths 5 beds |
show details | |

|
#16
St Andrews Ct
Middletown, NY 10941
|
- sq. feet
|
3 baths 4 beds |
show details | |

|
#17
Oakland Ave
Central Valley, NY 10917
|
1,904 sq. feet
|
2 baths 4 beds |
show details | |

|
#18
Woodlake Dr
Middletown, NY 10940
|
1,460 sq. feet
|
1 baths 2 beds |
show details | |

|
#19
Pickerel Rd
Monroe, NY 10950
|
2,092 sq. feet
|
1 baths 2 beds |
show details | |

|
#20
Ferguson Ln
Wurtsboro, NY 12790
|
- sq. feet
|
- baths - beds |
$36,900
|
show details |
| Photo | Address | Area | Beds / Baths | Price | Details |
|---|---|---|---|---|---|

|
#21
Alfred Pl
Walden, NY 12586
|
1,544 sq. feet
|
1 baths 3 beds |
show details | |

|
#22
Edgewood Trl
Monroe, NY 10950
|
916 sq. feet
|
2 baths 2 beds |
show details | |

|
#23
Thompson St
Port Jervis, NY 12771
|
1,200 sq. feet
|
1 baths 3 beds |
show details | |

|
#24
Arden Ct # 2203
Middletown, NY 10940
|
2,028 sq. feet
|
2 baths 3 beds |
show details | |

|
#25
Sarine Rd
Wurtsboro, NY 12790
|
1,657 sq. feet
|
2 baths 4 beds |
show details | |

|
#26
Jonathan Ct
Warwick, NY 10990
|
2,278 sq. feet
|
2 baths 3 beds |
show details | |

|
#27
Capron St
Walden, NY 12586
|
1,464 sq. feet
|
2 baths 3 beds |
show details | |

|
#28
Twin Island Cir
Walden, NY 12586
|
2,188 sq. feet
|
2 baths 3 beds |
show details | |

|
#29
State Route 52
Pine Bush, NY 12566
|
2,645 sq. feet
|
2 baths 2 beds |
show details | |

|
#30
Schubert Dr
Pine Bush, NY 12566
|
1,362 sq. feet
|
1 baths 3 beds |
show details |
| Photo | Address | Area | Beds / Baths | Price | Details |
|---|---|---|---|---|---|

|
#31
Berkley Ter
Monroe, NY 10950
|
768 sq. feet
|
1 baths 2 beds |
show details | |

|
#32
Canterbury Cir
Washingtonville, NY 10992
|
1,632 sq. feet
|
2 baths 3 beds |
show details | |

|
#33
Cooper Dr
Monroe, NY 10950
|
1,136 sq. feet
|
1 baths 3 beds |
show details | |

|
#34
Vineyard Ln
Washingtonville, NY 10992
|
2,229 sq. feet
|
3 baths 4 beds |
show details | |

|
#35
Ridge Rd
Westtown, NY 10998
|
1,056 sq. feet
|
1 baths 2 beds |
show details | |

|
#36
Alexander Dr
Washingtonville, NY 10992
|
1,896 sq. feet
|
2 baths 3 beds |
show details | |

|
#37
Red Barn Rd
Pine Bush, NY 12566
|
1,120 sq. feet
|
1 baths 2 beds |
show details | |

|
#38
Hickory Ln
Monroe, NY 10950
|
960 sq. feet
|
2 baths 3 beds |
show details | |

|
#39
Bob Cat Rd
Wurtsboro, NY 12790
|
1,728 sq. feet
|
2 baths 3 beds |
show details | |

|
#40
Red Barn Ln
Middletown, NY 10940
|
1,452 sq. feet
|
2 baths 3 beds |
show details |
| Photo | Address | Area | Beds / Baths | Price | Details |
|---|---|---|---|---|---|

|
#41
Hawks Nest Rd
Monroe, NY 10950
|
1,236 sq. feet
|
1 baths 3 beds |
show details | |

|
#42
Pickles Rd
Bloomingburg, NY 12721
|
2,251 sq. feet
|
2 baths 3 beds |
show details | |

|
#43
Rakov Rd
Maybrook, NY 12543
|
1,324 sq. feet
|
1 baths 3 beds |
show details | |

|
#44
Watts Ln
Maybrook, NY 12543
|
1,400 sq. feet
|
1 baths 3 beds |
show details | |

|
#45
Marc Ln
Wurtsboro, NY 12790
|
1,008 sq. feet
|
2 baths 3 beds |
show details | |

|
#46
Adams Dr
Maybrook, NY 12543
|
2,032 sq. feet
|
2 baths 4 beds |
show details | |

|
#47
Coppergate Ln
Warwick, NY 10990
|
4,053 sq. feet
|
2 baths 5 beds |
show details | |

|
#48
Gillespie St
Pine Bush, NY 12566
|
2,262 sq. feet
|
4 baths 3 beds |
show details | |

|
#49
Parnell Dr
Warwick, NY 10990
|
1,697 sq. feet
|
4 baths 6 beds |
show details | |

|
Check over 1 million property listings on Foreclosure.com!
|
browse all offers | |||


 | Trump: Upstate New Yorkers Should Move Away & Leave Homes Behind (64 replies) |
| No hudson sub section? Got? About towns north of nyack. (10 replies) |
| Upper Middle class african-american communities in ny (2038 replies) |
| Middletown, NY... any potential? or just a depressed city? (21 replies) |
| Middletown-advice Needed Please (34 replies) |
Median year apartment built: 1997
Household type by relationship:
Households: 8,721- Male householders: 1,678 (548 living alone), Female householders: 1,859 (769 living alone)
1,344 spouses (1,332 opposite-sex spouses), 197 unmarried partners, (197 opposite-sex unmarried partners), 2,555 children (2,528 natural, 20 adopted, 7 stepchildren), 174 grandchildren, 134 brothers or sisters, 75 parents, 0 foster children, 227 other relatives, 259 non-relatives
- In group quarters: 214
Size of family households: 759 2-persons, 530 3-persons, 490 4-persons, 160 5-persons, 95 6-persons.
Size of nonfamily households: 1,330 1-person, 137 2-persons, 64 4-persons.
920 married couples with children.
587 single-parent households (211 men, 376 women).
71.0% of residents of Mechanicstown speak English at home.
22.7% of residents speak Spanish at home (56% speak English very well, 11% speak English well, 10% speak English not well, 22% don't speak English at all).
4.6% of residents speak other Indo-European language at home (59% speak English very well, 27% speak English well, 13% speak English not well).
1.6% of residents speak Asian or Pacific Island language at home (80% speak English very well, 20% don't speak English at all).
2.7% of residents speak other language at home (39% speak English very well, 61% speak English not well).
Foreign born population: 2,143 (24.6%)
(44.8% of them are naturalized citizens)
| Here: | 5.8 |
| State: | 6.3 |
| Here: | 4.1 |
| State: | 3.8 |
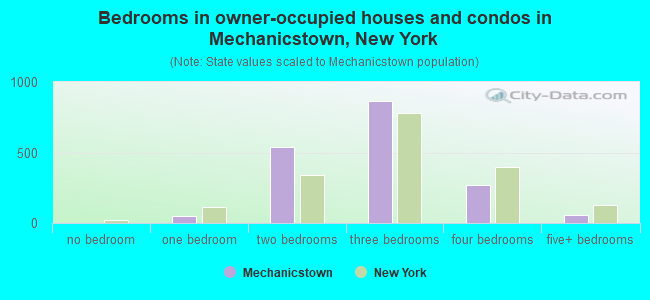
- Bedrooms in owner-occupied houses and condos in Mechanicstown, New York
- 0no bedroom
- 511 bedroom
- 5362 bedrooms
- 8653 bedrooms
- 2674 bedrooms
- 605+ bedrooms
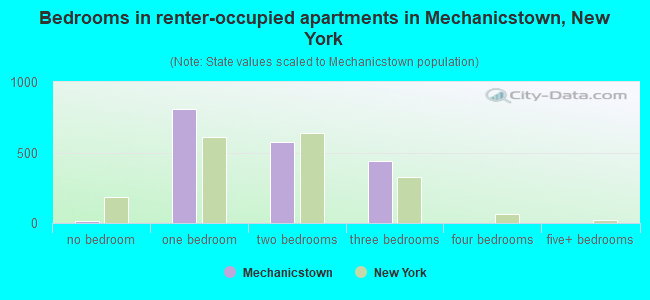
- Bedrooms in renter-occupied apartments in Mechanicstown, New York
- 17no bedroom
- 8121 bedroom
- 5722 bedrooms
- 4383 bedrooms
- 04 bedrooms
- 05+ bedrooms
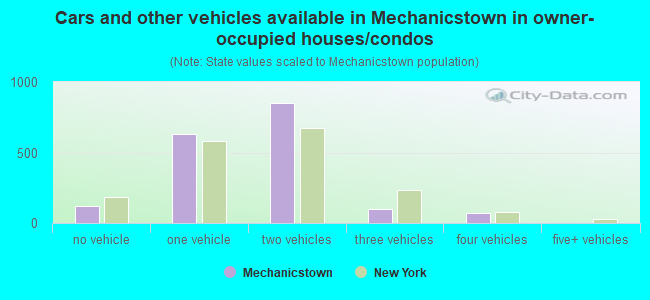
- Cars and other vehicles available in Mechanicstown in owner-occupied houses/condos
- 121no vehicle
- 6331 vehicle
- 8502 vehicles
- 1023 vehicles
- 714 vehicles
- 05+ vehicles
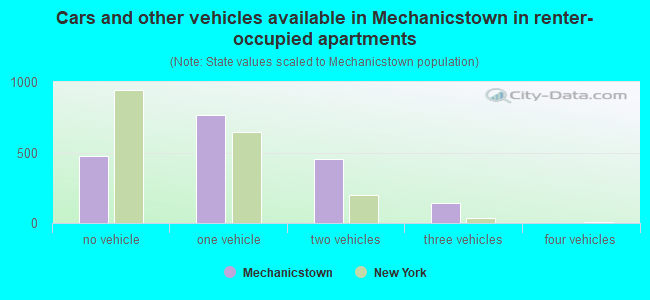
- Cars and other vehicles available in Mechanicstown in renter-occupied apartments
- 474no vehicle
- 7681 vehicle
- 4542 vehicles
- 1433 vehicles
- 04 vehicles
- 05+ vehicles
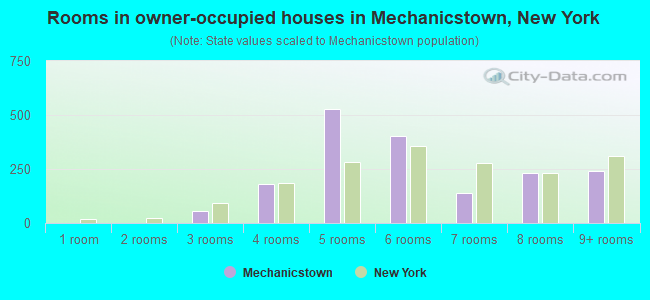
- Rooms in owner-occupied houses in Mechanicstown, New York
- 01 room
- 02 rooms
- 553 rooms
- 1804 rooms
- 5285 rooms
- 4026 rooms
- 1397 rooms
- 2328 rooms
- 2429+ rooms
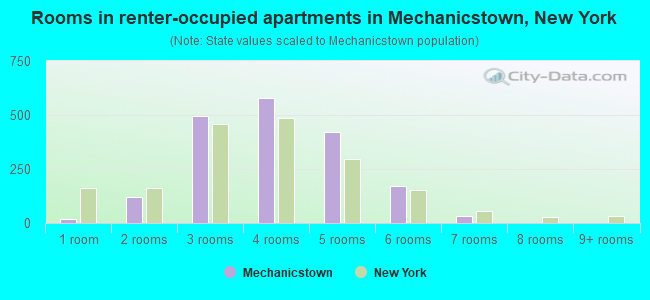
- Rooms in renter-occupied apartments in Mechanicstown, New York
- 171 room
- 1212 rooms
- 4973 rooms
- 5784 rooms
- 4225 rooms
- 1726 rooms
- 327 rooms
- 08 rooms
- 09+ rooms
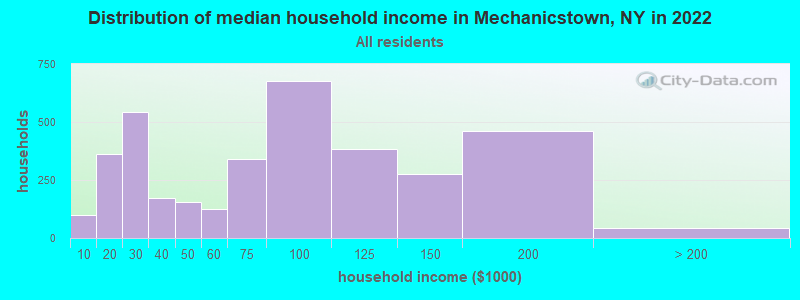
Mechanicstown, NY household income distribution

- 101Less than $10,000
- 360$10,000 to $19,999
- 542$20,000 to $29,999
- 173$30,000 to $39,999
- 156$40,000 to $49,999
- 127$50,000 to $59,999
- 339$60,000 to $74,999
- 677$75,000 to $99,999
- 383$100,000 to $124,999
- 275$125,000 to $149,999
- 462$150,000 to $199,999
- 44$200,000 or more
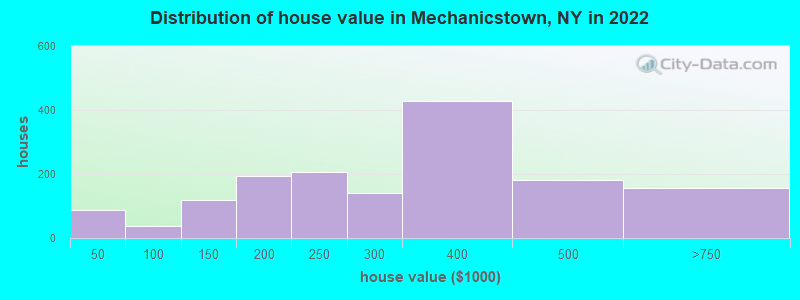
Home value of owner - occupied houses in 2022 in Mechanicstown, NY
-
- 54Less than $10,000
- 8$20,000 to $24,999
- 24$25,000 to $29,999
- 19$70,000 to $79,999
- 16$80,000 to $89,999
- 74$100,000 to $124,999
- 44$125,000 to $149,999
- 100$150,000 to $174,999
- 94$175,000 to $199,999
- 206$200,000 to $249,999
- 141$250,000 to $299,999
- 426$300,000 to $399,999
- 182$400,000 to $499,999
- 156$500,000 to $749,999
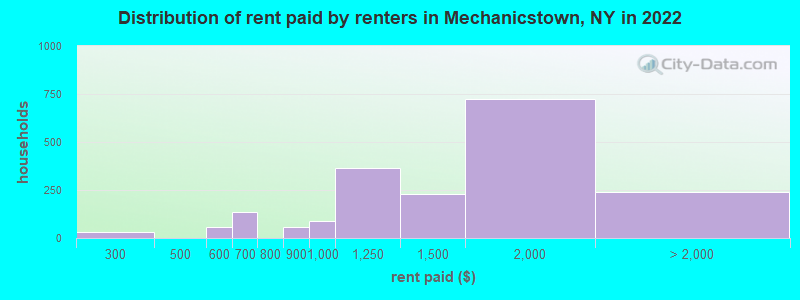
Rent paid by renters in 2022 in Mechanicstown, NY
-
- 11$200 to $249
- 18$250 to $299
- 12$500 to $549
- 44$550 to $599
- 28$600 to $649
- 104$650 to $699
- 59$800 to $899
- 88$900 to $999
- 363$1,000 to $1,249
- 228$1,250 to $1,499
- 722$1,500 to $1,999
- 184$2,000 to $2,499
- 17$2,500 to $2,999
- 36No cash rent
Percentage of workers working in this county: 68.7%
Number of people working at home: 207 (6.1% of all workers)
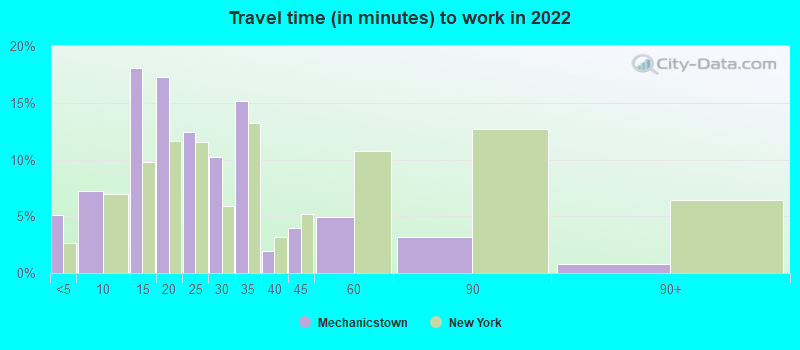
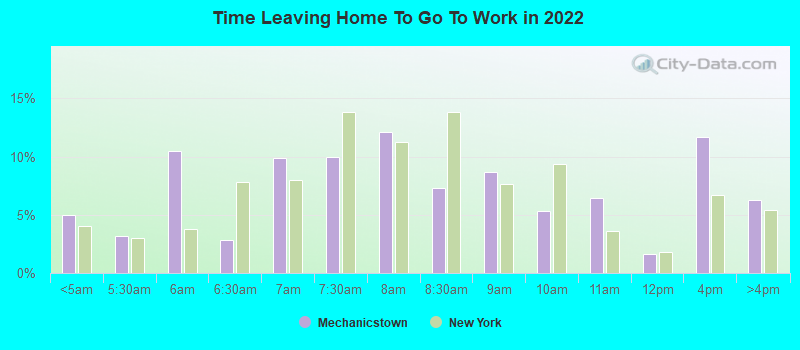
Travel time to work (commute)
- Less than 5 minutes: 25
- 5 to 9 minutes: 430
- 10 to 14 minutes: 285
- 15 to 19 minutes: 548
- 20 to 24 minutes: 550
- 25 to 29 minutes: 114
- 30 to 34 minutes: 167
- 35 to 39 minutes: 128
- 40 to 44 minutes: 27
- 45 to 59 minutes: 215
- 60 to 89 minutes: 269
- 90 or more minutes: 397
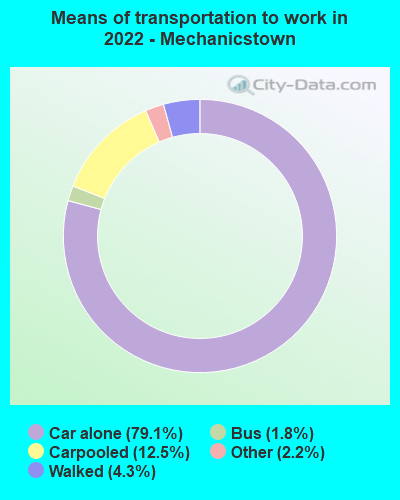
Means of transportation to work:
- Drove a car alone: 2,745 (71.0%)
- Carpooled: 543 (14.0%)
- Bus: 81 (2.1%)
- Taxi: 95 (2.5%)
- Walked: 167 (4.3%)
- Worked at home: 207 (5.4%)
- Unemployment by race in 2022
- Unemployment rate for White non-Hispanic residents
- 1.9%Males
- 7.7%Females
- Unemployment rate for Black residents
- 14.7%Males
- 14.4%Females
- Unemployment rate for other race residents
- 18.9%Males
- 8.2%Females
- Unemployment rate for Hispanic or Latino residents
- 19.4%Males
- 10.2%Females
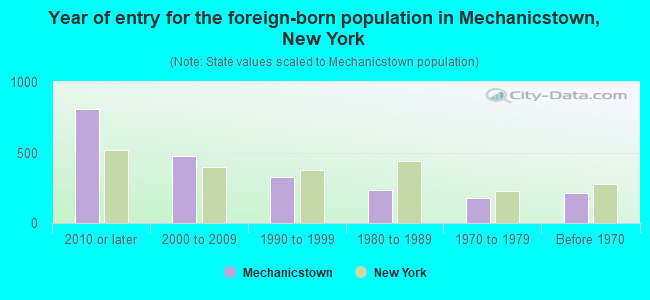
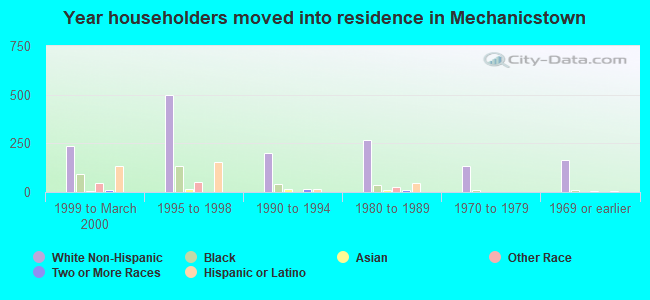
- Year of entry for the foreign-born population in Mechanicstown, New York
- 8112010 or later
- 4732000 to 2009
- 3251990 to 1999
- 2331980 to 1989
- 1751970 to 1979
- 216Before 1970
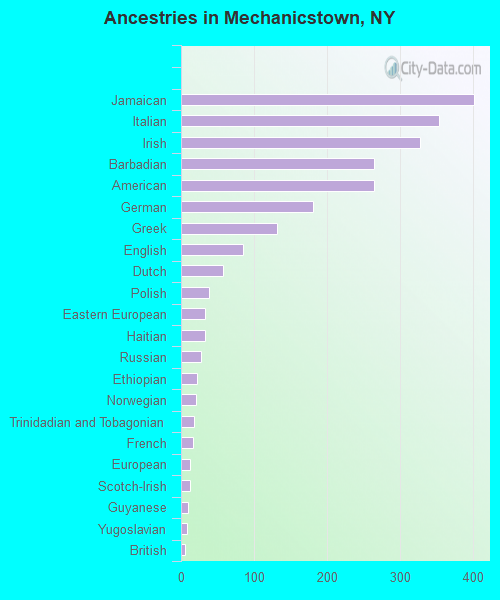
First ancestries reported:
- Jamaican: 402 (8.7%)
- Italian: 353 (7.6%)
- Irish: 328 (7.1%)
- Barbadian: 265 (5.7%)
- American: 264 (5.7%)
- German: 181 (3.9%)
- Greek: 131 (2.8%)
- English: 85 (1.8%)
- Dutch: 58 (1.3%)
- Polish: 39 (0.8%)
- Eastern European: 33 (0.7%)
- Haitian: 33 (0.7%)
- Russian: 27 (0.6%)
- Ethiopian: 22 (0.5%)
- Norwegian: 20 (0.4%)
- Trinidadian and Tobagonian: 18 (0.4%)
- French: 16 (0.3%)
- European: 13 (0.3%)
- Scotch-Irish: 13 (0.3%)
- Guyanese: 10 (0.2%)
- Yugoslavian: 8 (0.2%)
- British: 5 (0.1%)
Most common places of birth for foreign-born residents (%):
| Mechanicstown: | 17.8% (347) |
| New York: | 4.8% (214,559) |
| Mechanicstown: | 16.8% (326) |
| New York: | 5.0% (227,557) |
| Mechanicstown: | 13.5% (263) |
| New York: | 11.1% (501,040) |
| Mechanicstown: | 7.3% (142) |
| New York: | 0.6% (28,604) |
| Mechanicstown: | 6.9% (135) |
| New York: | 3.5% (158,432) |
| Mechanicstown: | 5.4% (105) |
| New York: | 2.5% (111,920) |
| Mechanicstown: | 5.0% (97) |
| New York: | 0.6% (25,124) |
| Mechanicstown: | 4.9% (96) |
| New York: | 1.4% (61,245) |
| Mechanicstown: | 3.2% (63) |
| New York: | 9.1% (410,910) |
| Mechanicstown: | 2.7% (53) |
| New York: | 2.8% (126,936) |
| Mechanicstown: | 2.5% (49) |
| New York: | 2.6% (117,288) |
| Mechanicstown: | 2.2% (43) |
| New York: | 2.4% (108,067) |
| Mechanicstown: | 1.9% (36) |
| New York: | 0.5% (23,242) |
| Mechanicstown: | 1.5% (30) |
| New York: | 0.5% (23,058) |
Place of birth for U.S.-born residents:
- This state: 5,907
- Other state: 591
- Northeast: 316
- Midwest: 67
- South: 118
- West: 84
93.0% of Mechanicstown residents lived in the same house 1 years ago.
Out of people who lived in different houses, 36.5% lived in this county.
Out of people who lived in different counties, 73.3% lived in New York.
| Mechanicstown: | 93.0% |
| State average: | 89.6% |
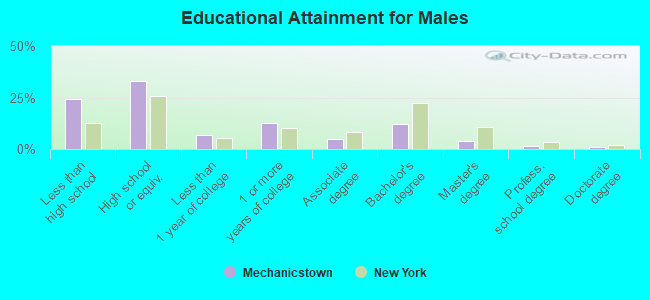
Education attainment for males 25 years and older:
- No schooling: 37
- Nursery to 4th grade: 6
- 5th and 6th grade: 8
- 7th and 8th grade: 162
- 9th grade: 39
- 10th grade: 122
- 11th grade: 214
- 12th grade, no diploma: 83
- High school graduate (or equivalency): 907
- Less than 1 year of college: 182
- Some college more than 1 year, no degree: 352
- Associate degree: 136
- Bachelor's degree: 340
- Master's degree: 107
- Professional school degree: 43
- Doctorate degree: 22
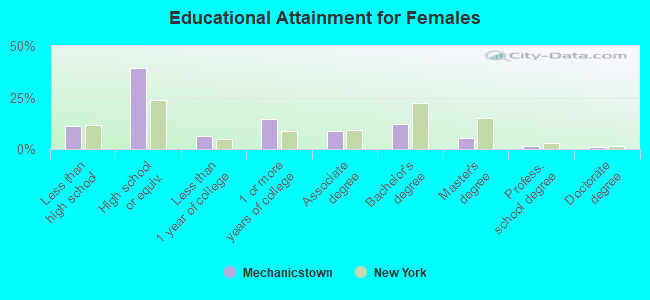
Education attainment for females 25 years and older:
- No schooling: 59
- Nursery to 4th grade: 11
- 5th and 6th grade: 19
- 7th and 8th grade: 29
- 9th grade: 71
- 10th grade: 85
- 11th grade: 82
- 12th grade, no diploma: 17
- High school graduate (or equivalency): 1,297
- Less than 1 year of college: 207
- Some college more than 1 year, no degree: 475
- Associate degree: 293
- Bachelor's degree: 400
- Master's degree: 182
- Professional school degree: 56
- Doctorate degree: 31
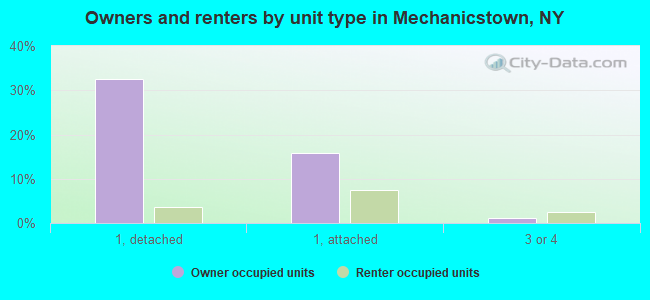
Housing units in structures:
- One, detached: 1,326
- One, attached: 890
- Two: 107
- 3 or 4: 108
- 5 to 9: 597
- 10 to 19: 255
- 20 to 49: 241
- 50 or more: 216
Housing units lacking complete kitchen facilities in 2022: 1.2%
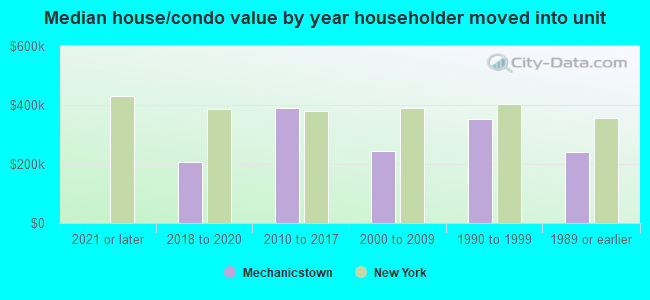
House/condo owner moved in on average 9 years ago
Renter moved in on average 2 years ago
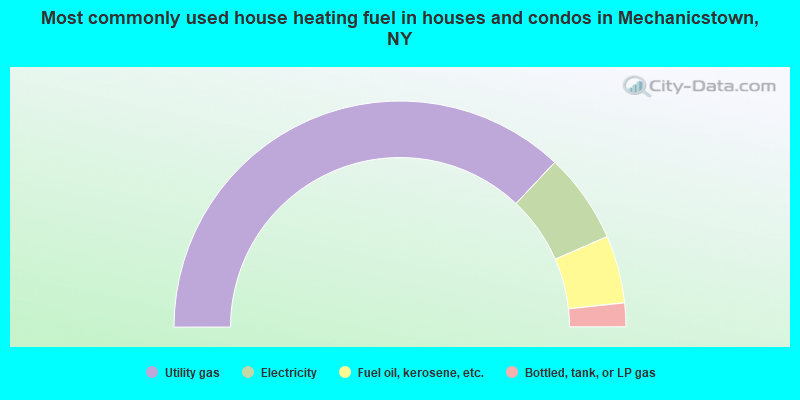
- 74.1%Utility gas
- 12.9%Electricity
- 9.7%Fuel oil, kerosene, etc.
- 3.4%Bottled, tank, or LP gas
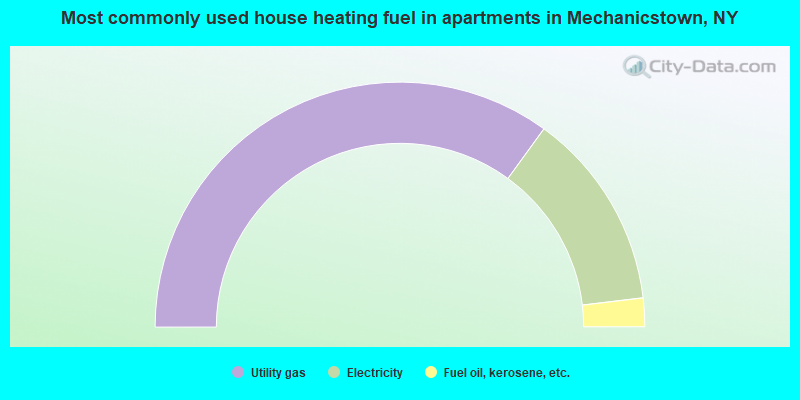
- 70.0%Utility gas
- 26.2%Electricity
- 3.8%Fuel oil, kerosene, etc.
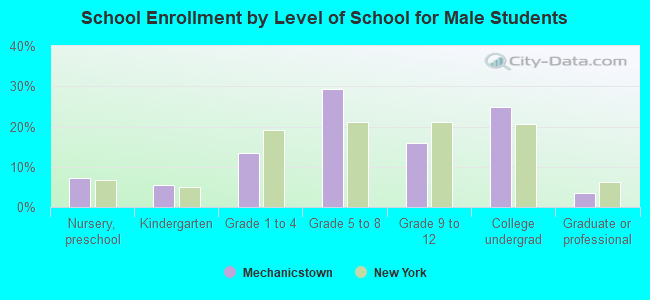
Private vs. public school enrollment:
| Here: | 1.9% |
| New York: | 15.6% |
| Here: | 3.8% |
| New York: | 15.0% |
| Here: | 33.3% |
| New York: | 39.2% |