Merrimac, MA (Massachusetts) Houses and Residents
| Merrimac: | $564,511 |
| Massachusetts: | $534,700 |
Total population: 6,338 (Urban population: 5,146, Rural population: 992 (50 farm, 942 nonfarm))
Houses: 2,295 (2,233 occupied: 1,850 owner occupied, 383 renter occupied)
| % of renters here: | 17% |
| State: | 38% |
Housing density: 269 houses/condos per square mile
Median price asked for vacant for-sale houses and condos in 2022 in this county: $495,592.
Median contract rent in 2022: $1,523 (lower quartile is $848, upper quartile is $1,807)
Median rent asked for vacant for-rent units in 2022: $1,020
Median gross rent in Merrimac, MA in 2022: $1,727
Housing units in Merrimac with a mortgage: 1,202 (129 second mortgage, 157 home equity loan, 0 both second mortgage and home equity loan)
Houses without a mortgage: 255
Compare current foreclosures near Merrimac, MA:
| Photo | Address | Area | Beds / Baths | Price | Details |
|---|---|---|---|---|---|

|
#1
Bear Hill Rd
Merrimac, MA 01860
|
1,304 sq. feet
|
1 baths 3 beds |
show details | |

|
#2
W Main St Apt 214
Merrimac, MA 01860
|
- sq. feet
|
- baths - beds |
show details | |

|
#3
Brentwood Rd
Exeter, NH 03833
|
2,756 sq. feet
|
2 baths 3 beds |
$419,900
|
show details |

|
#4
Cedar St # A
Haverhill, MA 01830
|
1,134 sq. feet
|
2 baths 2 beds |
$209,300
|
show details |

|
#5
Shore Dr
Hampstead, NH 03841
|
787 sq. feet
|
1 baths 2 beds |
$529,900
|
show details |

|
#6
Hemlock Cir
Sandown, NH 03873
|
1,912 sq. feet
|
2 baths 4 beds |
show details | |

|
#7
Mill River Ln
Rowley, MA 01969
|
2,705 sq. feet
|
2 baths 4 beds |
show details | |

|
#8
Byron St
Haverhill, MA 01835
|
2,446 sq. feet
|
2 baths 4 beds |
show details | |

|
#9
Thornton St
Lawrence, MA 01841
|
912 sq. feet
|
1 baths 2 beds |
show details | |

|
#10
Frances Street Aka 57 Francis Street
Haverhill, MA 01830
|
1,280 sq. feet
|
2 baths 3 beds |
show details |
| Photo | Address | Area | Beds / Baths | Price | Details |
|---|---|---|---|---|---|

|
#11
Brook St
Derry, NH 03038
|
1,476 sq. feet
|
2 baths 4 beds |
show details | |

|
#12
Oak Ridge Rd
Plaistow, NH 03865
|
3,089 sq. feet
|
3 baths 5 beds |
show details | |

|
#13
Williamine Dr
Newton, NH 03858
|
2,295 sq. feet
|
1 baths 3 beds |
show details | |

|
#14
Salem St
North Andover, MA 01845
|
1,572 sq. feet
|
1 baths 2 beds |
show details | |

|
#15
Windbrook Dr
Epping, NH 03042
|
1,680 sq. feet
|
1 baths 3 beds |
show details | |

|
#16
Pine Ridge Rd
Windham, NH 03087
|
1,746 sq. feet
|
2 baths 4 beds |
show details | |

|
#17
S Broadway
Lawrence, MA 01843
|
5,706 sq. feet
|
2 baths 6 beds |
show details | |

|
#18
Brookfield St
Lawrence, MA 01843
|
2,878 sq. feet
|
2 baths 6 beds |
show details | |

|
#19
Mile Ln
Ipswich, MA 01938
|
2,240 sq. feet
|
2 baths 3 beds |
show details | |

|
#20
Gage St
Methuen, MA 01844
|
3,197 sq. feet
|
2 baths 3 beds |
show details |
| Photo | Address | Area | Beds / Baths | Price | Details |
|---|---|---|---|---|---|

|
#21
Hallenan Ave
Lawrence, MA 01841
|
1,564 sq. feet
|
1 baths 3 beds |
show details | |

|
#22
Parkview Ave
Salem, NH 03079
|
1,812 sq. feet
|
1 baths 3 beds |
show details | |

|
#23
Lawrence St
Lawrence, MA 01841
|
4,206 sq. feet
|
3 baths 9 beds |
show details | |

|
#24
Lawrence St
Lawrence, MA 01841
|
4,206 sq. feet
|
3 baths 9 beds |
show details | |

|
#25
Phillips Cmn
North Andover, MA 01845
|
1,897 sq. feet
|
2 baths 3 beds |
show details | |

|
#26
Broadway, Apt 1
Methuen, MA 01844
|
2,328 sq. feet
|
4 baths 6 beds |
show details | |

|
#27
Alexander Ave
Salem, NH 03079
|
1,149 sq. feet
|
1 baths 3 beds |
show details | |

|
#28
Beedle Ter
Methuen, MA 01844
|
1,507 sq. feet
|
2 baths 4 beds |
show details | |

|
#29
Marengo St # 4
North Andover, MA 01845
|
1,765 sq. feet
|
3 baths 2 beds |
show details | |

|
#30
Cluff Crossing Rd
Salem, NH 03079
|
1,120 sq. feet
|
2 baths 2 beds |
show details |
| Photo | Address | Area | Beds / Baths | Price | Details |
|---|---|---|---|---|---|

|
#31
Chestnut St
North Andover, MA 01845
|
2,516 sq. feet
|
3 baths 4 beds |
show details | |

|
#32
Maclarnon Rd
Salem, NH 03079
|
2,020 sq. feet
|
1 baths 3 beds |
show details | |

|
#33
Webster St
Salem, NH 03079
|
1,912 sq. feet
|
2 baths 3 beds |
show details | |

|
#34
Atkinson St
Lawrence, MA 01843
|
825 sq. feet
|
2 baths 3 beds |
show details | |

|
#35
Muse Ter
Salem, NH 03079
|
1,024 sq. feet
|
1 baths 3 beds |
show details | |

|
#36
Chester St # 1
Lawrence, MA 01843
|
4,935 sq. feet
|
3 baths 9 beds |
show details | |

|
#37
Samoset Dr
Salem, NH 03079
|
4,816 sq. feet
|
3 baths 3 beds |
show details | |

|
#38
Campo Seco St
Lawrence, MA 01841
|
2,276 sq. feet
|
3 baths 4 beds |
show details | |

|
#39
Dearborn Ave
Hampton, NH 03842
|
1,708 sq. feet
|
1 baths 3 beds |
show details | |

|
#40
Marshall St
Methuen, MA 01844
|
840 sq. feet
|
1 baths 2 beds |
show details |
| Photo | Address | Area | Beds / Baths | Price | Details |
|---|---|---|---|---|---|

|
#41
Comet Rd
Methuen, MA 01844
|
1,640 sq. feet
|
1 baths 3 beds |
show details | |

|
#42
Golf Ave
Methuen, MA 01844
|
2,208 sq. feet
|
1 baths 3 beds |
show details | |

|
#43
64th St
Newburyport, MA 01950
|
1,517 sq. feet
|
2 baths 2 beds |
show details | |

|
#44
Northern Blvd
Newburyport, MA 01950
|
805 sq. feet
|
1 baths 2 beds |
show details | |

|
#45
Lawrence Rd Un 22
Rowley, MA 01969
|
720 sq. feet
|
1 baths 1 beds |
show details | |

|
#46
Ernest Ave Apt 4
Exeter, NH 03833
|
555 sq. feet
|
1 baths 1 beds |
show details | |

|
#47
Riverview Blvd Apt 8-108
Methuen, MA 01844
|
1,303 sq. feet
|
2 baths 2 beds |
show details | |

|
#48
Hamilton Ln
Salem, NH 03079
|
2,818 sq. feet
|
2 baths 4 beds |
show details | |

|
#49
Greendale St
Methuen, MA 01844
|
1,777 sq. feet
|
1 baths 3 beds |
show details | |

|
Check over 1 million property listings on Foreclosure.com!
|
browse all offers | |||
Latest news about housing in Merrimac, MA collected exclusively by city-data.com from local newspapers, TV, and radio stations


Household type by relationship:
Households: 726,687- In family households: 606,990 (122,043 male householders, 65,962 female householders)
136,841 spouses, 221,565 children (210,337 natural, 5,012 adopted, 6,216 stepchildren), 11,988 grandchildren, 7,913 brothers or sisters, 8,558 parents, foster children, 9,566 other relatives, 17,265 non-relatives
- In nonfamily households: 119,697 (41,801 male householders (32,274 living alone)), 56,150 female householders (48,012 living alone)), 21,746 nonrelatives
- In group quarters: 16,472 (6,766 institutionalized population)
125,244 married couples with children.
42,832 single-parent households (7,363 men, 35,469 women).
97.5% of residents of Merrimac speak English at home.
0.5% of residents speak Spanish at home (73% speak English very well, 27% speak English not well).
1.6% of residents speak other Indo-European language at home (84% speak English very well, 16% speak English not well).
0.3% of residents speak Asian or Pacific Island language at home (63% speak English very well, 37% speak English not well).
Foreign born population: 212 (3.1%)
(100.9% of them are naturalized citizens)
| Here: | 6.6 |
| State: | 6.5 |
| Here: | 4.1 |
| State: | 4.0 |

- Bedrooms in owner-occupied houses and condos in Merrimac, Massachusetts
- 0no bedroom
- 501 bedroom
- 5082 bedrooms
- 8703 bedrooms
- 3624 bedrooms
- 605+ bedrooms

- Bedrooms in renter-occupied apartments in Merrimac, Massachusetts
- 8no bedroom
- 1111 bedroom
- 1872 bedrooms
- 593 bedrooms
- 84 bedrooms
- 105+ bedrooms

- Cars and other vehicles available in Merrimac in owner-occupied houses/condos
- 31no vehicle
- 4421 vehicle
- 9522 vehicles
- 3293 vehicles
- 864 vehicles
- 105+ vehicles

- Cars and other vehicles available in Merrimac in renter-occupied apartments
- 78no vehicle
- 2221 vehicle
- 782 vehicles
- 03 vehicles
- 54 vehicles
- 05+ vehicles

- Rooms in owner-occupied houses in Merrimac, Massachusetts
- 01 room
- 02 rooms
- 163 rooms
- 2584 rooms
- 2625 rooms
- 4196 rooms
- 3647 rooms
- 2698 rooms
- 2629+ rooms

- Rooms in renter-occupied apartments in Merrimac, Massachusetts
- 81 room
- 602 rooms
- 383 rooms
- 1264 rooms
- 835 rooms
- 436 rooms
- 87 rooms
- 178 rooms
- 09+ rooms


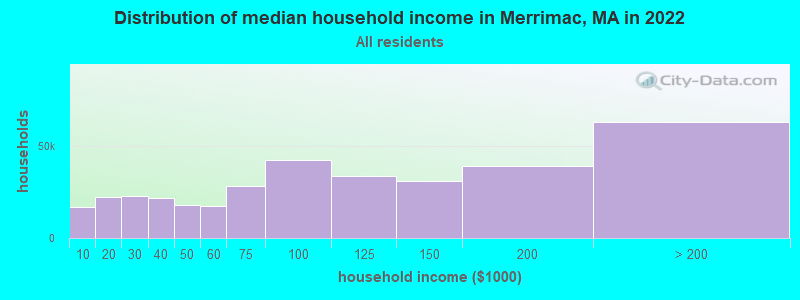
Merrimac, MA household income distribution

- 16,696Less than $10,000
- 22,204$10,000 to $19,999
- 22,891$20,000 to $29,999
- 21,768$30,000 to $39,999
- 18,086$40,000 to $49,999
- 17,534$50,000 to $59,999
- 28,250$60,000 to $74,999
- 42,320$75,000 to $99,999
- 33,773$100,000 to $124,999
- 31,193$125,000 to $149,999
- 39,274$150,000 to $199,999
- 63,338$200,000 or more
Percentage of workers working in this county: 69.4%
Number of people working at home: 661 (16.3% of all workers)
Travel time to work (commute)
- Less than 5 minutes: 78
- 5 to 9 minutes: 237
- 10 to 14 minutes: 329
- 15 to 19 minutes: 668
- 20 to 24 minutes: 435
- 25 to 29 minutes: 201
- 30 to 34 minutes: 317
- 35 to 39 minutes: 146
- 40 to 44 minutes: 158
- 45 to 59 minutes: 298
- 60 to 89 minutes: 317
- 90 or more minutes: 58
Means of transportation to work:
- Drove a car alone: 2,875 (86.2%)
- Carpooled: 262 (7.9%)
- Bus or trolley bus: 22 (0.7%)
- Railroad: 20 (0.6%)
- Walked: 38 (1.1%)
- Other means: 25 (0.7%)
- Worked at home: 92 (2.8%)


- Year of entry for the foreign-born population in Merrimac, Massachusetts
- 51995 to March 2000
- 01990 to 1994
- 01985 to 1989
- 01980 to 1984
- 151975 to 1979
- 151970 to 1974
- 81965 to 1969
- 67Before 1965
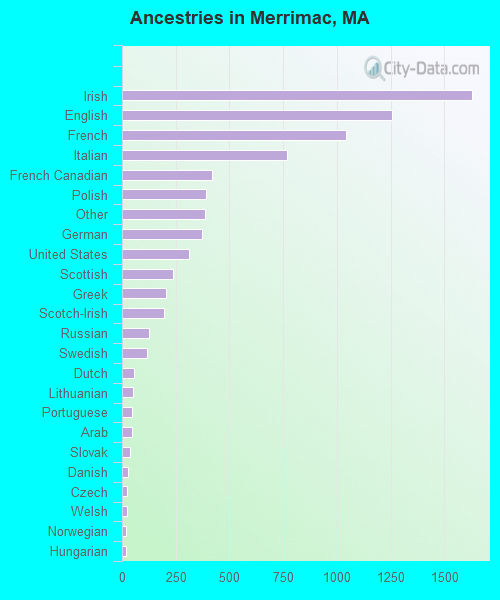
First ancestries reported:
- Irish: 1,626 (20.9%)
- English: 1,256 (16.1%)
- French: 1,044 (13.4%)
- Italian: 766 (9.8%)
- French Canadian: 417 (5.3%)
- Polish: 391 (5.0%)
- Other: 385 (4.9%)
- German: 370 (4.7%)
- United States: 310 (4.0%)
- Scottish: 235 (3.0%)
- Greek: 207 (2.7%)
- Scotch-Irish: 197 (2.5%)
- Russian: 125 (1.6%)
- Swedish: 115 (1.5%)
- Dutch: 57 (0.7%)
- Lithuanian: 50 (0.6%)
- Portuguese: 47 (0.6%)
- Arab: 45 (0.6%)
- Slovak: 35 (0.4%)
- Danish: 26 (0.3%)
- Czech: 24 (0.3%)
- Welsh: 22 (0.3%)
- Norwegian: 19 (0.2%)
- Hungarian: 18 (0.2%)
- Subsaharan African: 9 (0.1%)
Most common places of birth for foreign-born residents (%):
| Merrimac: | 23.6% (26) |
| Massachusetts: | 5.2% (40,247) |
| Merrimac: | 21.8% (24) |
| Massachusetts: | 3.3% (25,403) |
| Merrimac: | 15.5% (17) |
| Massachusetts: | 3.7% (28,319) |
| Merrimac: | 8.2% (9) |
| Massachusetts: | 2.3% (17,987) |
| Merrimac: | 7.3% (8) |
| Massachusetts: | 1.9% (14,883) |
| Merrimac: | 7.3% (8) |
| Massachusetts: | 0.2% (1,303) |
| Merrimac: | 6.4% (7) |
| Massachusetts: | 0.9% (7,258) |
| Merrimac: | 5.5% (6) |
| Massachusetts: | 1.6% (12,350) |
| Merrimac: | 4.5% (5) |
| Massachusetts: | 0.2% (1,729) |
Place of birth for U.S.-born residents:
- This state: 4,874
- Other state: 1,134
- Northeast: 742
- Midwest: 157
- South: 157
- West: 78
65% of Merrimac residents lived in the same house 5 years ago.
Out of people who lived in different houses, 69% lived in this county.
Out of people who lived in different counties, 24% lived in Massachusetts.
Education attainment for males 25 years and older:
- No schooling: 0
- Nursery to 4th grade: 0
- 5th and 6th grade: 12
- 7th and 8th grade: 41
- 9th grade: 33
- 10th grade: 43
- 11th grade: 22
- 12th grade, no diploma: 29
- High school graduate (or equivalency): 614
- Less than 1 year of college: 127
- Some college more than 1 year, no degree: 293
- Associate degree: 119
- Bachelor's degree: 370
- Master's degree: 166
- Professional school degree: 28
- Doctorate degree: 8

Education attainment for females 25 years and older:
- No schooling: 6
- Nursery to 4th grade: 0
- 5th and 6th grade: 30
- 7th and 8th grade: 55
- 9th grade: 35
- 10th grade: 15
- 11th grade: 29
- 12th grade, no diploma: 45
- High school graduate (or equivalency): 606
- Less than 1 year of college: 154
- Some college more than 1 year, no degree: 294
- Associate degree: 199
- Bachelor's degree: 418
- Master's degree: 257
- Professional school degree: 0
- Doctorate degree: 0


Housing units in structures:
- One, detached: 1,485
- One, attached: 129
- Two: 276
- 3 or 4: 51
- 5 to 9: 65
- 10 to 19: 59
- 20 to 49: 30
- Mobile homes: 200
Median worth of mobile homes: $111,611

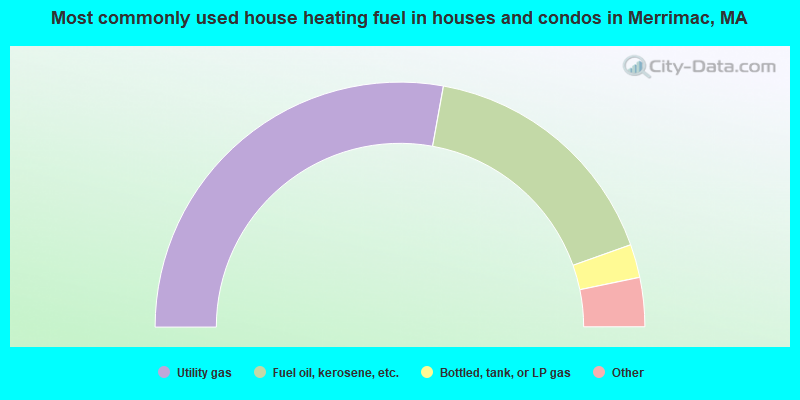
- 55.7%Utility gas
- 33.4%Fuel oil, kerosene, etc.
- 4.4%Bottled, tank, or LP gas
- 3.4%Wood
- 3.1%Electricity
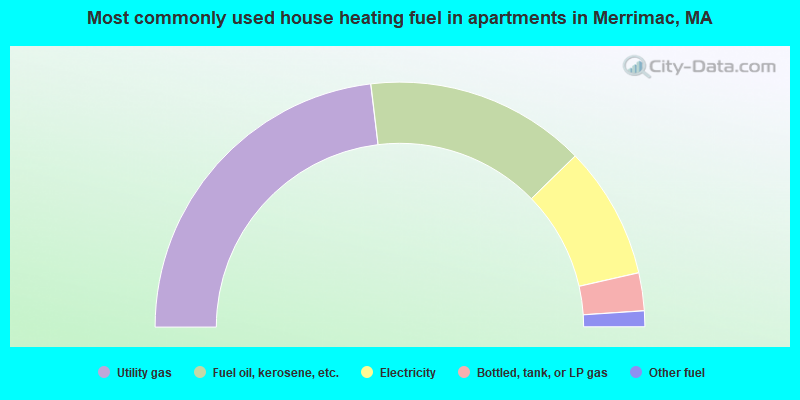
- 46.2%Utility gas
- 29.2%Fuel oil, kerosene, etc.
- 17.5%Electricity
- 5.0%Bottled, tank, or LP gas
- 2.1%Other fuel
Private vs. public school enrollment:
| Here: | 2.0% |
| Massachusetts: | 10.8% |
| Here: | 2.3% |
| Massachusetts: | 12.2% |
| Here: | 26.2% |
| Massachusetts: | 48.2% |


