Morley, MI (Michigan) Houses and Residents
| Morley: | $103,664 |
| Michigan: | $224,400 |
Mean price in 2022:
Detached houses: $118,479
Here: $118,479 State: $280,038 Mobile homes: $50,784
Here: $50,784 State: $72,868
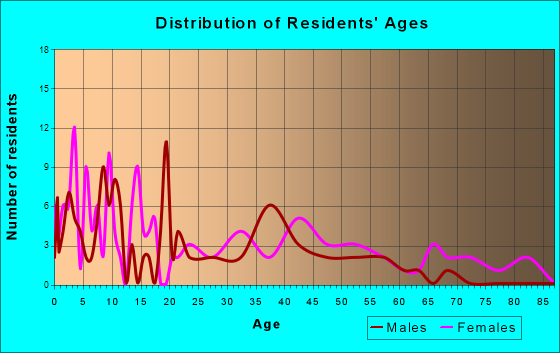
Total population: 499 (Urban population: 0, Rural population: 512 (all nonfarm))
Houses: 244 (237 occupied: 161 owner occupied, 79 renter occupied)
| % of renters here: | 33% |
| State: | 27% |
Housing density: 265 houses/condos per square mile
Median price asked for vacant for-sale houses and condos in 2022 in this county: $82,684.
Median contract rent in 2022: $500 (lower quartile is $464, upper quartile is $699)
Median rent asked for vacant for-rent units in 2022: $484
Median gross rent in Morley, MI in 2022: $845
Housing units in Morley with a mortgage: 73 (0 second mortgage, 0 home equity loan, 0 both second mortgage and home equity loan)
Houses without a mortgage: 0
Median household income for houses/condos with a mortgage: $67,484
Median household income for apartments without a mortgage: $32,244
Median monthly housing costs: $588
Compare current foreclosures near Morley, MI:
| Photo | Address | Area | Beds / Baths | Price | Details |
|---|---|---|---|---|---|

|
#1
Medler Dr
Morley, MI 49336
|
- sq. feet
|
- baths - beds |
show details | |

|
#2
1 Mile Rd
Morley, MI 49336
|
- sq. feet
|
- baths - beds |
show details | |

|
#3
Henkel Rd
Morley, MI 49336
|
- sq. feet
|
- baths - beds |
show details | |

|
#4
3 Mile Rd
Morley, MI 49336
|
- sq. feet
|
- baths - beds |
show details | |

|
#5
180th Ave
Morley, MI 49336
|
- sq. feet
|
- baths - beds |
show details | |

|
#6
Finley Ave
Big Rapids, MI 49307
|
1,122 sq. feet
|
1 baths 2 beds |
show details | |

|
#7
Almy Rd
Howard City, MI 49329
|
1,352 sq. feet
|
2 baths 3 beds |
show details | |

|
#8
E Baseline Rd
White Cloud, MI 49349
|
2,200 sq. feet
|
2 baths 3 beds |
show details | |

|
#9
S Croton Hardy Dr
Newaygo, MI 49337
|
- sq. feet
|
1 baths 1 beds |
show details | |

|
#10
N Elm Ave
White Cloud, MI 49349
|
- sq. feet
|
- baths - beds |
show details |
| Photo | Address | Area | Beds / Baths | Price | Details |
|---|---|---|---|---|---|

|
#11
E 48th St
Newaygo, MI 49337
|
- sq. feet
|
- baths - beds |
show details | |

|
#12
Trail Creek Dr
Stanwood, MI 49346
|
- sq. feet
|
- baths - beds |
show details | |

|
#13
Pierce Rd
Mecosta, MI 49332
|
- sq. feet
|
- baths - beds |
show details | |

|
#14
Thrush Dr
Lakeview, MI 48850
|
- sq. feet
|
- baths - beds |
show details | |

|
#15
Hayes Rd
Big Rapids, MI 49307
|
- sq. feet
|
- baths - beds |
show details | |

|
#16
157th Ave
Big Rapids, MI 49307
|
- sq. feet
|
- baths - beds |
show details | |

|
#17
Heights Circle Dr
Big Rapids, MI 49307
|
- sq. feet
|
- baths - beds |
show details | |

|
#18
12 Mile Rd
Big Rapids, MI 49307
|
- sq. feet
|
- baths - beds |
show details | |

|
#19
Satterlee Rd
Lakeview, MI 48850
|
- sq. feet
|
- baths - beds |
show details | |

|
#20
15 Mile Rd
Big Rapids, MI 49307
|
- sq. feet
|
- baths - beds |
show details |
| Photo | Address | Area | Beds / Baths | Price | Details |
|---|---|---|---|---|---|

|
#21
Nimberger Rd
Lakeview, MI 48850
|
- sq. feet
|
- baths - beds |
show details | |

|
#22
Cheyenne Dr
Howard City, MI 49329
|
- sq. feet
|
- baths - beds |
show details | |

|
#23
Northland Dr # 7
Sand Lake, MI 49343
|
- sq. feet
|
- baths - beds |
show details | |

|
#24
60th Ave
Mecosta, MI 49332
|
- sq. feet
|
- baths - beds |
show details | |

|
#25
Grant St
Howard City, MI 49329
|
- sq. feet
|
- baths - beds |
show details | |

|
#26
S Clark St
Six Lakes, MI 48886
|
- sq. feet
|
- baths - beds |
show details | |

|
#27
Chestnut
Howard City, MI 49329
|
- sq. feet
|
- baths - beds |
show details | |

|
#28
Falcon Dr
Sand Lake, MI 49343
|
- sq. feet
|
- baths - beds |
show details | |

|
#29
Milton Ave Apt 126b
Big Rapids, MI 49307
|
- sq. feet
|
- baths - beds |
show details | |

|
#30
Robin Ct
Big Rapids, MI 49307
|
- sq. feet
|
- baths - beds |
show details |
| Photo | Address | Area | Beds / Baths | Price | Details |
|---|---|---|---|---|---|

|
#31
S Poplar Ave
Newaygo, MI 49337
|
- sq. feet
|
- baths - beds |
show details | |

|
#32
S Michigan Ave
Big Rapids, MI 49307
|
- sq. feet
|
- baths - beds |
show details | |

|
#33
16 Mile Rd
Rodney, MI 49342
|
- sq. feet
|
- baths - beds |
show details | |

|
#34
Penny Ave NE
Cedar Springs, MI 49319
|
- sq. feet
|
- baths - beds |
show details | |

|
#35
Long Rd
Sand Lake, MI 49343
|
- sq. feet
|
- baths - beds |
show details | |

|
#36
W Cannonsville Rd
Lakeview, MI 48850
|
- sq. feet
|
- baths - beds |
show details | |

|
#37
W Almy Rd
Six Lakes, MI 48886
|
- sq. feet
|
- baths - beds |
show details | |

|
#38
S Evergreen Dr
White Cloud, MI 49349
|
- sq. feet
|
- baths - beds |
show details | |

|
#39
Basswood Ave
Newaygo, MI 49337
|
- sq. feet
|
- baths - beds |
show details | |

|
#40
Gravel Ridge Rd
Lakeview, MI 48850
|
- sq. feet
|
- baths - beds |
show details |
| Photo | Address | Area | Beds / Baths | Price | Details |
|---|---|---|---|---|---|

|
#41
Oak Ave
Newaygo, MI 49337
|
- sq. feet
|
- baths - beds |
show details | |

|
#42
Dewey Rd
Howard City, MI 49329
|
- sq. feet
|
- baths - beds |
show details | |

|
#43
Apache Trl
Howard City, MI 49329
|
- sq. feet
|
- baths - beds |
show details | |

|
#44
Cochise Dr
Howard City, MI 49329
|
- sq. feet
|
- baths - beds |
show details | |

|
#45
Newcosta Ave
Newaygo, MI 49337
|
- sq. feet
|
- baths - beds |
show details | |

|
#46
Tamarack Rd
Howard City, MI 49329
|
- sq. feet
|
- baths - beds |
show details | |

|
#47
195th Ave
Stanwood, MI 49346
|
- sq. feet
|
- baths - beds |
show details | |

|
#48
Walnut St
Howard City, MI 49329
|
- sq. feet
|
- baths - beds |
show details | |

|
#49
Church Rd
Howard City, MI 49329
|
- sq. feet
|
- baths - beds |
show details | |

|
Check over 1 million property listings on Foreclosure.com!
|
browse all offers | |||

Latest news about housing in Morley, MI collected exclusively by city-data.com from local newspapers, TV, and radio stations

 | Job Market in GR-outside counties (10 replies) |
| cool things to do places to eat (3 replies) |
| Why are people so proud of Detroit? (60 replies) |
Median year apartment built: 1966
Household type by relationship:
Households: 647- Male householders: 74 (27 living alone), Female householders: 160 (37 living alone)
55 spouses (55 opposite-sex spouses), 49 unmarried partners, (45 opposite-sex unmarried partners), 210 children (199 natural, 0 adopted, 10 stepchildren), 17 grandchildren, 1 brothers or sisters, 7 parents, 0 foster children, 25 other relatives, 41 non-relatives
Size of family households: 35 2-persons, 37 3-persons, 18 4-persons, 24 5-persons, 15 6-persons, 7 7-or-more-persons.
Size of nonfamily households: 68 1-person, 33 2-persons.
51 married couples with children.
111 single-parent households (27 men, 84 women).
94.8% of residents of Morley speak English at home.
3.7% of residents speak Spanish at home (71% speak English very well, 29% speak English well).
0.5% of residents speak other Indo-European language at home (100% speak English very well).
0.2% of residents speak Asian or Pacific Island language at home (100% speak English not well).
Foreign born population: 5 (0.8%)
(60.0% of them are naturalized citizens)
| Here: | 6.0 |
| State: | 6.5 |
| Here: | 5.5 |
| State: | 4.3 |

- Bedrooms in owner-occupied houses and condos in Morley, Michigan
- 0no bedroom
- 81 bedroom
- 622 bedrooms
- 553 bedrooms
- 274 bedrooms
- 95+ bedrooms

- Bedrooms in renter-occupied apartments in Morley, Michigan
- 0no bedroom
- 71 bedroom
- 272 bedrooms
- 383 bedrooms
- 84 bedrooms
- 05+ bedrooms

- Cars and other vehicles available in Morley in owner-occupied houses/condos
- 10no vehicle
- 681 vehicle
- 452 vehicles
- 233 vehicles
- 114 vehicles
- 35+ vehicles

- Cars and other vehicles available in Morley in renter-occupied apartments
- 3no vehicle
- 491 vehicle
- 152 vehicles
- 63 vehicles
- 64 vehicles
- 05+ vehicles

- Rooms in owner-occupied houses in Morley, Michigan
- 01 room
- 02 rooms
- 133 rooms
- 244 rooms
- 335 rooms
- 196 rooms
- 387 rooms
- 128 rooms
- 219+ rooms

- Rooms in renter-occupied apartments in Morley, Michigan
- 01 room
- 02 rooms
- 33 rooms
- 154 rooms
- 185 rooms
- 226 rooms
- 187 rooms
- 28 rooms
- 09+ rooms


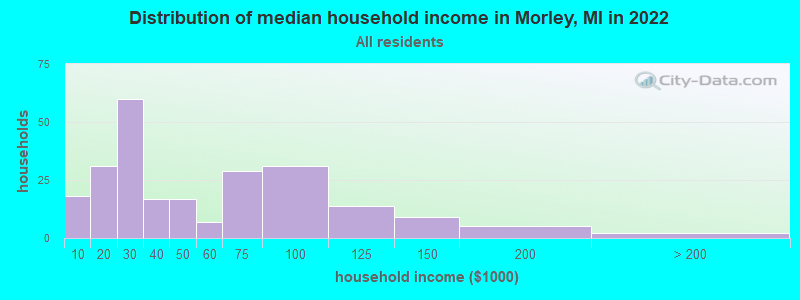
Morley, MI household income distribution

- 18Less than $10,000
- 31$10,000 to $19,999
- 60$20,000 to $29,999
- 17$30,000 to $39,999
- 17$40,000 to $49,999
- 7$50,000 to $59,999
- 29$60,000 to $74,999
- 31$75,000 to $99,999
- 14$100,000 to $124,999
- 9$125,000 to $149,999
- 5$150,000 to $199,999
- 2$200,000 or more
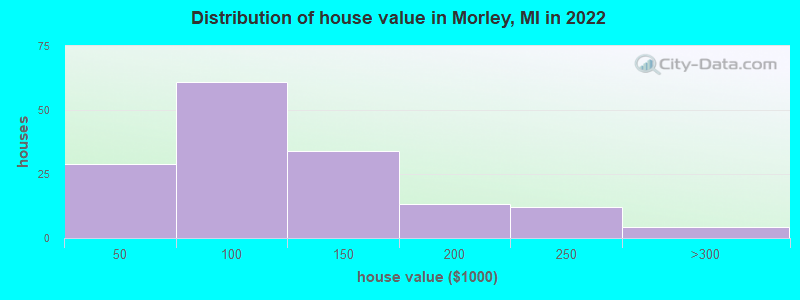
Home value of owner - occupied houses in 2022 in Morley, MI
-
- 0Less than $10,000
- 6$15,000 to $19,999
- 6$30,000 to $34,999
- 6$35,000 to $39,999
- 8$40,000 to $49,999
- 3$50,000 to $59,999
- 14$60,000 to $69,999
- 9$70,000 to $79,999
- 14$80,000 to $89,999
- 9$90,000 to $99,999
- 17$100,000 to $124,999
- 16$125,000 to $149,999
- 11$150,000 to $174,999
- 1$175,000 to $199,999
- 11$200,000 to $249,999
- 4$250,000 to $299,999
Rent paid by renters in 2022 in Morley, MI
-
- 2$200 to $249
- 3$250 to $299
- 6$350 to $399
- 23$450 to $499
- 3$500 to $549
- 5$600 to $649
- 12$650 to $699
- 4$700 to $749
- 2$800 to $899
- 6$1,000 to $1,249
- 2No cash rent


Percentage of workers working in this county: 38.7%
Number of people working at home: 10 (4.7% of all workers)
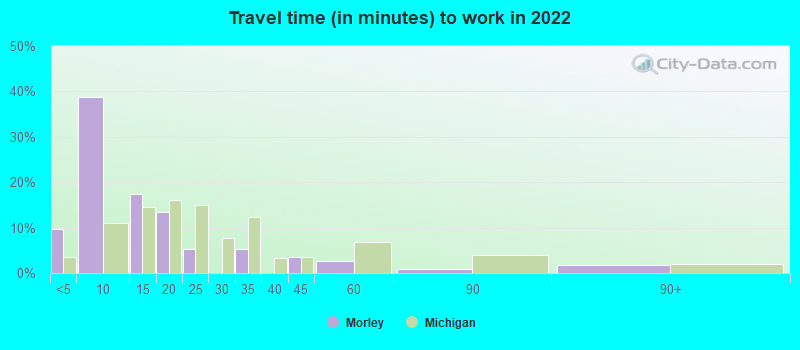
Travel time to work (commute)
- Less than 5 minutes: 9
- 5 to 9 minutes: 22
- 10 to 14 minutes: 10
- 15 to 19 minutes: 32
- 20 to 24 minutes: 23
- 25 to 29 minutes: 11
- 30 to 34 minutes: 16
- 35 to 39 minutes: 10
- 40 to 44 minutes: 18
- 45 to 59 minutes: 22
- 60 to 89 minutes: 12
- 90 or more minutes: 5
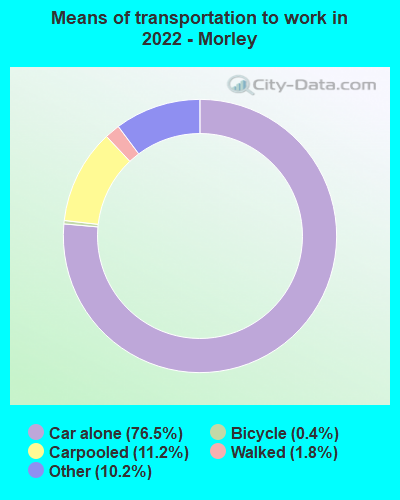
Means of transportation to work:
- Drove a car alone: 208 (69.3%)
- Carpooled: 30 (10.0%)
- Taxi: 36 (12.0%)
- Walked: 4 (1.3%)
- Worked at home: 21 (7.0%)

- Unemployment by race in 2022
- Unemployment rate for White non-Hispanic residents
- 11.8%Males
- 7.9%Females
- Unemployment rate for Black residents
- 100.0%Females
- Unemployment rate for American Indian and Alaska Native residents
- 21.7%Females
- Unemployment rate for Hispanic or Latino residents
- 23.5%Females

- Year of entry for the foreign-born population in Morley, Michigan
- 22010 or later
- 02000 to 2009
- 31990 to 1999
- 21980 to 1989
- 01970 to 1979
- 5Before 1970
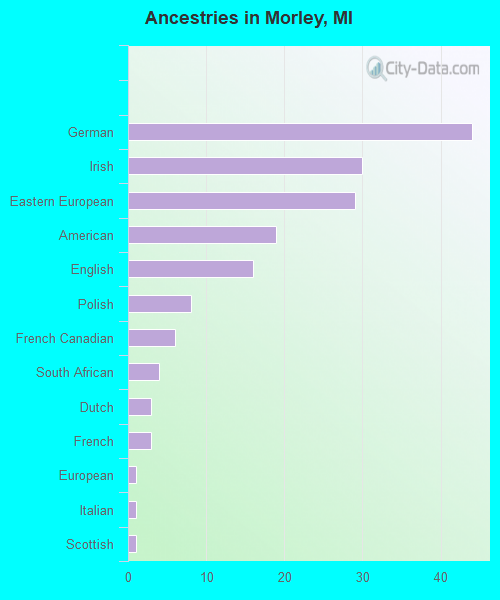
First ancestries reported:
- German: 44 (18.8%)
- Irish: 30 (12.8%)
- Eastern European: 29 (12.4%)
- American: 19 (8.1%)
- English: 16 (6.8%)
- Polish: 8 (3.4%)
- French Canadian: 6 (2.6%)
- South African: 4 (1.7%)
- Dutch: 3 (1.3%)
- French: 3 (1.3%)
- European: 1 (0.4%)
- Italian: 1 (0.4%)
- Scottish: 1 (0.4%)
Most common places of birth for foreign-born residents (%):
| Morley: | 40.0% (2) |
| Michigan: | 0.2% (1,677) |
| Morley: | 20.0% (1) |
| Michigan: | 4.9% (34,295) |
Place of birth for U.S.-born residents:
- This state: 582
- Other state: 44
- Northeast: 2
- Midwest: 9
- South: 29
- West: 3
86.9% of Morley residents lived in the same house 1 years ago.
Out of people who lived in different houses, 13.7% lived in this county.
Out of people who lived in different counties, 100.0% lived in Michigan.
| Morley: | 86.9% |
| State average: | 88.4% |
Education attainment for males 25 years and older:
- No schooling: 9
- Nursery to 4th grade: 0
- 5th and 6th grade: 0
- 7th and 8th grade: 6
- 9th grade: 2
- 10th grade: 13
- 11th grade: 0
- 12th grade, no diploma: 4
- High school graduate (or equivalency): 89
- Less than 1 year of college: 5
- Some college more than 1 year, no degree: 34
- Associate degree: 4
- Bachelor's degree: 14
- Master's degree: 1
- Professional school degree: 0
- Doctorate degree: 0

Education attainment for females 25 years and older:
- No schooling: 2
- Nursery to 4th grade: 0
- 5th and 6th grade: 0
- 7th and 8th grade: 2
- 9th grade: 0
- 10th grade: 7
- 11th grade: 9
- 12th grade, no diploma: 2
- High school graduate (or equivalency): 130
- Less than 1 year of college: 7
- Some college more than 1 year, no degree: 12
- Associate degree: 15
- Bachelor's degree: 28
- Master's degree: 1
- Professional school degree: 0
- Doctorate degree: 0

Housing units in structures:
- One, detached: 207
- 3 or 4: 6
- Mobile homes: 31
Median worth of mobile homes: $48,214
Housing units lacking complete kitchen facilities in 2022: 1.6%
House/condo owner moved in on average 15 years ago
Renter moved in on average 6 years ago

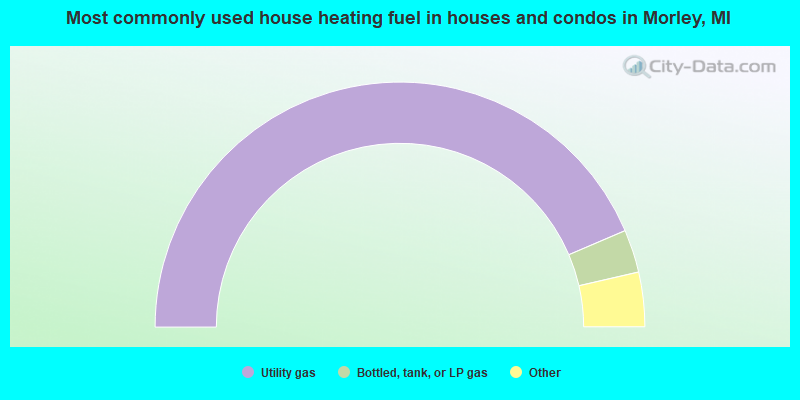
- 87.3%Utility gas
- 5.7%Bottled, tank, or LP gas
- 3.8%Wood
- 1.9%Electricity
- 1.3%Fuel oil, kerosene, etc.
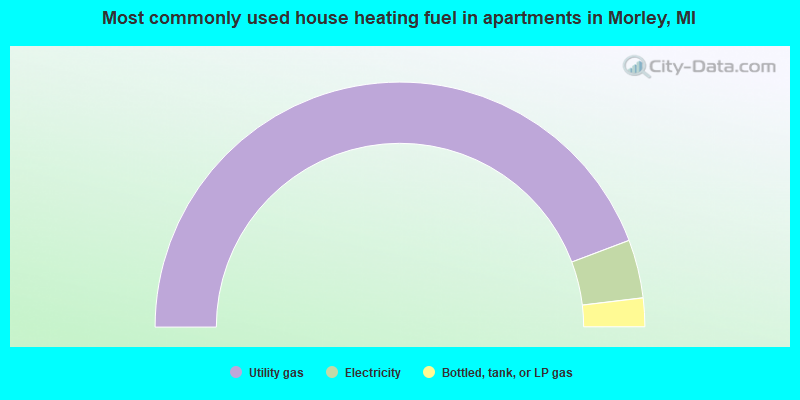
- 88.5%Utility gas
- 7.7%Electricity
- 3.8%Bottled, tank, or LP gas
Private vs. public school enrollment:
| Here: | 13.0% |
| Michigan: | 12.4% |
| Here: | 0.0% |
| Michigan: | 9.8% |
| Here: | 38.5% |
| Michigan: | 14.9% |


