Morristown, TN (Tennessee) Houses and Residents
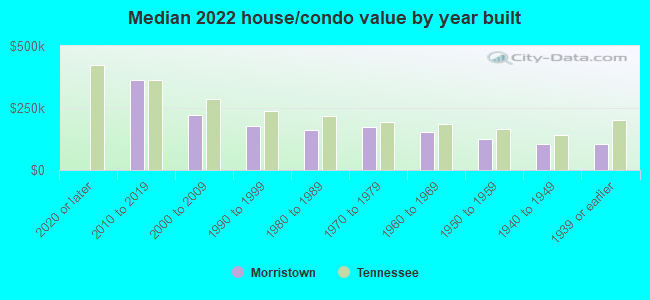
| Morristown: | $167,603 |
| Tennessee: | $284,800 |
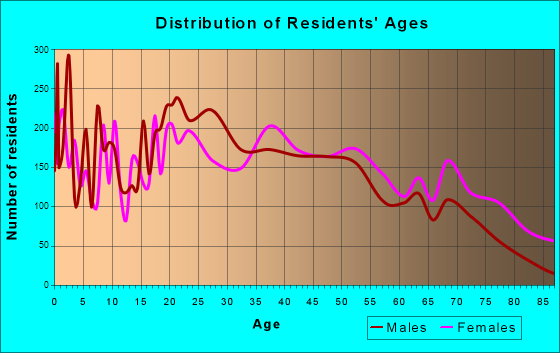
Total population: 29,304 (Urban population: 24,932, Rural population: 350 (16 farm, 334 nonfarm))
Houses: 14,064 (12,596 occupied: 6,597 owner occupied, 6,591 renter occupied)
| % of renters here: | 50% |
| State: | 33% |
Housing density: 673 houses/condos per square mile
Median price asked for vacant for-sale houses and condos in 2022: $167,338.
Median contract rent in 2022: $566 (lower quartile is $446, upper quartile is $710)
Median rent asked for vacant for-rent units in 2022: $834
Median gross rent in Morristown, TN in 2022: $733
Housing units in Morristown with a mortgage: 3,733 (303 second mortgage, 0 home equity loan, 233 both second mortgage and home equity loan)
Houses without a mortgage: 0
Median household income for houses/condos with a mortgage: $80,249
Median household income for apartments without a mortgage: $51,376
Median monthly housing costs: $763
Compare current foreclosures in Morristown, TN:
| Photo | Address | Area | Beds / Baths | Price | Details |
|---|---|---|---|---|---|

|
#1
Rosedale Ave
Morristown, TN 37813
|
792 sq. feet
|
1 baths 2 beds |
$165,000
|
show details |

|
#2
Le Conte St
Morristown, TN 37814
|
2,049 sq. feet
|
2 baths 2 beds |
show details | |

|
#3
Bullard Dr
Morristown, TN 37814
|
1,568 sq. feet
|
2 baths - beds |
show details | |

|
#4
Reese St
Morristown, TN 37814
|
2,064 sq. feet
|
2 baths - beds |
show details | |

|
#5
Spring Creek Dr
Morristown, TN 37814
|
2,480 sq. feet
|
2 baths - beds |
show details | |

|
#6
N Henry St
Morristown, TN 37814
|
1,080 sq. feet
|
2 baths - beds |
show details | |

|
#7
Tracy St
Morristown, TN 37814
|
1,300 sq. feet
|
1 baths - beds |
show details | |

|
#8
Shields Ferry Rd
Morristown, TN 37814
|
756 sq. feet
|
1 baths - beds |
show details | |

|
#9
Rhett Cir
Morristown, TN 37814
|
2,807 sq. feet
|
3 baths - beds |
show details | |

|
#10
Old Kentucky Rd
Morristown, TN 37814
|
1,152 sq. feet
|
1 baths - beds |
show details |
| Photo | Address | Area | Beds / Baths | Price | Details |
|---|---|---|---|---|---|

|
#11
Tom Treece Rd
Morristown, TN 37814
|
1,152 sq. feet
|
2 baths - beds |
show details | |

|
#12
Camilla Ave
Morristown, TN 37814
|
1,767 sq. feet
|
2 baths - beds |
show details | |

|
#13
Lennie Ave
Morristown, TN 37813
|
1,152 sq. feet
|
1 baths - beds |
show details | |

|
#14
Hamilton Pl
Morristown, TN 37814
|
1,956 sq. feet
|
2 baths - beds |
show details | |

|
#15
Amanda Ave
Morristown, TN 37813
|
912 sq. feet
|
1 baths - beds |
show details | |

|
#16
Daniels Dr
Morristown, TN 37813
|
1,484 sq. feet
|
2 baths - beds |
show details | |

|
#17
Jaybird Rd
Morristown, TN 37814
|
1,096 sq. feet
|
1 baths - beds |
show details | |

|
#18
E 2nd North St
Morristown, TN 37814
|
1,275 sq. feet
|
1 baths - beds |
show details | |

|
#19
Hickory Ln
Morristown, TN 37813
|
2,700 sq. feet
|
1 baths - beds |
show details | |

|
#20
Pine Barren Dr
Morristown, TN 37814
|
2,294 sq. feet
|
2 baths - beds |
show details |
| Photo | Address | Area | Beds / Baths | Price | Details |
|---|---|---|---|---|---|

|
#21
Colony Cir
Morristown, TN 37813
|
1,246 sq. feet
|
2 baths - beds |
show details | |

|
#22
Fish Hatchery Rd
Morristown, TN 37813
|
1,304 sq. feet
|
2 baths - beds |
show details | |

|
#23
Springvale Rd
Morristown, TN 37813
|
1,394 sq. feet
|
2 baths - beds |
show details | |

|
#24
Mill Wheel Rd
Morristown, TN 37814
|
1,175 sq. feet
|
1 baths - beds |
show details | |

|
#25
N Circle Dr
Morristown, TN 37813
|
792 sq. feet
|
1 baths - beds |
show details | |

|
#26
Montrose Ave
Morristown, TN 37813
|
672 sq. feet
|
1 baths - beds |
show details | |

|
#27
Lonnie Cir
Morristown, TN 37813
|
1,450 sq. feet
|
2 baths - beds |
show details | |

|
#28
Dandelion Cir
Morristown, TN 37814
|
1,000 sq. feet
|
1 baths - beds |
show details | |

|
#29
Hilltop Dr
Morristown, TN 37814
|
1,050 sq. feet
|
1 baths - beds |
show details | |

|
#30
Pinewood Cir
Morristown, TN 37814
|
2,052 sq. feet
|
2 baths - beds |
show details |
| Photo | Address | Area | Beds / Baths | Price | Details |
|---|---|---|---|---|---|

|
#31
Bethel Rd
Morristown, TN 37813
|
1,782 sq. feet
|
2 baths - beds |
show details | |

|
#32
W 6th North St
Morristown, TN 37814
|
2,112 sq. feet
|
2 baths - beds |
show details | |

|
#33
Blackberry Ln
Morristown, TN 37814
|
1,624 sq. feet
|
2 baths - beds |
show details | |

|
#34
Horseshoe Trl
Morristown, TN 37814
|
2,536 sq. feet
|
3 baths - beds |
show details | |

|
#35
Sublett Rd
Morristown, TN 37813
|
1,464 sq. feet
|
2 baths - beds |
show details | |

|
#36
Carriger St
Morristown, TN 37814
|
750 sq. feet
|
1 baths - beds |
show details | |

|
#37
Spring Hollow Dr
Morristown, TN 37814
|
1,680 sq. feet
|
2 baths - beds |
show details | |

|
#38
Madison St
Morristown, TN 37814
|
768 sq. feet
|
1 baths - beds |
show details | |

|
#39
Baker St
Morristown, TN 37813
|
700 sq. feet
|
1 baths - beds |
show details | |

|
#40
Corbin Dr
Morristown, TN 37814
|
1,350 sq. feet
|
1 baths - beds |
show details |
| Photo | Address | Area | Beds / Baths | Price | Details |
|---|---|---|---|---|---|

|
#41
Musick Rd
Morristown, TN 37814
|
986 sq. feet
|
1 baths - beds |
show details | |

|
#42
Cline Ave
Morristown, TN 37814
|
1,886 sq. feet
|
2 baths - beds |
show details | |

|
#43
Union Ave
Morristown, TN 37813
|
949 sq. feet
|
1 baths - beds |
show details | |

|
#44
Misty Hill Ln
Morristown, TN 37814
|
1,755 sq. feet
|
2 baths - beds |
show details | |

|
#45
Cain Ave
Morristown, TN 37813
|
1,008 sq. feet
|
1 baths - beds |
show details | |

|
#46
Halifax Cir
Morristown, TN 37813
|
1,834 sq. feet
|
1 baths - beds |
show details | |

|
#47
Landmark Dr
Morristown, TN 37814
|
2,996 sq. feet
|
2 baths - beds |
show details | |

|
#48
Hoover Dr
Morristown, TN 37814
|
1,421 sq. feet
|
3 baths - beds |
show details | |

|
#49
Fairfax Cir
Morristown, TN 37814
|
2,023 sq. feet
|
1 baths - beds |
show details | |

|
Check over 1 million property listings on Foreclosure.com!
|
browse all offers | |||

Latest news about housing in Morristown, TN collected exclusively by city-data.com from local newspapers, TV, and radio stations

 | WSJ: Johnson City #3 housing market in nation. (49 replies) |
| Looking for home in eastern Tennessee - Johnson City, Greeneville, etc. (13 replies) |
| Where homes are being built (31 replies) |
| Can you tell me about Morristown, Bean Station, etc? (3 replies) |
| Cookeville developments and rumors (1035 replies) |
| Igor Blevin's, "A Native Californian in Knoxville" (220 replies) |
Median year apartment built: 1983
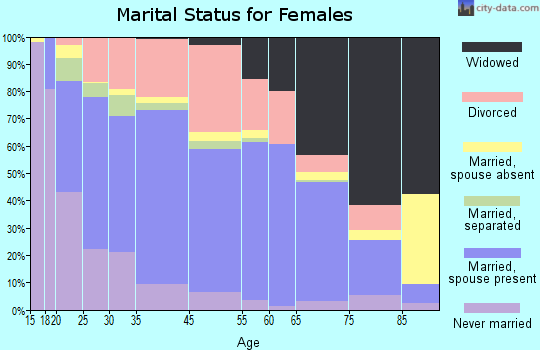
Household type by relationship:
Households: 30,875- Male householders: 5,825 (1,773 living alone), Female householders: 6,612 (2,498 living alone)
4,253 spouses (4,234 opposite-sex spouses), 908 unmarried partners, (773 opposite-sex unmarried partners), 9,076 children (8,729 natural, 78 adopted, 268 stepchildren), 986 grandchildren, 407 brothers or sisters, 211 parents, 0 foster children, 458 other relatives, 1,319 non-relatives
- In group quarters: 813
Size of family households: 3,117 2-persons, 2,325 3-persons, 1,822 4-persons, 903 5-persons, 40 6-persons, 153 7-or-more-persons.
Size of nonfamily households: 3,307 1-person, 678 2-persons, 450 3-persons, 53 4-persons, 37 5-persons, 45 6-persons.
3,630 married couples with children.
3,135 single-parent households (894 men, 2,241 women).
80.8% of residents of Morristown speak English at home.
17.2% of residents speak Spanish at home (50% speak English very well, 17% speak English well, 24% speak English not well, 9% don't speak English at all).
0.2% of residents speak other Indo-European language at home (74% speak English very well, 26% speak English well).
1.9% of residents speak Asian or Pacific Island language at home (53% speak English very well, 21% speak English well, 26% speak English not well).
0.1% of residents speak other language at home (100% speak English very well).
Foreign born population: 3,634 (11.8%)
(4.3% of them are naturalized citizens)
| Here: | 6.3 |
| State: | 6.5 |
| Here: | 4.0 |
| State: | 4.4 |
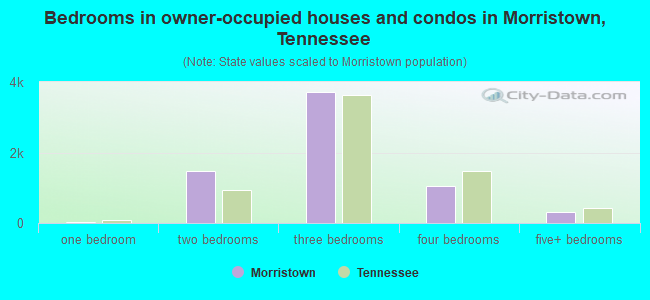
- Bedrooms in owner-occupied houses and condos in Morristown, Tennessee
- 13no bedroom
- 281 bedroom
- 1,4842 bedrooms
- 3,7063 bedrooms
- 1,0434 bedrooms
- 3235+ bedrooms
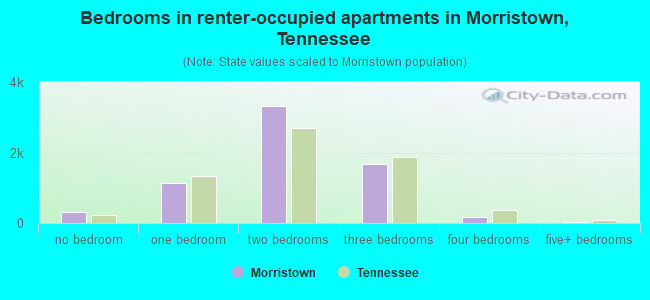
- Bedrooms in renter-occupied apartments in Morristown, Tennessee
- 299no bedroom
- 1,1211 bedroom
- 3,3092 bedrooms
- 1,6773 bedrooms
- 1614 bedrooms
- 265+ bedrooms
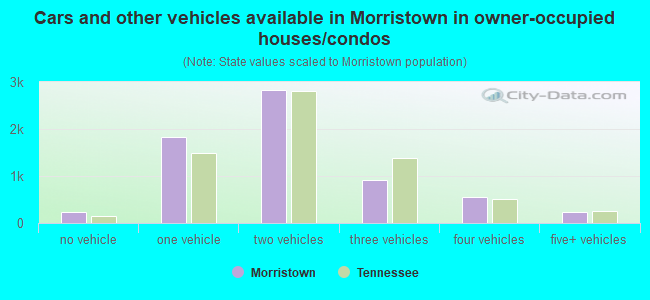
- Cars and other vehicles available in Morristown in owner-occupied houses/condos
- 243no vehicle
- 1,8241 vehicle
- 2,8282 vehicles
- 9243 vehicles
- 5494 vehicles
- 2295+ vehicles
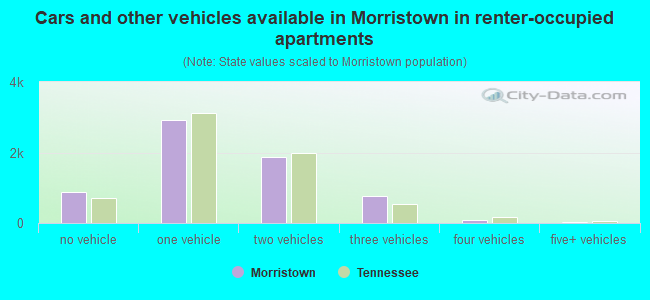
- Cars and other vehicles available in Morristown in renter-occupied apartments
- 890no vehicle
- 2,9311 vehicle
- 1,8852 vehicles
- 7723 vehicles
- 894 vehicles
- 265+ vehicles
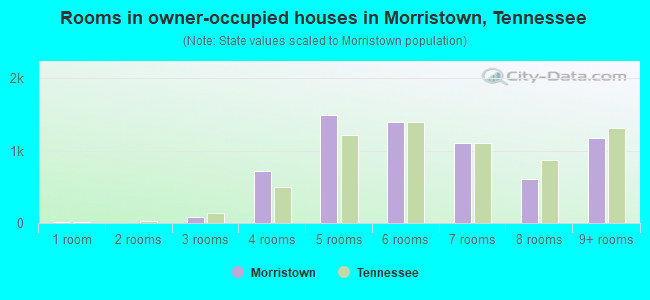
- Rooms in owner-occupied houses in Morristown, Tennessee
- 131 room
- 02 rooms
- 873 rooms
- 7204 rooms
- 1,4955 rooms
- 1,3966 rooms
- 1,1047 rooms
- 6098 rooms
- 1,1749+ rooms
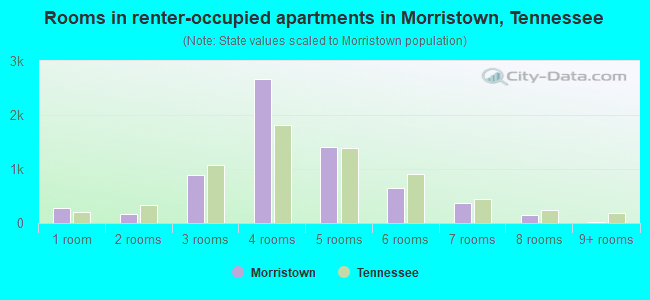
- Rooms in renter-occupied apartments in Morristown, Tennessee
- 2861 room
- 1582 rooms
- 8973 rooms
- 2,6594 rooms
- 1,4055 rooms
- 6506 rooms
- 3667 rooms
- 1458 rooms
- 269+ rooms
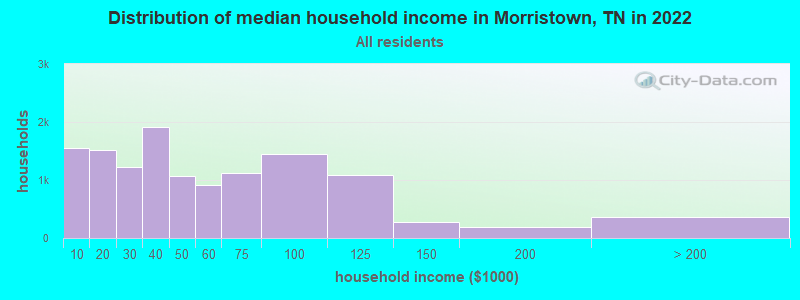
Morristown, TN household income distribution

- 1,559Less than $10,000
- 1,512$10,000 to $19,999
- 1,225$20,000 to $29,999
- 1,921$30,000 to $39,999
- 1,067$40,000 to $49,999
- 911$50,000 to $59,999
- 1,121$60,000 to $74,999
- 1,445$75,000 to $99,999
- 1,084$100,000 to $124,999
- 279$125,000 to $149,999
- 197$150,000 to $199,999
- 357$200,000 or more
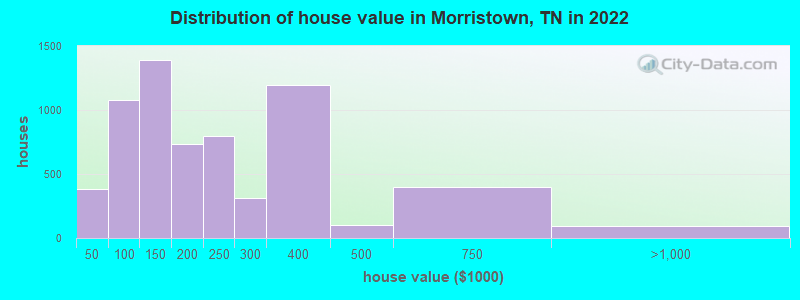
Home value of owner - occupied houses in 2022 in Morristown, TN
-
- 170Less than $10,000
- 50$10,000 to $14,999
- 48$15,000 to $19,999
- 5$20,000 to $24,999
- 15$30,000 to $34,999
- 8$35,000 to $39,999
- 83$40,000 to $49,999
- 126$50,000 to $59,999
- 86$60,000 to $69,999
- 389$70,000 to $79,999
- 246$80,000 to $89,999
- 142$90,000 to $99,999
- 1,023$100,000 to $124,999
- 364$125,000 to $149,999
- 381$150,000 to $174,999
- 351$175,000 to $199,999
- 800$200,000 to $249,999
- 311$250,000 to $299,999
- 1,195$300,000 to $399,999
- 99$400,000 to $499,999
- 394$500,000 to $749,999
- 75$750,000 to $999,999
- 15$1,000,000 to $1,499,999
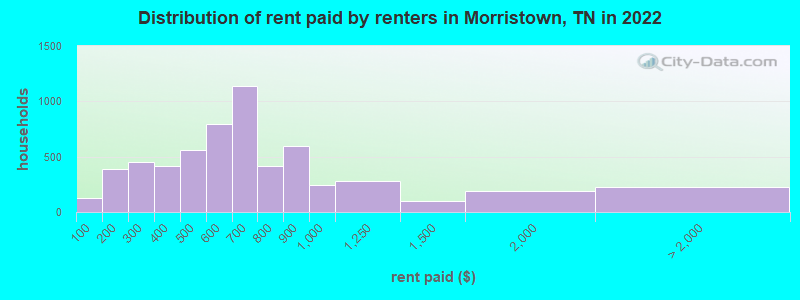
Rent paid by renters in 2022 in Morristown, TN
-
- 131Less than $100
- 174$100 to $149
- 216$150 to $199
- 201$200 to $249
- 252$250 to $299
- 336$300 to $349
- 83$350 to $399
- 252$400 to $449
- 310$450 to $499
- 375$500 to $549
- 417$550 to $599
- 819$600 to $649
- 315$650 to $699
- 298$700 to $749
- 116$750 to $799
- 596$800 to $899
- 244$900 to $999
- 283$1,000 to $1,249
- 97$1,250 to $1,499
- 191$1,500 to $1,999
- 10$2,500 to $2,999
- 42$3,500 or more
- 170No cash rent
Percentage of workers working in this county: 74.7%
Number of people working at home: 485 (3.9% of all workers)
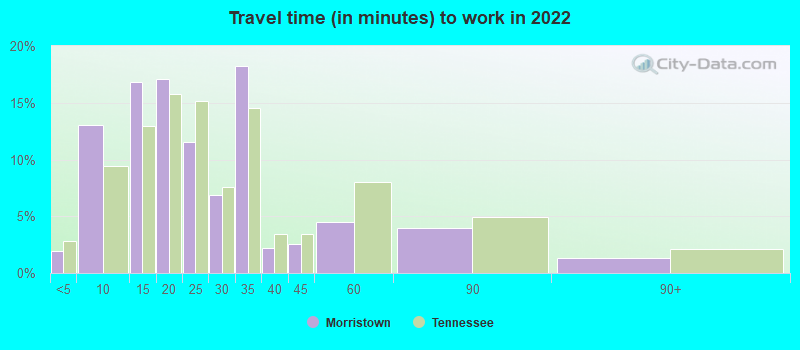
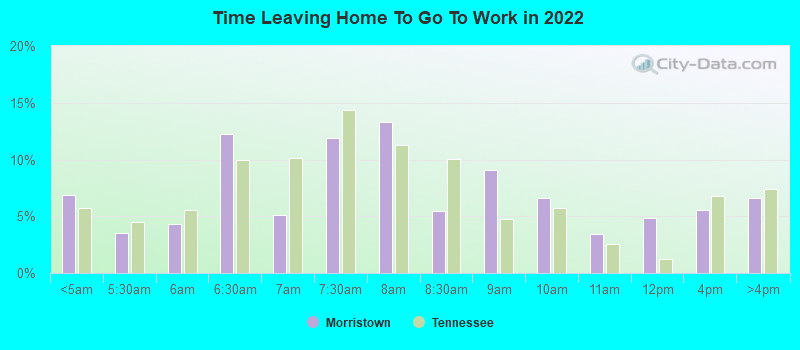
Travel time to work (commute)
- Less than 5 minutes: 436
- 5 to 9 minutes: 2,313
- 10 to 14 minutes: 2,797
- 15 to 19 minutes: 2,391
- 20 to 24 minutes: 1,081
- 25 to 29 minutes: 257
- 30 to 34 minutes: 755
- 35 to 39 minutes: 190
- 40 to 44 minutes: 117
- 45 to 59 minutes: 412
- 60 to 89 minutes: 1,007
- 90 or more minutes: 287
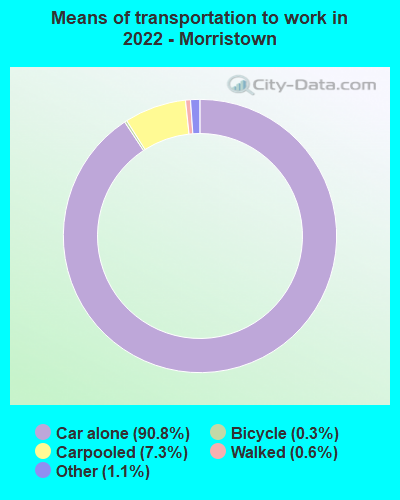
Means of transportation to work:
- Drove a car alone: 23,775 (85.4%)
- Carpooled: 2,013 (7.2%)
- Taxi: 344 (1.2%)
- Bicycle: 83 (0.3%)
- Walked: 151 (0.5%)
- Worked at home: 485 (1.7%)
- Unemployment by race in 2022
- Unemployment rate for White non-Hispanic residents
- 5.0%Males
- 3.5%Females
- Unemployment rate for Black residents
- 2.5%Males
- 10.4%Females
- Unemployment rate for two or more race residents
- 22.9%Males
- 11.3%Females
- Unemployment rate for Hispanic or Latino residents
- 6.3%Males
- 11.9%Females
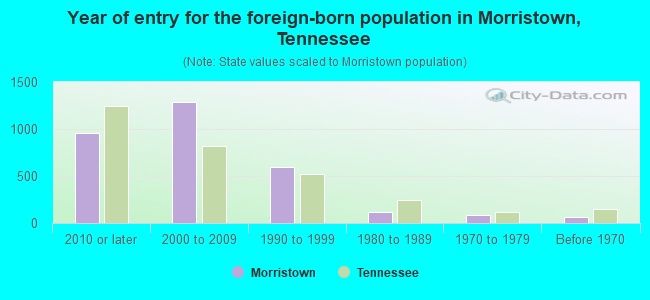
- Year of entry for the foreign-born population in Morristown, Tennessee
- 9542010 or later
- 1,2912000 to 2009
- 5941990 to 1999
- 1171980 to 1989
- 811970 to 1979
- 63Before 1970
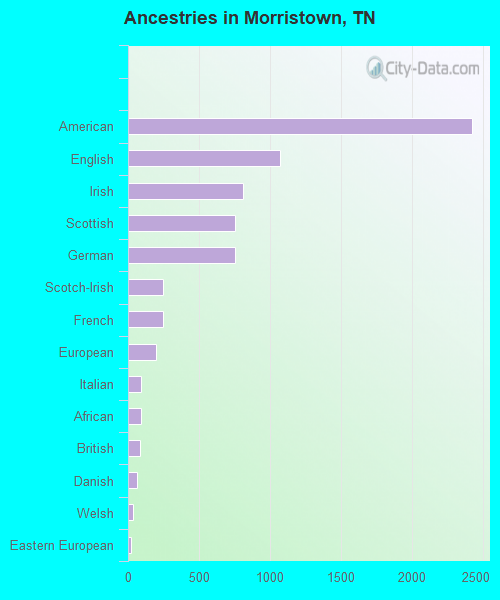
First ancestries reported:
- American: 2,424 (16.1%)
- English: 1,069 (7.1%)
- Irish: 814 (5.4%)
- Scottish: 754 (5.0%)
- German: 752 (5.0%)
- Scotch-Irish: 249 (1.7%)
- French: 248 (1.6%)
- European: 197 (1.3%)
- Italian: 94 (0.6%)
- African: 93 (0.6%)
- British: 82 (0.5%)
- Danish: 62 (0.4%)
- Welsh: 35 (0.2%)
- Eastern European: 24 (0.2%)
- Belgian: 22 (0.1%)
- Northern European: 20 (0.1%)
- Swedish: 19 (0.1%)
- Dutch: 17 (0.1%)
- Canadian: 16 (0.1%)
- Norwegian: 16 (0.1%)
- Polish: 15 (0.10%)
- Hungarian: 9 (0.06%)
- Russian: 4 (0.03%)
Most common places of birth for foreign-born residents (%):
| Morristown: | 49.1% (1,566) |
| Tennessee: | 23.0% (86,435) |
| Morristown: | 14.6% (467) |
| Tennessee: | 5.7% (21,286) |
| Morristown: | 6.2% (198) |
| Tennessee: | 0.1% (404) |
| Morristown: | 5.7% (181) |
| Tennessee: | 4.6% (17,433) |
| Morristown: | 4.1% (131) |
| Tennessee: | 3.1% (11,640) |
| Morristown: | 4.0% (127) |
| Tennessee: | 2.7% (10,313) |
| Morristown: | 2.7% (85) |
| Tennessee: | 0.9% (3,225) |
| Morristown: | 2.5% (79) |
| Tennessee: | 2.4% (8,894) |
| Morristown: | 1.5% (48) |
| Tennessee: | 6.1% (23,079) |
Place of birth for U.S.-born residents:
- This state: 16,354
- Other state: 10,744
- Northeast: 1,343
- Midwest: 2,094
- South: 4,926
- West: 2,454
90.1% of Morristown residents lived in the same house 1 years ago.
Out of people who lived in different houses, 32.1% lived in this county.
Out of people who lived in different counties, 71.8% lived in Tennessee.
| Morristown: | 90.1% |
| State average: | 87.0% |
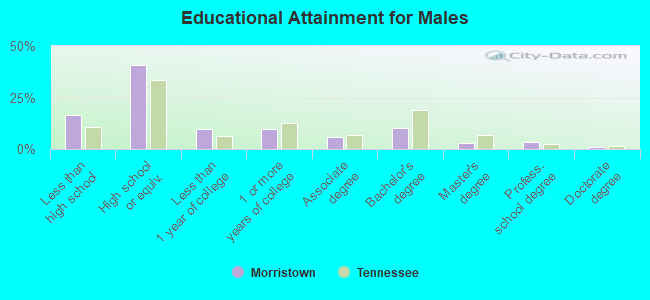
Education attainment for males 25 years and older:
- No schooling: 104
- Nursery to 4th grade: 122
- 5th and 6th grade: 144
- 7th and 8th grade: 658
- 9th grade: 173
- 10th grade: 75
- 11th grade: 187
- 12th grade, no diploma: 204
- High school graduate (or equivalency): 4,139
- Less than 1 year of college: 975
- Some college more than 1 year, no degree: 1,011
- Associate degree: 596
- Bachelor's degree: 1,019
- Master's degree: 278
- Professional school degree: 353
- Doctorate degree: 123
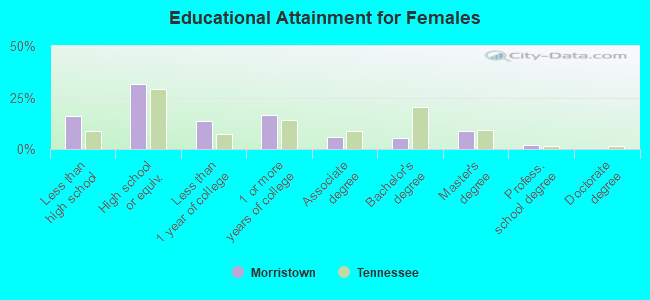
Education attainment for females 25 years and older:
- No schooling: 76
- Nursery to 4th grade: 88
- 5th and 6th grade: 171
- 7th and 8th grade: 439
- 9th grade: 260
- 10th grade: 221
- 11th grade: 347
- 12th grade, no diploma: 149
- High school graduate (or equivalency): 3,439
- Less than 1 year of college: 1,496
- Some college more than 1 year, no degree: 1,769
- Associate degree: 611
- Bachelor's degree: 603
- Master's degree: 938
- Professional school degree: 203
- Doctorate degree: 8
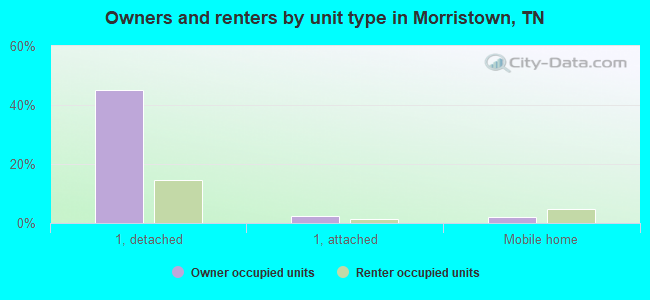
Housing units in structures:
- One, detached: 8,565
- One, attached: 431
- Two: 1,158
- 3 or 4: 886
- 5 to 9: 598
- 10 to 19: 937
- 20 to 49: 420
- 50 or more: 240
- Mobile homes: 934
Median worth of mobile homes: $11,098
Housing units lacking complete kitchen facilities in 2022: 2.0%
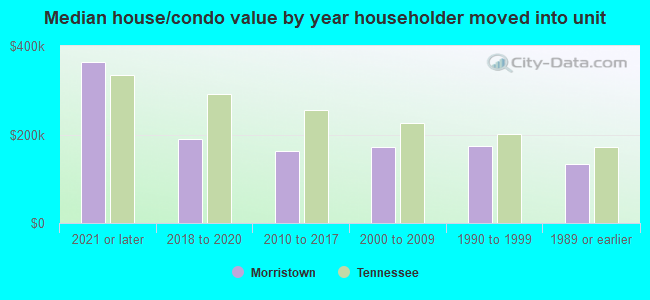
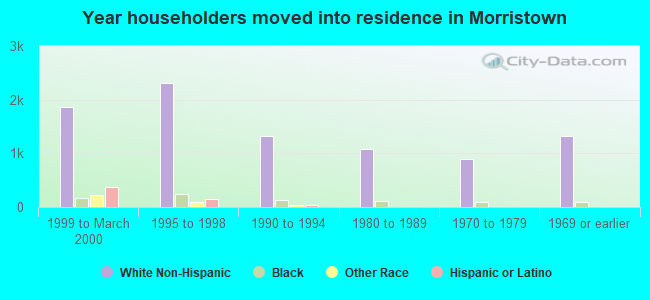
House/condo owner moved in on average 13 years ago
Renter moved in on average 5 years ago
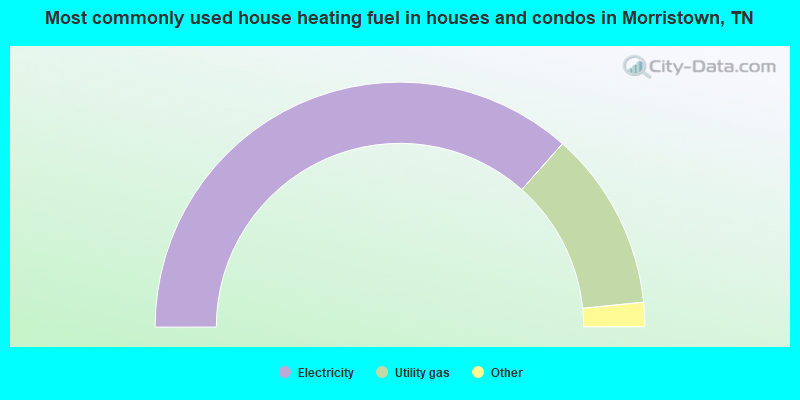
- 73.1%Electricity
- 23.7%Utility gas
- 2.2%Bottled, tank, or LP gas
- 0.9%Wood
- 0.1%Fuel oil, kerosene, etc.
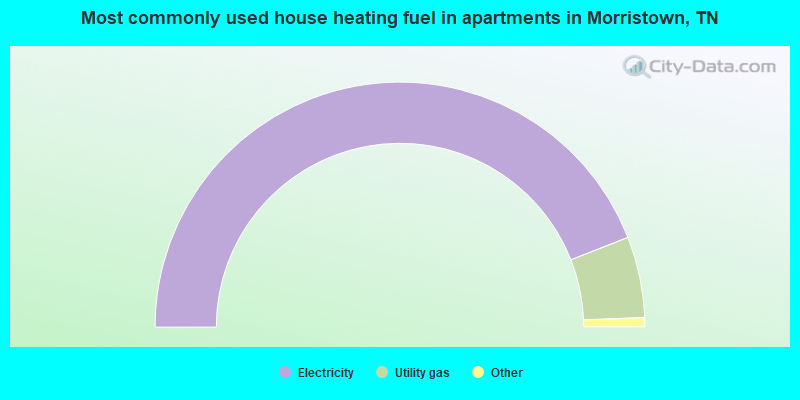
- 88.1%Electricity
- 10.7%Utility gas
- 0.6%Bottled, tank, or LP gas
- 0.4%No fuel used
- 0.2%Fuel oil, kerosene, etc.
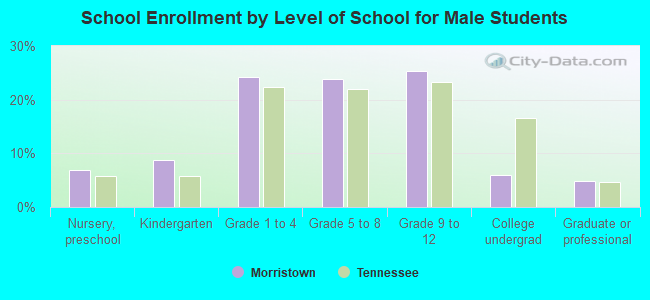
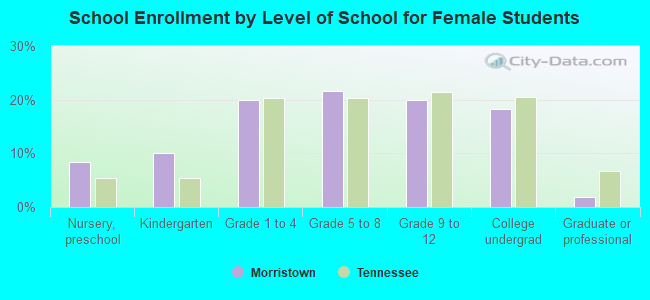
Private vs. public school enrollment:
| Here: | 6.8% |
| Tennessee: | 15.0% |
| Here: | 3.2% |
| Tennessee: | 16.2% |
| Here: | 4.5% |
| Tennessee: | 23.5% |